
Abstract
Objective
Colon cancer ranks among the most prevalent malignancies globally. Despite advances in therapy, patients’ prognosis remains poor, particularly in advanced stages. Programed cell death (PCD), including over 20 patterns, plays a pivotal role in colon cancer progression. However, a systematic analysis of the PCD regulatory network in colon cancer is lacking.
Methods
We comprehensively analyzed various PCD patterns in colon cancer using bulk transcriptomic and single-cell transcriptomic data from GEO and TCGA databases. Multiple machine learning algorithms were used to identify Key PCD patterns. A novel combined cell death index (CCDI) was constructed using 117 algorithm combinations. Functional enrichment, immune infiltration, nomogram construction, and pseudotime trajectory analyses were also performed.
Results
Different PCD patterns significantly impacted colon cancer prognosis. Disulfidptosis and anoikis were consistently identified as critical PCD patterns. The CCDI, based on these genes, outperformed existing models in prognostic prediction. Additionally, disulfidptosis and anoikis scores enriched in endothelial cells (ECs), which exhibited close interactions with other cell types. Six genes (CD36, CLU, FLNA, NOTCH3, TAGLN, TIMP1) were identified as key regulators during ECs phenotypic transition.
Conclusions
This study demonstrates the key roles of disulfidptosis and anoikis, and establishes a novel CCDI model with prognostic value in colon cancer. Additionally, it insights into ECs phenotypic transition and their regulatory genes, provides new therapy targets for colon cancer.
Introduction
Colon cancer ranks among the most prevalent malignancies globally, with approximately 1.1 million new cases and 500,000 deaths reported worldwide in 2022. 1 The pathogenesis of colon cancer involves complex mechanisms, including genetic mutations, dysregulation of carcinogenic factors, epigenetic abnormalities, and chronic inflammation. 2 Despite significant advances in treatment, the prognosis for colon cancer patients remains poor. 2 While the five-year survival rate exceeds 90% for early-stage patients, it drops to approximately 10% for those with advanced disease. 2 Consequently, elucidating key drivers in colon cancer development is critical for identifying novel therapeutic strategies.
Programed cell death (PCD), an evolutionarily conserved and genetically regulated cellular suicide process, includes over 20 forms, such as apoptosis, autophagy, anoikis, alkaliptosis, ammonia-induced cell death (AICD), autosis, cuproptosis, disulfidptosis, efferocytosis, entosis, ferroptosis, immunogenic cell death (ICD), lysosome-dependent cell death (LCD), mitotic catastrophe (MCD), mitochondrial permeability transition-driven necrosis (MPTDN), necroptosis, necrosis by sodium overload (NECSO), netosis, oxeioptosis, panoptosis, parthanatos, pyroptosis, and zinc-dependent cell death (ZDCD).2–5 Targeted modulation of ferroptosis-related pathways (e.g. SLC7A11, ROS, and GSH) can effectively enhance the killing efficacy against treatment-resistant tumor cells while minimizing toxicity to normal tissues, thereby presenting a novel therapeutic strategy for colorectal cancer. 6 Modulation of PDE3B-mediated Apelin pathway can trigger cuproptosis and delay colon cancer progression. 7 Panoptosis in colon cancer plays a critical role in tumor suppression by orchestrating pyroptotic, apoptotic, and necroptotic pathways through the panoptosome complex (involving ZBP1, RIPK1, etc.), modulating tumor immunity and microenvironment, and offering potential for targeted therapies and immunotherapy synergy. 8 Pyroptosis plays a complex role in both colon cancer cells and the immune microenvironment.9,10 These previous studies have shown that PCD plays a pivotal role in critical events of colon cancer progression. 2 However, a systematic analysis of the PCD regulatory network in colorectal cancer is currently lacking, particularly regarding the mechanisms by which PCD orchestrates cellular interactions.
The integrated analysis of bulk transcriptome and single-cell RNA-sequencing (scRNA-seq) has demonstrated powerful capabilities in elucidating tumor mechanisms and has been widely applied.11,12 Previous studies have successfully utilized this integrated analysis to elucidate the role patterns of PCD in esophageal squamous cell carcinoma, cutaneous melanoma, and head and neck cancer.13–15 Hence, in this study, we comprehensively analyzed different modes of PCD in colon cancer using both bulk transcriptome and scRNA-seq data. We established a novel combined cell death index (CCDI) closely associated with prognosis and elucidated the pivotal PCD patterns as well potential regulatory genes in colon cancer.
Methods
The reporting of this study conforms to TRIPOD guidelines. 16
Data source and preprocessing
Human colon cancer microarray data GSE17538, GSE28722, GSE29623, GSE39582, GSE72970, GSE87211, and scRNA-seq data GSE200997 were obtained from GEO database (https://www.ncbi.nlm.nih.gov/geo/).17–23 The probe identifiers in the microarray datasets were mapped to corresponding gene names using the annotation file provided by GEO (Supplemental Table S1). Missing expression values were imputed using the k-Nearest Neighbor (kNN) algorithm via impute package (version 1.80.0, https://cran.r-project.org/package = impute). The expression data were then log2-transformed to stabilize variance. GSE17538, GSE28722, GSE29623, and GSE39582 were merged as GEO-1 cohort. GSE72970 and GSE87211 were merged as GEO-2 cohort. Batch effects were removed using the sva package (version 3.45.0, https://www.bioconductor.org/packages/release/bioc/html/sva.html), and the effectiveness of batch correction was validated through principal component analysis (Supplemental Figure S1). Human colon cancer RNA-seq data COAD were downloaded from TCGA database (https://portal.gdc.cancer.gov/), 24 annotated with GENCODE V39 (https://www.gencodegenes.org/) and transformed into transcripts per million. The clinical information of colon cancer patients were displayed in Supplemental Table S2. The genes for apoptosis (n = 346), autophagy (n = 222), anoikis (n = 434), alkaliptosis (n = 7), AICD (n = 5), autosis (n = 1831), cuproptosis (n = 10), disulfidptosis (n = 23), efferocytosis (n = 30), entosis (n = 31), ferroptosis (n = 492), ICD (n = 3452), LCD (n = 233), MCD (n = 1701), MPTDN (n = 204), necroptosis (n = 756), NECSO (n = 2), netosis (n = 69), oxeioptosis (n = 5), panoptosis (n = 31), parthanatos (n = 301), pyroptosis (n = 27), and ZDCD (n = 24) were obtained from FerrDB V2 (https://www.zhounan.org/ferrdb/legacy/), XDeathDB (https://pcm2019.shinyapps.io/XDeathDB/) and previous studies (Supplemental Table S3).2–5
Identification of key PCD patterns
A total of six machine learning algorithms including least absolute shrinkage and selection operator (lasso), ridge, elastic net (α = 0.1), CoxBoost, random forest (RSF) and gradient boosting machine (GBM) were employed to perform survival related feature filter. Those exhibiting significant prognostic values across all algorithms are considered as key PCD patterns.
Construction and validation of CCDI
The differentially expressed genes (DEGs) were analyzed between normal and tumor tissues in COAD cohort. After intersecting with PCD-related genes, candidate genes were identified. To develop a CCDI with high accuracy and stability performance, Mime1 package (version 0.0.0.9000) 25 was used to integrate 10 machine learning algorithms and generated 117 algorithm combinations. The integrative algorithms included RSF, elastic net, Lasso, Ridge, stepwise Cox, CoxBoost, partial least squares regression for Cox (plsRcox), supervised principal components (SuperPC), GBM, and survival support vector machine (survival-SVM). For each model, the Harrell's concordance index (C-index) and one year area under curve (AUC) were calculated across all cohorts. The model with highest average C-index and one-year AUC between GEO-1 cohort (training set) and COAD cohort (internal validation) was considered optimal and served as CCDI. GEO-2 cohort was used as an external validation.
Functional enrichment analysis
Gene sets “c2.cp.kegg.v7.4.symbols.gmt” and “h.all.v7.5.1.symbols.gmt” were downloaded from MSigDB (https://www.gsea-msigdb.org/gsea/msigdb). 26 Gene set variation analysis (GSVA) was conducted using the clusterProfiler package (version 4.14.6). 27
Immune infiltration analysis
The immune infiltration was estimated using abis, xcell, epic, MCPcounter, ssGSEA, estimate, and cibersort algorithms via immunedeconv package (version 2.1.0, https://github.com/icbi-lab/immunedeconv).28,29
Establishment of nomogram
Univariate Cox analysis was used to identify independent prognosis factors. Setting a threshold of p < .001, CCDI, age, stage, recurrence, T, N and M were employed to construct a nomogram via rms package (version 8.1.0, https://cran.r-project.org/web/packages/rms/index.html).
scRNA-seq, cell communication and pseudotime analysis
The scRNA-seq dataset GSE200997 containing 49,254 cells was analyzed using Seurat (version 5.3.1). 30 Initial quality control excluded cells expressing fewer than 300 genes. Subsequent processing included data normalization via the NormalizeData function and selection of 2000 highly variable genes through FindVariableFeatures. Cell clustering was performed using unified manifold approximation and project (UMAP) dimensionality reduction, with cluster identities determined by reference to the CellMarker 2.0 database (http://117.50.127.228/CellMarker/) and SingleR package (Version 2.8.0, https://github.com/dviraran/SingleR). Cell communication patterns were examined by CellChat package (version 1.6.1), 31 while pseudotemporal ordering of endothelial cells (ECs) was reconstructed using both Monocle3 package (version 1.3.7, https://github.com/cole-trapnell-lab/monocle3) and CytoTRACE2 package (version 1.1.0, https://github.com/digitalcytometry/cytotrace2) based on their transcriptional profiles. 32 ECs subtypes were annotated using marker genes from prior literature (Supplemental Table S4). 33
Statistical analysis
All statistical analyses were performed using R (version 4.4.2, https://www.r-project.org/). Associations between GSVA scores/immune infiltration levels and CCDI were evaluated through Pearson correlation analysis. Survival differences in overall survival (OS) and relapse-free survival (RFS) were examined with the log-rank test, implemented via the survminer package (version 0.5.1, https://cran.r-project.org/src/contrib/Archive/survminer/). A significance threshold of p < .05 was applied throughout the study, except where noted otherwise.
Results
PCD score prognosis analysis in colon cancer
GSE17538, GSE28722, GSE29623, and GSE39582 were downloaded from the GEO database. After merging these datasets and removing batch effects using the sva package to expand the sample size, we calculated the PCD score for each colon cancer patient in the combined cohort via ssGSEA. Prognostic analysis revealed that patients with high scores for AICD, apoptosis, cuproptosis, efferocytosis, LCD, NECSO, netosis, oxeiptosis, panoptosis, pyroptosis, and ZDCD had significantly longer median OS (mOS) compared to patients with low scores (Figure 1 and Supplemental Table S5). Conversely, patients with high scores for alkaliptosis, anoikis, autophagy, autosis, disulfidptosis, entosis, ferroptosis, ICD, and necroptosis showed significantly shorter median OS compared to those with low scores (Figure 1 and Supplemental Table S3). These data indicated that different forms of PCD play crucial roles in the prognosis of colon cancer.
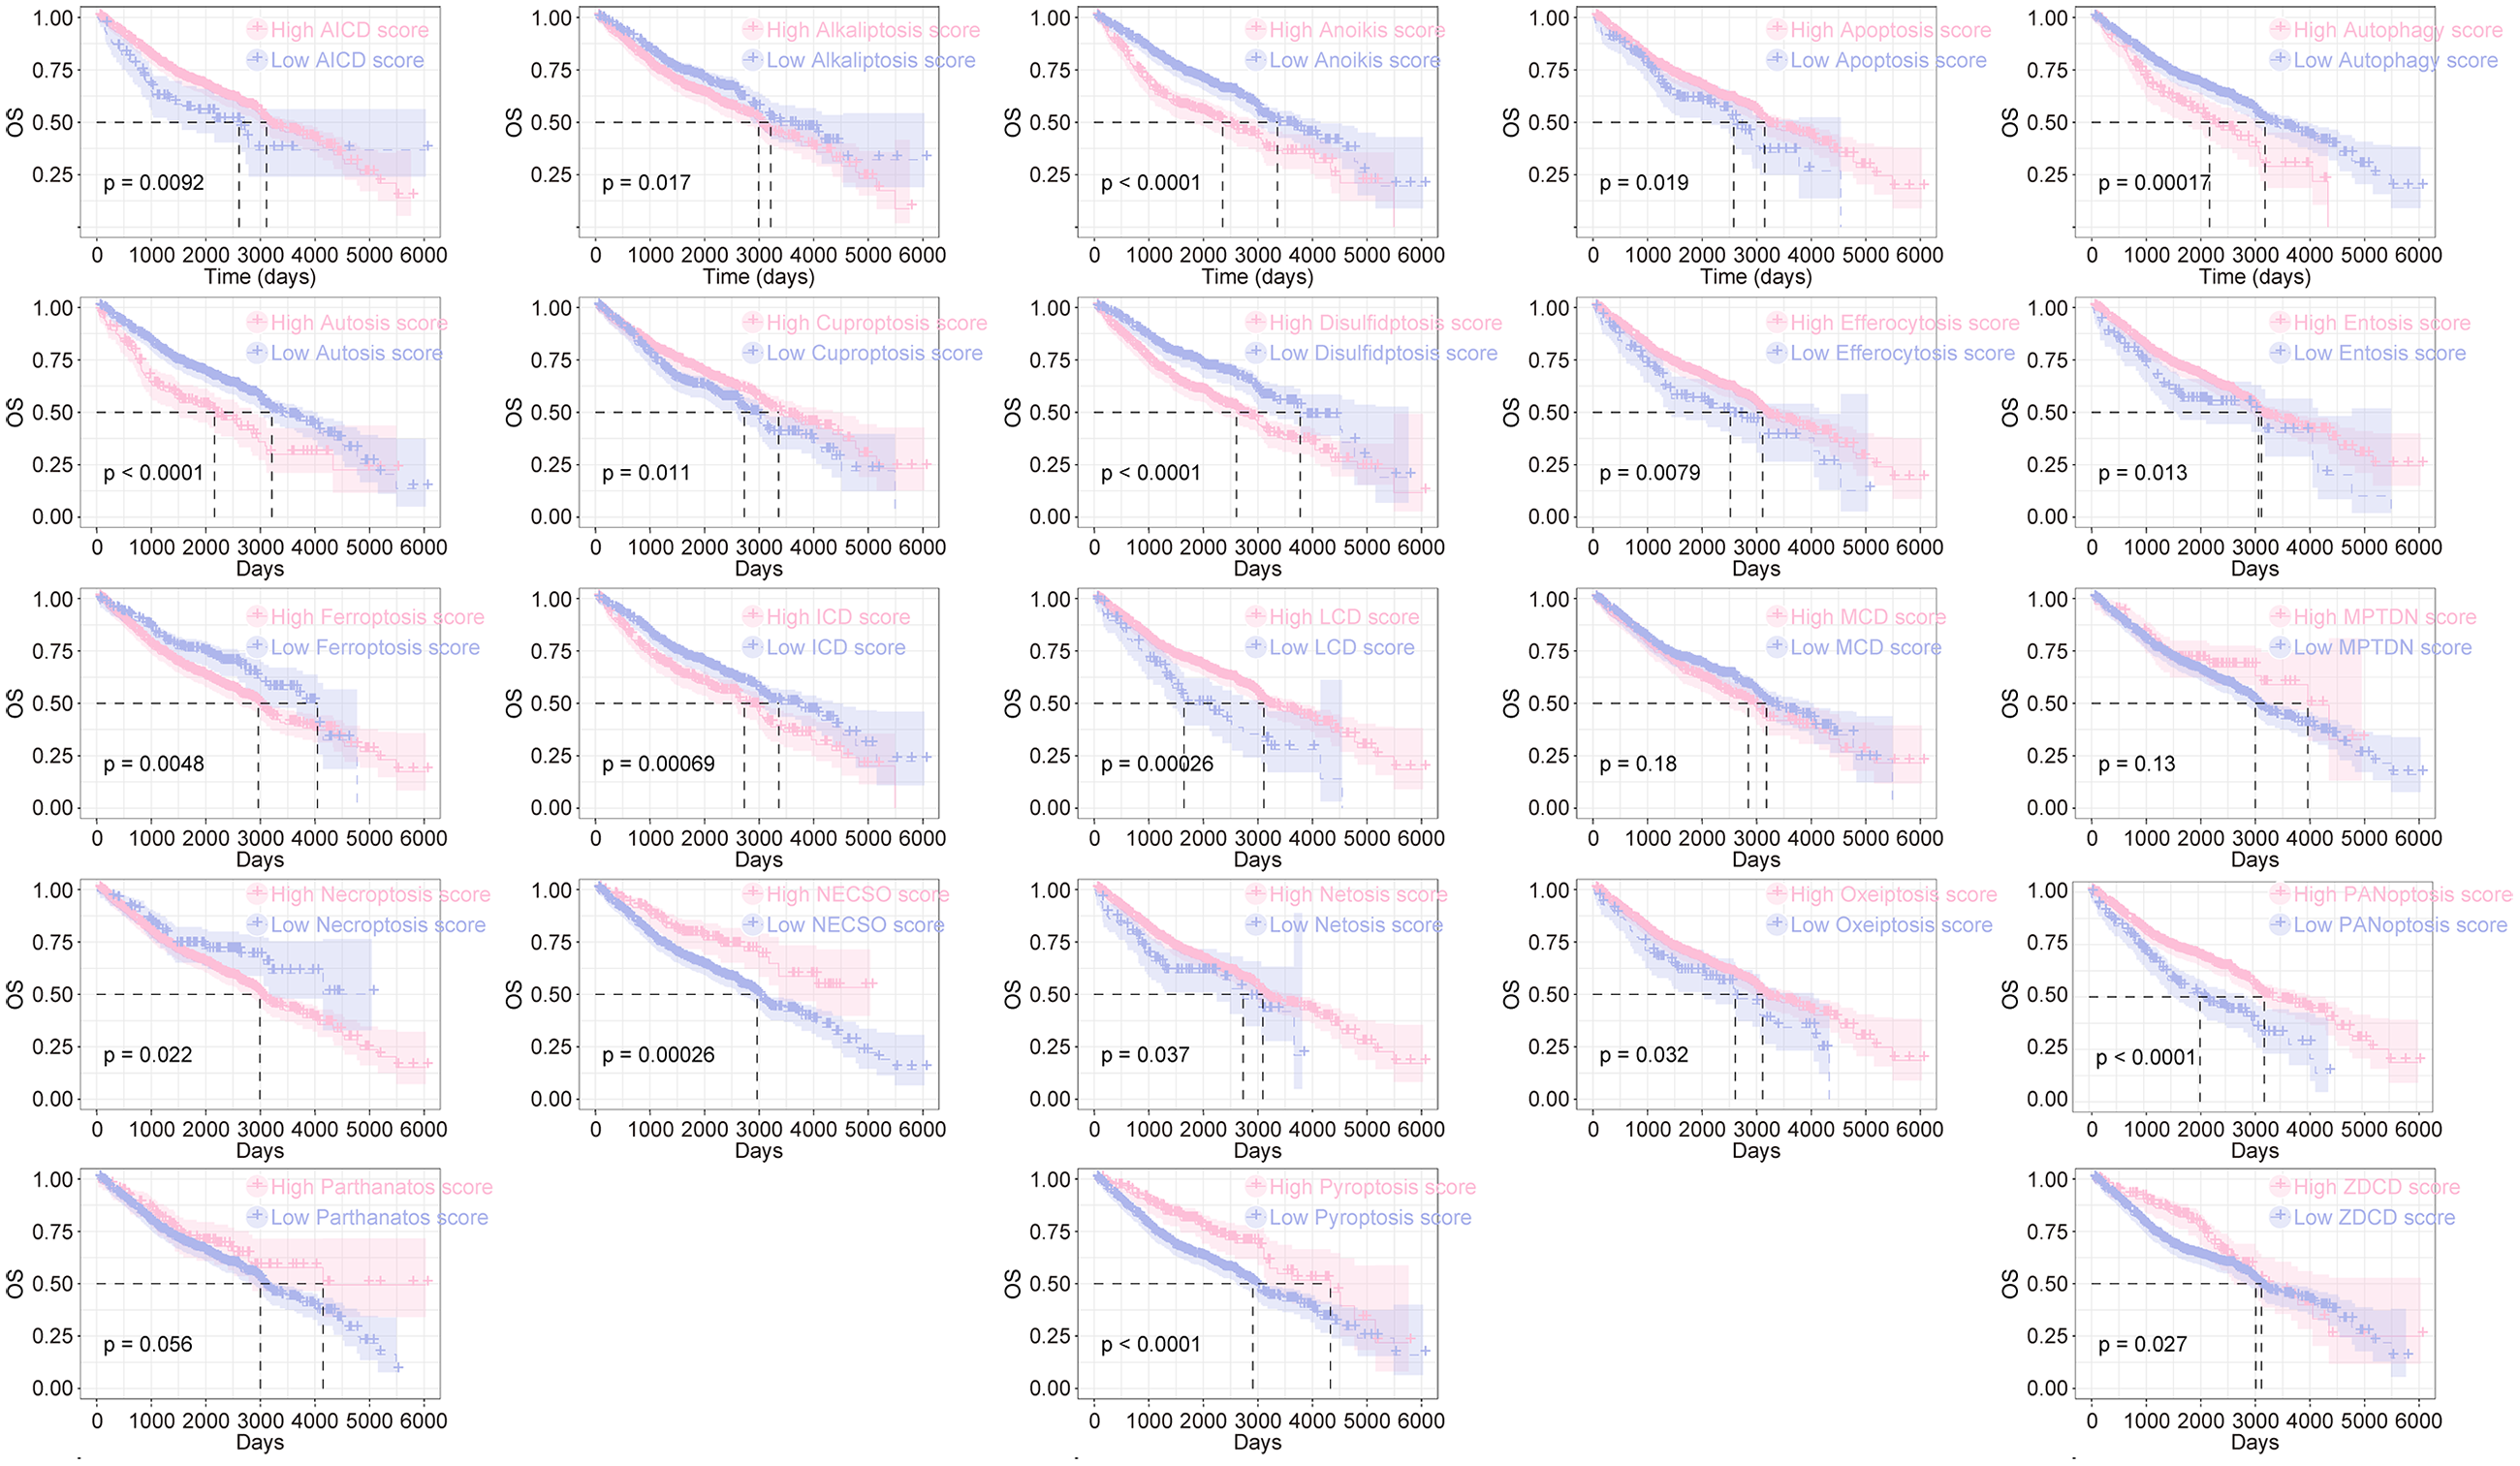
Prognostic analysis of PCD score in colon cancer. GSE17538, GSE28722, GSE29623, GSE39582 were merged as GEO-1 cohort, and the PCD score was calculated using ssGSEA. Kaplan–Meier curve was used for survival analysis (Log-rank test).
Disulfidptosis and anoikis are critical PCD modalities influencing colon cancer prognosis
Six machine learning algorithms—lasso, ridge, elastic net (α = 0.1), RSF, CoxBoost, and GBM—were employed for survival-associated feature selection, identifying 23, 17, 17, 12, 8, and 21 prognostic PCD subtypes, respectively (Figure 2(A)–(F), Supplemental Table S6). Intersection analysis revealed that disulfidptosis and anoikis consistently demonstrated robust predictive value across all survival models (Figure 2(G)), suggesting their critical roles as key PCD modalities affecting colon cancer outcomes.

Machine learning screening of PCD patterns closely related to the prognosis of colon cancer. (A)–(F). Feature selection parameter maps for different machine learning, including lasso (A), ridge (B), elastic net (α = 0.1, C), RSF (D), CoxBoost (E), and GBM (F). (G). The Venn diagram shows the intersection of features selected by different machine learning models.
Development of CCDI for colon cancer
DEGs between colon tumors and adjacent tissues in the COAD dataset were identified (Figure 3(A)). Intersecting these DEGs with disulfidptosis/anoikis-related genes yielded 84 candidate genes (Figure 3(B)). Subsequently, 117 machine learning algorithm combinations—randomly integrating lasso, ridge, elastic net, StepCox, plsRcox, RSF, CoxBoost, GBM, SuperPC, and Survival-SVM—were utilized to construct CCDI. Among these, the StepCox[backward] + RSF and StepCox[both] + RSF combinations achieved the highest average C-index and one-year AUC values in training set (GEO-1 cohort) and internal validation (COAD cohort, Figure 3(E), Supplemental Tables S7 and S8). Consequently, one optimal combination was selected as the CCDI. We further evaluated the performance advantages of CCDI compared to previous prediction models in colon cancer. In the training set (GEO-1), the C-index and 1-year AUC values of CCDI were higher than those of the 24 previously prediction models, including two anoikis-based models (AS1 and AS2), two disulfidptosis-based models (DSF1 and DSF2),34–37 and 20 other types of prediction models. In the internal validation (COAD) and external validation (GEO-2), the C-index and 1-year AUC values of CCDI also outperformed those of the two anoikis-based and two disulfidptosis-based models, and were higher than the majority of the remaining 20 prediction models (Figure 3(D) and (E), Supplemental Table S9).
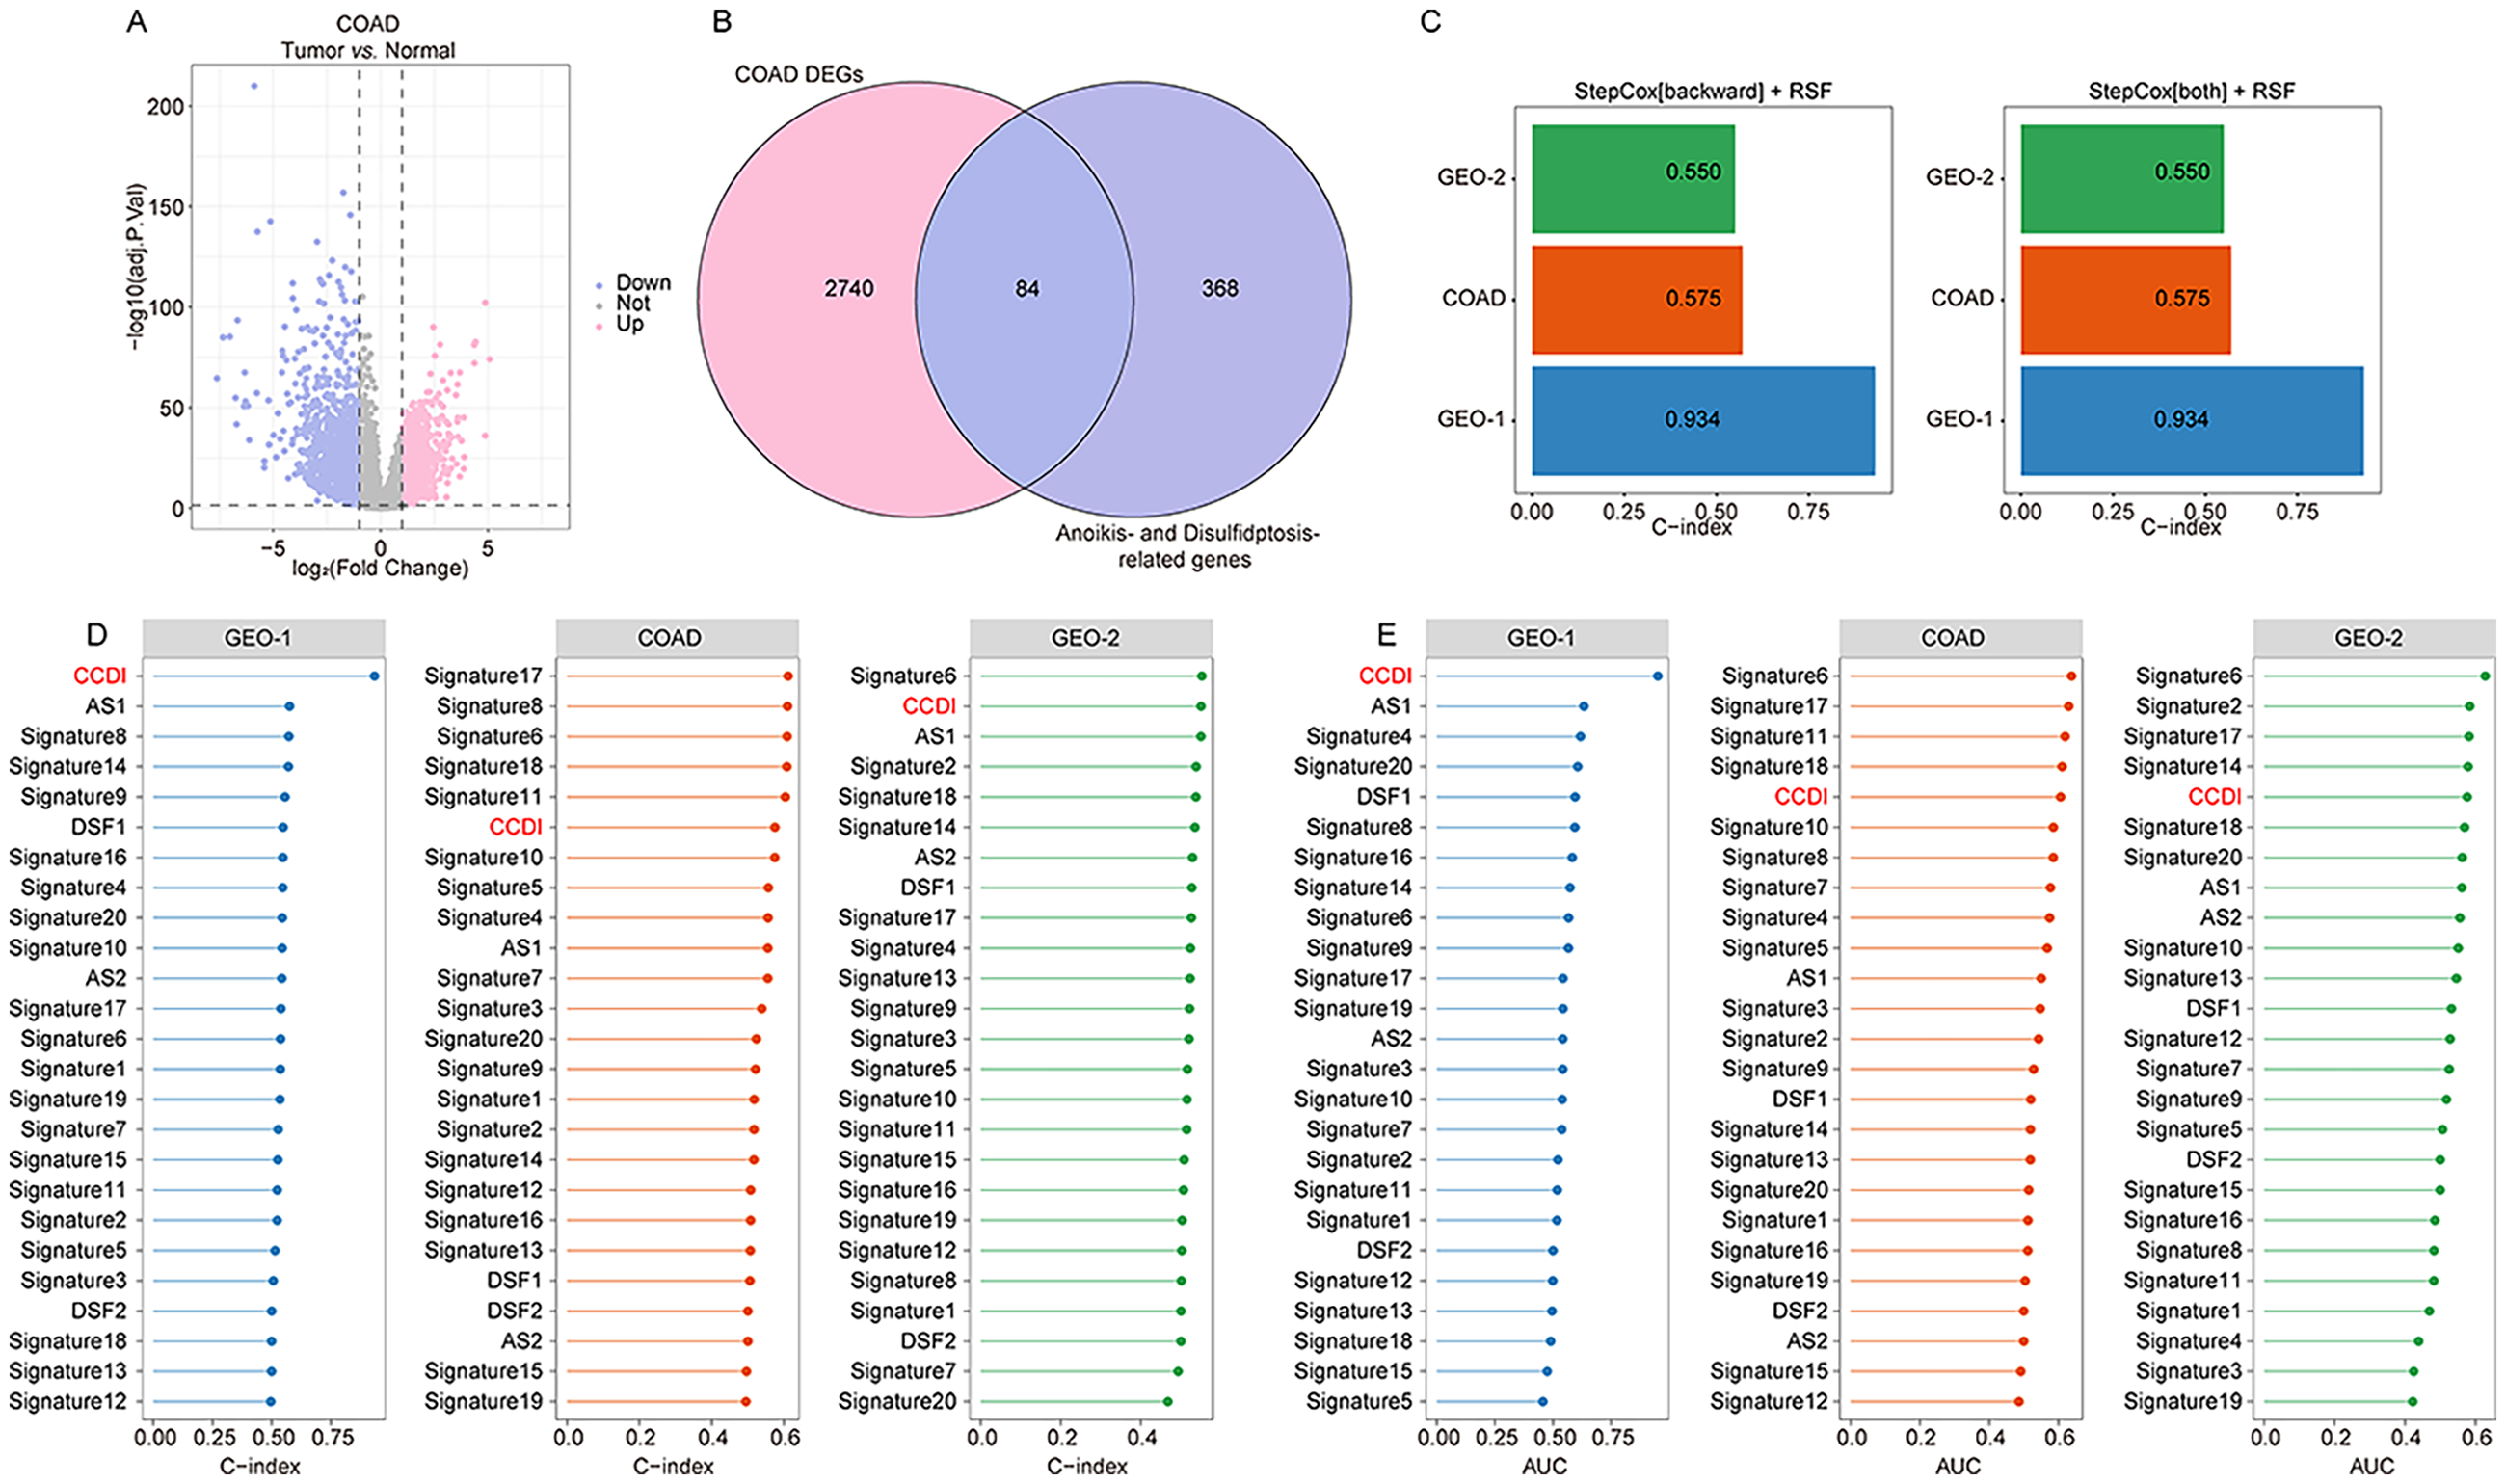
Machine learning algorithm combinations for establishing CCDI. (A). Using limma package to identify DEGs between colon cancer tissues and adjacent tissues in COAD dataset. (B). The intersection of DEGs in colon cancer and disulfidptosis/anoikis-related genes. (C). C-index of StepCox [backward] + RSF and StepCox [both] + RSF. (D)–(E). Comparison of C-index (D) and one-year AUC values (E) between CCDI and previous report scores in GEO-1, COAD and GEO-2 cohort.
Prognostic impact of CCDI in colon cancer
Patients with high CCDI scores exhibited a significantly shorter mOS than low-scoring patients in both the GEO-1 cohort (840 vs. 4543 days, p < .0001), COAD cohort (2475 days vs. not reached, p = .016), and external validation (843 vs. 3305 days, p = .0022) (Figure 4(A) and Supplemental Table S10). Consistent findings were observed across subcohorts of GEO-1 and external validation: GSE17538 (683 vs. 4046 days, p < .0001), GSE28722 (1267 vs. 3060 days, p < .0001), GSE29623 (571 days vs. not reached, p < .0001), GSE39582 (900 days vs. not reached, p < .0001), GSE72970 (521 vs. 720 days, p = .069), GSE87211 (not reached vs. not reached, p = .041) (Supplemental Figure S2 and Table S10). Furthermore, significantly shorter mRFS was observed in high-CCDI patients within the GEO-1 cohort (600 days vs. not reached, p < .0001), and subcohort GSE17538 (746 days vs. not reached, p < .0001), as well GSE39582 (540 days vs. not reached, p < .0001). A trend toward shorter RFS was noted in GSE29623 (2384 days vs. not reached, p = .11) (Supplemental Figure S2 and Table S10). In the external validation, high-CCDI patients also had a shorter mRFS than low-CCDI patients (385 vs. 1399 days, p = .0044). Of note, CCDI was significantly associated with various cancer-related signaling, abnormal metabolism and immune infiltration in colon cancer (Supplemental Figure S3). Additionally, univariate Cox analysis further identified CCDI, age, stage, recurrence status, T, N, and M as significant prognostic factors (Figure 4(C)). A CCDI-based nomogram incorporating these parameters demonstrated strong calibration accuracy between predicted and observed outcomes (Figure 4(D) and (E)).

Prognostic analysis and nomogram of CCDI. (A)–(B). Prognostic analysis of CCDI (Log-rank test). (C). In the GSE39582 cohort, univariate Cox analysis was conducted to evaluate the predictive value of CCDI and clinical parameters for the prognosis of colon cancer. (D)–(E). Nomogram and calibration curve based on CCDI.
Identification of key PCD patterns during ECs subtype transformation
To elucidate the roles of disulfidptosis and anoikis in colon cancer, we analyzed the GSE200997 scRNA-seq dataset. UMAP clustering segregated cells into 10 clusters, subsequently annotated as colon epithelial cells (cancer cells), T cells, B cells, ECs, cancer-associated fibroblasts, and monocytes (Figure 5(A) and (B)). Single-cell ssGSEA revealed significant enrichment of disulfidptosis and anoikis scores within ECs (Figure 5(C)). Cell–cell interaction analysis demonstrated extensive crosstalk between ECs and other cell types (Figure 5(D)), implicating ECs-associated disulfidptosis/anoikis as pivotal in colon cancer progression.
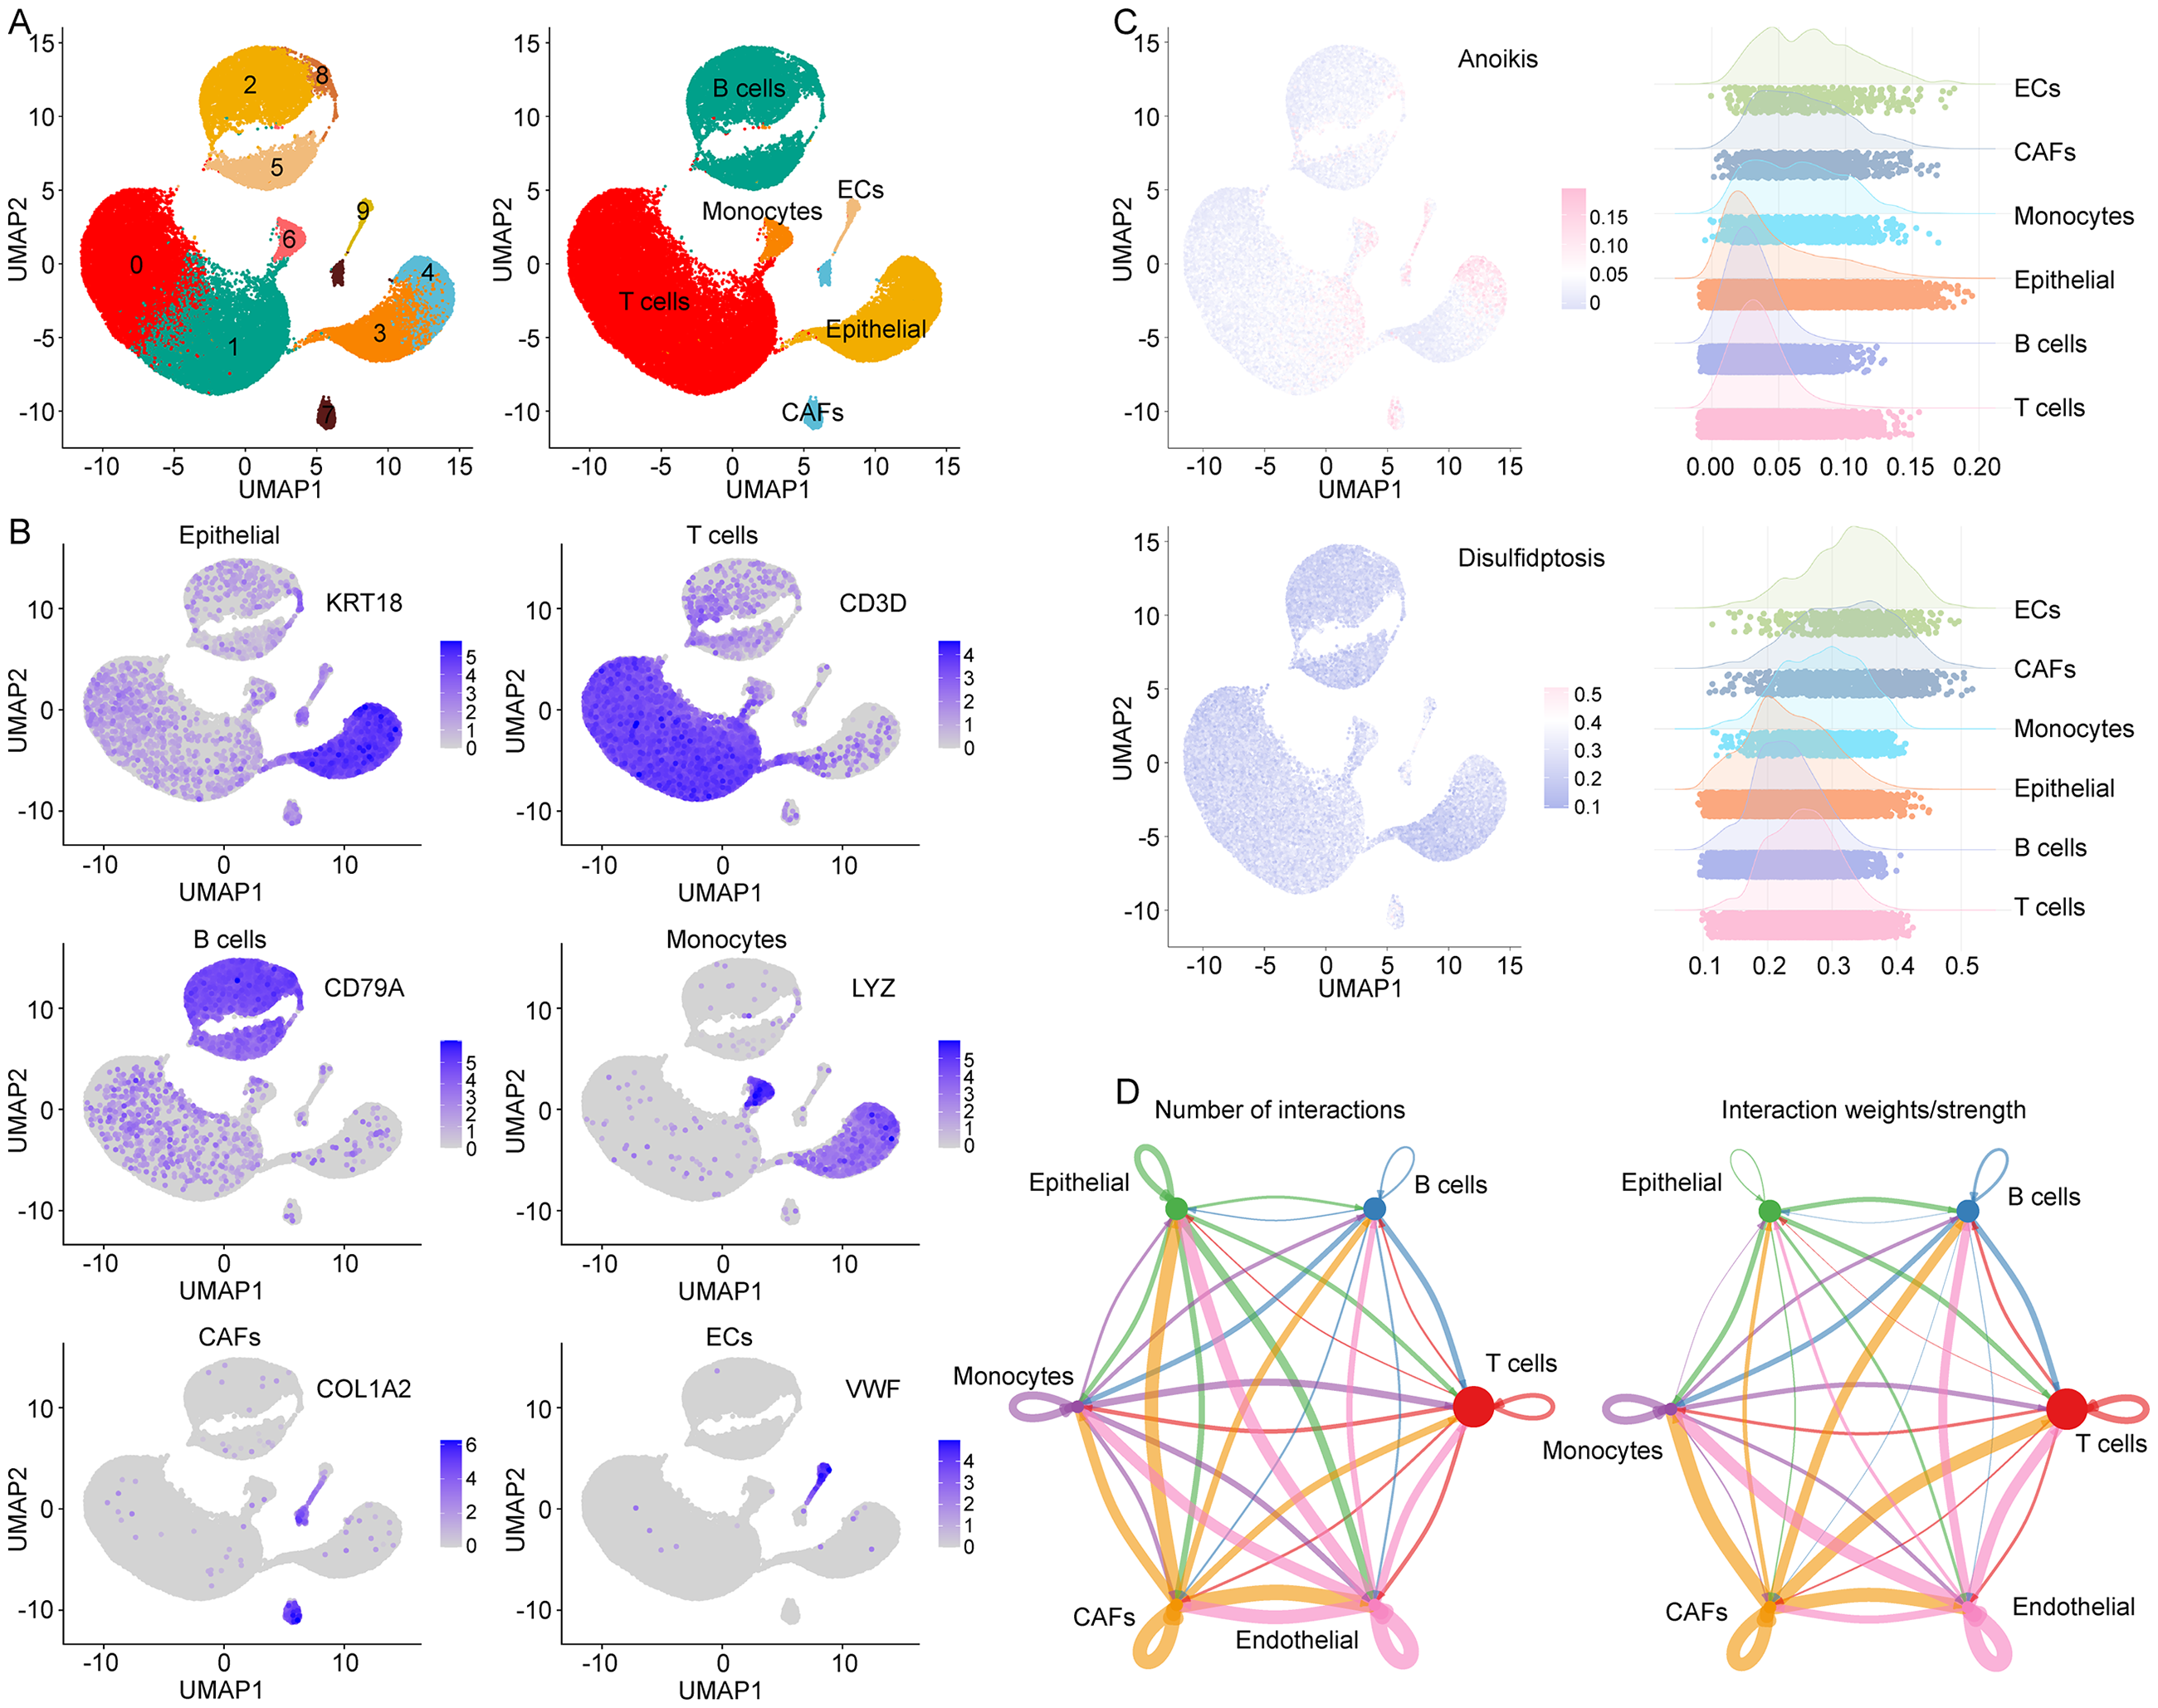
Single cell analysis in GSE200997 cohort. (A). UMAP analysis identified six major cell types in colon cancer. (B). The expression of different types of cell markers. (C). Use ssGSEA to calculate the disulfidptosis/anoikis score for each cell and demonstrate it in different types of cells. (D). Cell interaction analysis based on CellChat.
Subtype analysis of ECs
Further subclustering of ECs identified three distinct subtypes: classical tumor ECs (TECs), venous ECs (vECs), and tip cells (Figure 6(A) and (B)). Differentiation status analysis indicated that most ECs in colon cancer were terminally differentiated, with a minor subset classified as unipotent stem cells (Figure 6(C)). Pseudotime trajectory analysis suggested potential differentiation of vECs and tip cells toward classical TECs (Figure 6(D)).
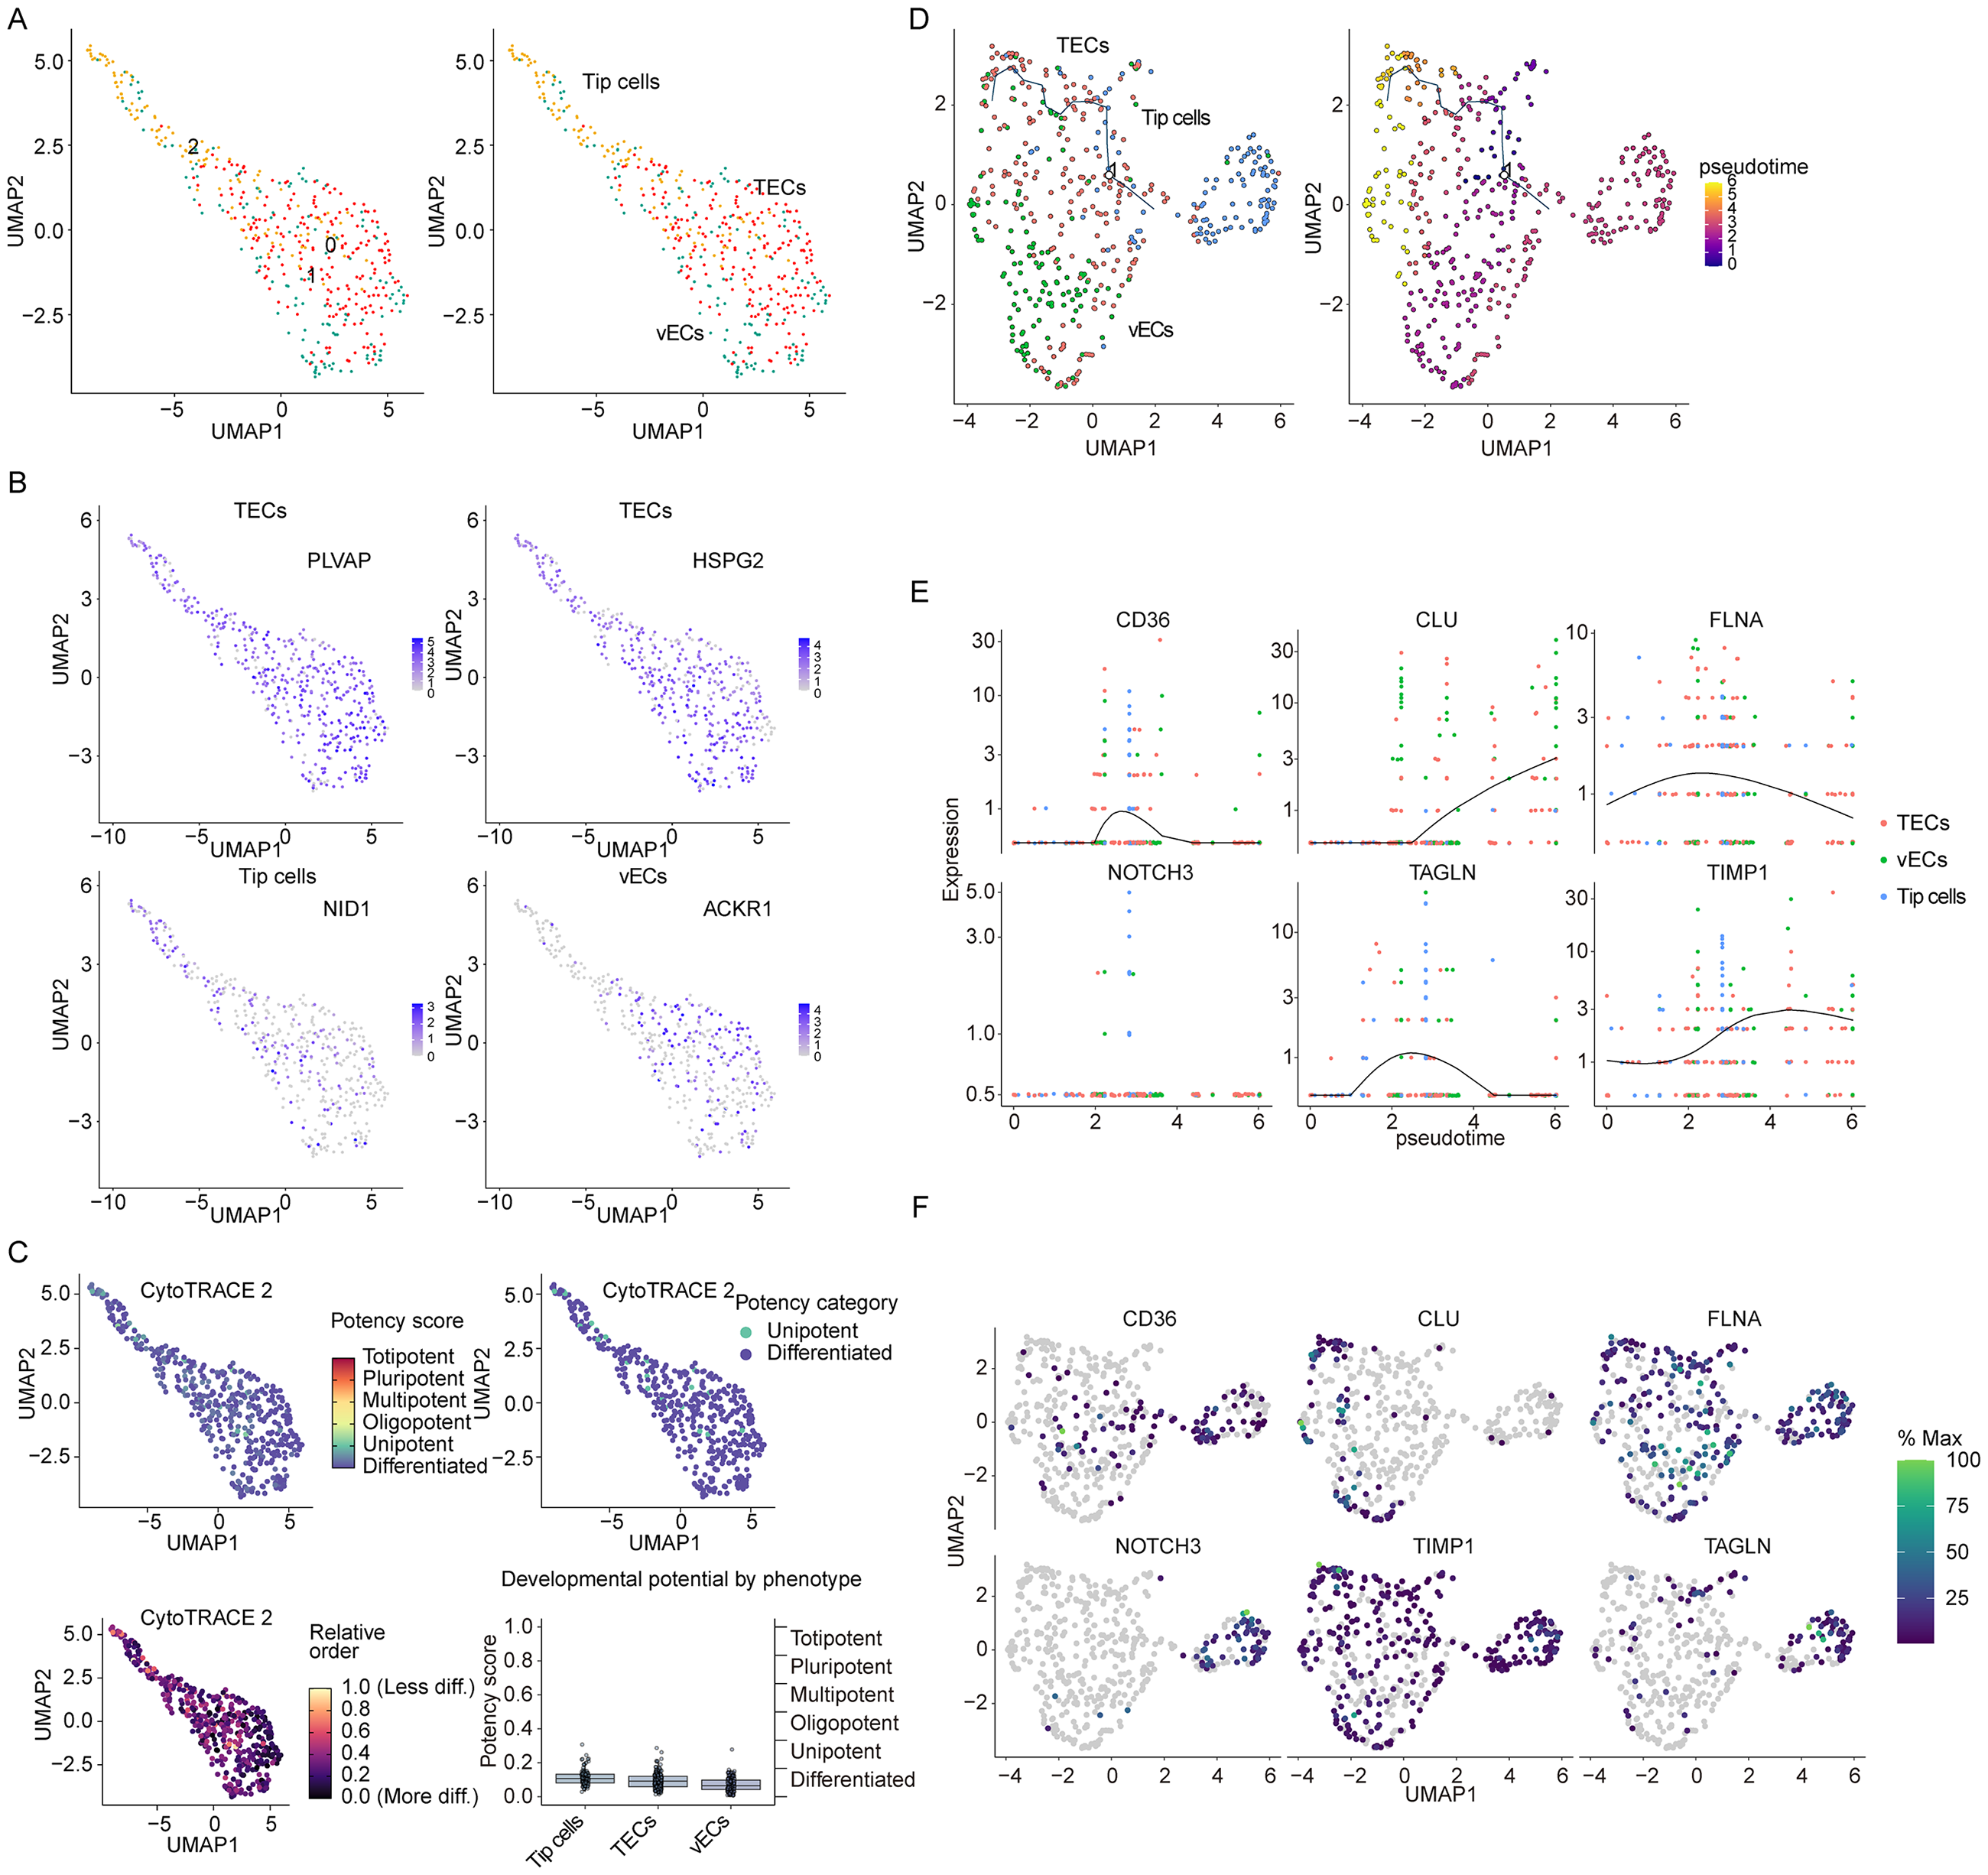
Pseudotime trajectory analysis based on ECs. (A). UMAP analysis identified three types of ECs in colon cancer. (B). The expression of different types of ECs markers. (C). Monocle3 algorithm is used to calculate cell trajectory maps of ECs. (E). The dynamic changes of key genes. (F). The expression of key genes in ECs.
Key regulators in ECs phenotypic transition
Differential gene analysis identified six disulfidptosis/anoikis-related genes—CD36, CLU, FLNA, NOTCH3, TAGLN, and TIMP1—as critical regulators during ECs phenotypic transition (Figure 6(D) and (E)). These genes likely modulate colon cancer progression through disulfidptosis or anoikis pathways in ECs. Subsequent analysis of intercellular distribution revealed that all six PCD-related genes—CD36, CLU, FLNA, NOTCH3, TAGLN, and TIMP1—were expressed in ECs, with significantly higher relative expression levels (Figure 7(A)). Correlation analysis indicated that these six genes were significantly associated with most of PCD patterns in colon cancer (Supplemental Figure S4A and Table S11). Additionally, GSVA was used for pathway analysis of colon cancer, and further correlation analysis showed that these six genes were also significantly associated with several disulfidptosis- or anoikis-related pathway, such as MAPK signaling, cytoskeleton regulation, NF-κB signaling, WNT/β-Catenin signaling (Supplemental Table S12). Prognostic analysis indicated that, except for CD36, the remaining genes exhibited significant negative correlations with colon cancer survival in both the GEO and COAD cohorts (Figure 7(B)). Further investigation into their expression patterns in colon cancer revealed that TIMP1 was markedly upregulated at both mRNA and protein levels (Figure 7(C)–(E)), suggesting its pivotal role as a key PCD-related gene in colon cancer. We also identified the differential expression analysis between low and high TIMP1 patients with colon cancer, and submitted the differential genes for GSEA. The data showed that the function of these genes were enriched in various tumor-related signaling pathways as well as signaling pathways associated with disulfidptosis/anoikis, such as regulation of actin cytoskeleton, citrate cycle, MAKP signaling and TGF-beta signaling (Supplemental Figure S4B and Table S13).

Distribution, prognosis, and expression analysis of key genes. (A). The expression of key genes in different cells. (B). Prognostic analysis of key genes in GEO and COAD cohort (Log-rank test). (C)–(D). Analysis of mRNA (C) and protein (D) expression of key genes (unpaired Student's t test or Mann–Whitney test). (E). Immunohistochemical images of TIMP1 in colon cancer and normal intestinal tissue from HPA database.
Discussion
The primary goal of most cancer therapies is to induce tumor cell death. However, PCD plays an extremely complex role in tumorigenesis and progression.2–5 PCD influences tumor cell biological characteristics, regulates the tumor microenvironment, and modulates the individual's immune response, thereby either promoting or inhibiting tumor development in different contexts.2–5 This study not only systematically delineates the prognostic landscape of PCD patterns in colon cancer, but identifies disulfidptosis and anoikis as pivotal determinants of prognosis in colon cancer patients. Multicohort analysis revealed the significant association between 20 subtypes of PCD and survival in colon cancer, among which disulfidptosis and anoikis were unanimously selected as the most robust prognostic PCD patterns by six machine learning algorithms. Disulfidation is triggered by disulfide stress and relies on SLC7A11 transporter and NADPH metabolism, leading to actin cytoskeleton disruption and cell death under glucose deprivation, which highlights a metabolic vulnerability in cancer.38,39 Anoikis is a key mechanism for maintaining tissue homeostasis, preventing tumor metastasis by inhibiting the survival of abnormal cells detached from the matrix. When cells lose their nest and resist anoikis, they acquire the ability to metastasize, leading to a deterioration of prognosis. Both PCD pathways are pivotal in cancer. Previous studies have shown that GPX4-mediated inhibition of disulfidptosis has been shown to drive colon cancer progression, whereas its induction can prevent postoperative recurrence.38,39 The loss of anoikis is closely related to the metastasis of colon cancer. 40 These mechanisms collectively underpin the prognostic significance of disulfidptosis and anoikis in colon cancer.
To translate these findings into clinical utility, we developed the CCDI—a prognostic signature integrating disulfidptosis/anoikis-related genes. Through combinatorial screening of 117 machine learning workflows, StepCox-RSF hybrids demonstrated superior predictive accuracy, outperforming existing biomarkers in GEO-1 (training set), COAD (internal validation), as well GEO-2 (external validation) cohorts.34–37 The CCDI can function as an independent prognostic factor, like the TNM stage, for developing well-calibrated nomograms and personalized survival prediction models. This indicates the CCDI holds significant potential for clinical application, offering valuable support for treatment decision-making and prognosis assessment in colon cancer patients.
The data of scRNA-seq revealed that disulfidptosis and anoikis scores were significantly enriched in ECs, and ECs exhibited close interactions with other cell types. ECs could promote colon cancer progression through multiple mechanisms, including secreting cytokines to influence tumor cell biological behaviors and promoting tumor angiogenesis, etc.,41,42 indicating the potential role of ECs disulfidptosis or anoikis in colon cancer. Subtype analysis discovered that ECs of colon cancer can be classified into TECs, vECs, and tip cells, with vECs and tip cells showing a tendency to progressively transform into TECs. Moreover, CD36, CLU, FLNA, NOTCH3, TAGLN, and TIMP1 played key roles in ECs subtype transformation. Further analysis found that CLU, FLNA, NOTCH3, TAGLN, and TIMP1 were negatively correlated with patient survival, among which TIMP1 was upregulated at both mRNA and protein levels. TIMP1, a member of the tissue inhibitor of metalloproteinases (MMPs) family, exhibits dual functional characteristics: on one hand, it maintains ECM homeostasis by inhibiting MMPs activity; on the other hand, as a secreted protein, it regulates multiple signaling pathways through receptor binding or modulation of ligand-receptor interactions, influencing tumor development. 43 TIMP1 is involved in regulating multiple PCD processes: enhancing ferroptosis resistance in colon cancer cells via the PI3K/AKT/GPX4 pathway; 44 inhibiting apoptosis in pancreatic cancer cells through the PI3K/AKT/mTOR pathway; 45 promoting resistance to anoikis in tumor stem cells; 46 and participating in disulfidptosis regulation. 47 Additionally, TIMP1 can promote colon cancer by facilitating angiogenesis. 48 These data suggest that TIMP1 may influence colon cancer by regulating disulfidptosis/anoikis to affect ECs functional states. From a clinical perspective, TIMP1 has the potential to emerge as a novel therapeutic target for colon cancer. Therapeutic strategies targeting TIMP1 may improve patient prognosis by modulating the PCD process.
Previous studies have explored the role of multiple PCD patterns in various cancers, including esophageal squamous cell carcinoma, cutaneous melanoma, and head and neck cancer.13–15 However, previous research on PCD in colon cancer has been limited to one or two specific PCD types.38–40 In contrast, our research comprehensively integrates bulk transcriptomics and scRNA-seq data to systematically characterize the prognostic landscape of multiple PCD patterns in colon cancer, highlighting the potential roles of disulfidptosis and anoikis in tumor progression and providing a novel CCDI model with significant prognostic value. Additionally, TIMP1 was identified as a key regulatory gene for ECs in colon cancer. Furthermore, while existing bioinformatic studies on prognostic modeling have primarily targeted colorectal cancer and often conflated colon and rectal cancers,34–37 our study exclusively focuses on colon cancer, offering new insights and potential therapeutic targets for prognosis and treatment.
Several limitations should be noted. First, the preselection of candidate genes prior to model training may introduce feature leakage risk, leading to the optimistic bias of the model performance. Strictly nested cross-validation or prospective validation is needed to confirm the robustness of the CCDI. Second, this study is primarily based on bioinformatics analysis. While it can generate hypotheses, further experimental explorations such as in vitro and in vivo experiments, as well as clinical validation, are required. The regulatory role of TIMP1, a key PCD-related gene in ECs subtypes, on PCD also necessitates more in-depth experimental research for demonstration. Moreover, spatial transcriptomics technology is needed to further resolve the spatial distribution of PCD-related genes within the tumor microenvironment.
Conclusion
This study integrated bulk transcriptome and scRNA-seq to delineate the prognostic landscape of PCD in colon cancer, highlighting the potential role of disulfidptosis and anoikis in tumor progression. It also provided a novel CCDI model with a significant prognostic value, and pointed out TIMP1 as a key ECs regulatory gene in colon cancer. Future work will focus on validating the CCDI model in independent cohorts and exploring TIMP1's clinical application potential.
Supplemental Material
sj-docx-1-sci-10.1177_00368504261432995 - Supplemental material for Machine learning–driven transcriptomic and single-cell profiling of programed cell death patterns in colon cancer
Supplemental material, sj-docx-1-sci-10.1177_00368504261432995 for Machine learning–driven transcriptomic and single-cell profiling of programed cell death patterns in colon cancer by Jian-ou Du, Qing-ke Huang, Xue-cheng Sun, Sun-kuan Hu and Tie-su Lin in Science Progress
Supplemental Material
sj-zip-2-sci-10.1177_00368504261432995 - Supplemental material for Machine learning–driven transcriptomic and single-cell profiling of programed cell death patterns in colon cancer
Supplemental material, sj-zip-2-sci-10.1177_00368504261432995 for Machine learning–driven transcriptomic and single-cell profiling of programed cell death patterns in colon cancer by Jian-ou Du, Qing-ke Huang, Xue-cheng Sun, Sun-kuan Hu and Tie-su Lin in Science Progress
Footnotes
Acknowledgments
Not applicable.
Ethical considerations
Not applicable.
Consent to participate
Not applicable.
Consent for publication
Not applicable.
Author contributions
Jian-ou Du and Tie-su Lin: conceptualization, methodology, software, investigation, formal analysis, and writing—original draft; Qing-ke Huang: data curation; Xue-cheng Sun: visualization; Sun-kuan Hu: writing—review and editing, and funding acquisition.
Funding
The authors disclosed receipt of the following financial support for the research, authorship, and/or publication of this article: This work was supported by the Zhejiang Provincial Medical and Health Science and Technology Project (Grant No. 2025KY989).
Declaration of conflicting interests
The authors declared no potential conflicts of interest with respect to the research, authorship, and/or publication of this article.
Data availability
All data are available from the corresponding author upon reasonable request.
Supplemental material
Supplemental material for this article is available online.
References
Supplementary Material
Please find the following supplemental material available below.
For Open Access articles published under a Creative Commons License, all supplemental material carries the same license as the article it is associated with.
For non-Open Access articles published, all supplemental material carries a non-exclusive license, and permission requests for re-use of supplemental material or any part of supplemental material shall be sent directly to the copyright owner as specified in the copyright notice associated with the article.