
Abstract
Objective
Traditional indicators of obesity, such as body mass index (BMI), fail to precisely capture the independent impact of fat distribution on gallstone disease (GSD). This study aimed to investigate the nonlinear association between body fat ratio (BFR) and the risk of GSD and to identify a critical threshold value.
Method
We conducted a cross-sectional observational analysis of 1952 adults from the 2017–2018 National Health and Nutrition Examination Survey (NHANES). BFR was measured by dual-energy X-ray absorptiometry, and GSD was defined by standardized questionnaire data. Weighted logistic regression, restricted cubic spline (RCS), and threshold effect models were employed to examine the association between BFR and GSD risk, as well as to determine the inflection point.
Results
A significant J-shaped nonlinear association was observed between BFR and GSD risk (P for non-linearity < 0.001). Threshold analysis identified 29.1% (95% CI: 27.5–30.7%) as the critical inflection point, beyond which each 1% increase in BFR was associated with a 14% higher odds of GSD (OR = 1.14, 95% CI: 1.09–1.19). After multivariate adjustment, each additional 1% increase in BFR remained independently associated with a 7% increased risk (OR = 1.07, 95% CI: 1.02–1.13). Compared with participants in the lowest quartile, those in the highest quartile (BFR≥39.2%) exhibited a 2.66-fold higher risk of GSD. Subgroup analyses demonstrated stronger associations in males (OR ≈ 1.12 per 1% BFR increase) and Hispanics (OR ≈ 1.20 per 1% BFR increase).
Conclusions
BFR of ≥29.1% represents a critical threshold beyond which GSD risk significantly increases. These findings suggest an association that warrants further investigation into whether routine monitoring of BFR could serve as a valuable screening tool in high-risk populations, and precise intervention strategies should consider gender and ethnic differences to effectively mitigate metabolic-related gallstone disease.
Keywords
Introduction
Gallstone disease (GSD) is a prevalent digestive system disorder worldwide, closely associated with metabolic disturbances, obesity, and lifestyle factors. 1 Epidemiological data indicate that approximately 7% of the population in China suffers from GSD, with prevalence significantly increasing with age, reaching up to 23% among individuals aged over 80 years.2,3 Traditional studies have commonly employed indicators such as body mass index (BMI) or waist circumference to evaluate the relationship between obesity and GSD; however, BMI fails to distinguish between fat and muscle mass, limiting its ability to precisely reflect the pathological impact of visceral fat accumulation on bile metabolism.4,5 Recent studies have suggested that body fat ratio (BFR), as a quantitative marker of whole-body adiposity, more sensitively reflects adipose tissue metabolic activity and inflammatory status than BMI. However, few population-based studies have directly assessed the association between BFR and GSD or compared its predictive performance with conventional obesity indices, so the incremental value of BFR for GSD risk stratification remains unclear. In particular, the potential nonlinear relationship and data-driven threshold effect between BFR and GSD risk have not been systematically characterized.6,7 Obesity is conventionally defined using body mass index (BMI), with overweight classified as 25.0–29.9 kg/m2 and obesity as BMI ≥30.0 kg/m2 in adults according to widely accepted international and national guidelines. In clinical and epidemiological practice, these BMI-based categories are routinely applied to identify patients with obesity who are at increased risk of cardiometabolic and hepatobiliary diseases, including gallstone disease. 8 However, BMI neither distinguishes fat mass from lean mass nor captures inter-individual differences in fat distribution; individuals with the same BMI may have markedly different proportions of adipose tissue and skeletal muscle, and central adiposity is particularly linked to metabolic dysfunction and gallstone formation. These limitations underscore the need to complement BMI-defined obesity with more direct measures of adiposity, such as body fat ratio, when assessing obesity-related risk of gallstone disease. 9
The pathogenesis of gallstone disease is complex, and obesity contributes to gallstone formation through multiple interrelated mechanisms, including increased hepatic cholesterol synthesis and secretion leading to cholesterol-supersaturated bile, impaired bile acid and phospholipid homeostasis, and reduced gallbladder motility with consequent biliary stasis; these alterations are further aggravated by insulin resistance, dyslipidemia, and low-grade chronic inflammation.10–14 Clinical observations have shown significantly higher risks of GSD among individuals with obesity, females, older adults, and those on high-fat diets. Notably, estrogen exacerbates risk by increasing bile cholesterol saturation and impairing gallbladder contraction.15,16 Furthermore, metabolic syndrome-associated biomarkers, such as C-reactive protein (CRP) and glycated hemoglobin (HbA1c), have been strongly linked to GSD, highlighting chronic inflammation and insulin resistance as key contributors to pathogenesis of GSD.17–19 Nevertheless, previous studies have largely been restricted to linear model analyses, failing to define critical thresholds or clarify the potential nonlinear “inflection point” effects of adiposity on GSD risk, thereby limiting precise clinical screening and intervention targets. 20
Based on these considerations, this study utilized data from the National Health and Nutrition Examination Survey (NHANES, 2017–2018) to systematically investigate the nonlinear relationship and threshold effect between BFR and GSD risk. To the best of our knowledge, no prior study has examined the nonlinear dose–response association between BFR and GSD in a nationally representative adult population or attempted to identify a data-driven BFR threshold related to gallstone risk. Through weighted logistic regression, restricted cubic spline (RCS), and segmented regression models, this study aimed to address the following research questions: (1) Is BFR an independent predictor of GSD risk beyond traditional obesity indicators? (2) Does the association between BFR and GSD exhibit nonlinear threshold characteristics? (3) Does this association remain robust after additional adjustment for metabolic and inflammatory markers that are strongly related to both adiposity and gallstone formation? By clarifying these issues, the present study seeks to provide novel evidence for the role of BFR in obesity-related gallstone disease and to offer a potentially useful BFR threshold that may inform early risk warning and more personalized intervention strategies.
Method
Study design and data sources
This study is a cross-sectional observational study based on a retrospective secondary analysis of publicly available, de-identified data from the 2017–2018 National Health and Nutrition Examination Survey (NHANES), a cross-sectional program conducted by the U.S. National Center for Health Statistics. NHANES employs a stratified, multistage probability sampling design to generate a representative sample of the civilian, non-institutionalized U.S. population. The 2017–2018 NHANES cycle included 9254 participants who completed the household interview. The survey protocol was reviewed and approved by the NCHS Ethics Review Board, and all participants provided written informed consent. This secondary analysis of publicly available, de-identified NHANES data was conducted in accordance with the ethical principles of the Declaration of Helsinki (1975), as revised in 2024. The NHANES protocol was reviewed and approved by the National Center for Health Statistics (NCHS) Research Ethics Review Board (ERB) (Protocol #2011-17, continuation of Protocol #2005-06). All participants in NHANES provided written informed consent in accordance with the ethical principles of the Declaration of Helsinki (1975) and its most recent revision in 2024. Because the NHANES public-use files are fully de-identified, no additional informed consent or institutional review was required for this retrospective secondary analysis.
Inclusion criteria for this analysis were participation in the 2017–2018 NHANES cycle, completion of the household interview and examination components, and availability of data on gallstone disease (GSD) and BFR.
All eligible NHANES 2017–2018 participants were initially considered for this analysis. A stepwise exclusion process was then applied to remove participants with any of the following: Missing gallstone disease (GSD) questionnaire data (no self-report on prior gallstone diagnosis); No measurement of BFR; Incomplete body fat distribution data; A self-reported history of malignancy, cirrhosis, or other serious hepatobiliary disease.
After applying these exclusion criteria, the final analytic sample comprised 1952 participants. Within the 2017–2018 NHANES sample, all individuals who met these predefined eligibility criteria and had complete data on GSD and BFR were included in the analysis, and no additional selective sampling was performed. Among these, 139 individuals self-reported a history of GSD (approximately a 7.1% weighted prevalence in the sample). The participant selection process is illustrated in Figure 1. All analytic data were de-identified prior to analysis, and no individual participant can be identified from the information presented.

NHANES 2017–2018 participant selection flowchart.
Definition and measurement of variables
Outcome variable: Gallstone disease
GSD was the primary outcome of interest. GSD was defined according to participants’ self-report of a prior diagnosis made by a healthcare professional, based on responses to the NHANES questionnaire item MCQ550 (“Has a doctor or other health professional ever told {you/SP} that {you/s/he} had gallstones?”). Data collection was performed through household interviews conducted by professionally trained surveyors to ensure accuracy and consistency.
Exposure variable: BFR
The primary exposure variable was body fat ratio (BFR), defined as the percentage of total body mass composed of adipose tissue. BFR was assessed by dual-energy X-ray absorptiometry (DXA), using a Hologic Discovery A densitometer. Data were obtained from the NHANES DXX_J module. Measurement procedures included: participants fasting for ≥4 h, removal of all metallic objects, and lying supine on the scanning bed. Whole-body DXA scans were performed using a Hologic Discovery A densitometer equipped with Apex software (Version 4.0). Certified radiologic technologists conducted the examinations, and all scan results were reviewed by specialists for accuracy and consistency.
Covariates and potential confounders
To control for confounding, this study considered a comprehensive set of demographic, metabolic, inflammatory, and body-composition variables as covariates. Demographic factors included gender, age (categorized by the median of 39 years), and race/ethnicity. Metabolic and laboratory indicators included white blood cell count (WBC), neutrophil percentage (NEUT%), high-sensitivity C-reactive protein (hs-CRP), fasting glucose (GLU), glycated hemoglobin (HbA1c), total cholesterol (TC), triglycerides (TG), high-density lipoprotein cholesterol (HDL-C), alanine aminotransferase (ALT), aspartate aminotransferase (AST), alkaline phosphatase (ALP), gamma-glutamyl transferase (GGT), lactate dehydrogenase (LDH), bicarbonate (HCO3⁻), creatine kinase (CK), serum osmolality, total bilirubin (TBIL), and uric acid.
In addition, body fat distribution indicators measured by DXA were recorded, including total abdominal fat area, mass, and volume, as well as visceral and subcutaneous adipose tissue area, mass, and volume at the L4–L5 vertebral level. These variables were used in descriptive analyses and variable selection procedures. The final multivariable logistic regression models (Model 2 and Model 3) adjusted for the above demographic and metabolic covariates to estimate the independent association between BFR and GSD. Details of all variables and their coding are provided in Table 1.
Baseline characteristics of study participants.

SE: standard error; t: t-test; χ2: Chi-square test.
BMI: body mass index; total percent fat: BFR; CAP: controlled attenuation parameter; WBC: white blood cell count; NEUT%: neutrophil percentage; hs-CRP: high-sensitivity C-reactive protein; TC: total cholesterol; TG: triglycerides; ALT: alanine aminotransferase; AST: aspartate aminotransferase; HDL-C: high-density lipoprotein cholesterol; HbA1c: hemoglobin A1c; ALP: alkaline phosphatase; HCO3⁻: bicarbonate; CK: creatine kinase; GLU: glucose; GGT: gamma-glutamyl transferase; LDH: lactate dehydrogenase; TBIL: total bilirubin.
Statistical analysis
Based on the complex sampling design of NHANES, survey weights were applied in all descriptive and inferential analyses, and weighted mean ± standard error (SE) was used for continuous variables, and weighted percentages were used for categorical variables. Group differences between participants with and without GSD were evaluated using survey-weighted, unpaired Student's t-tests for continuous variables and survey-weighted chi-square tests for categorical variables. Least absolute shrinkage and selection operator (LASSO) regression (R package “glmnet”) was used to select key variables from 15 obesity-related indicators; optimal lambda (λ) values were determined by 10-fold cross-validation to minimize binomial deviance, and the simplest model was selected using the one-standard-error (1-SE) rule (λ.1se). Survey-weighted logistic regression analyses were conducted in three stages: Model 1 (unadjusted, including only BFR), Model 2 (adjusted for gender, ethnicity, and age), and Model 3 (further adjusted for metabolic indicators). BFR was categorized into quartiles (Q1–Q4), and median values within each quartile were used for trend analyses. Nonlinear associations were evaluated using restricted cubic spline (RCS; R package “rms,” knots at the fifth, 50th, and 95th percentiles) and piecewise linear regression (R package “segmented,” bootstrap method with 1000 replications to estimate inflection points). Missing data were handled using multiple imputation with chained equations (MICE, five imputations), under the assumption that data were missing at random. All statistical tests were two-sided, and P < 0.05 was considered statistically significant. All analyses were performed using R Software Version 4.4.0. This study is reported in accordance with the STROBE guidelines. 21
Results
Baseline characteristics of the study population
This cross-sectional analysis included
Metabolic and Inflammatory Markers: Participants with GSD showed signs of greater systemic inflammation and metabolic disturbance. The GSD group had a higher mean C-reactive protein (CRP) level (4.74 ± 0.58 mg/L) than the non-GSD group (3.31 ± 0.25 mg/L, P = 0.031), indicating elevated inflammation. They also had a slightly higher mean glycated hemoglobin (HbA1c) (5.66% ± 0.07 vs. 5.47% ± 0.03, P = 0.010), suggesting poorer glycemic control even within a mostly nondiabetic range. This pattern is consistent with previous studies linking chronic inflammation and metabolic syndrome markers to gallstone formation. Elevated inflammatory biomarkers (like CRP) have been observed in gallstone patients and are thought to play a role in gallstone pathogenesis.
Gender and Ethnicity: There was a pronounced difference in gender distribution between the groups. Females comprised a significantly larger proportion of the GSD group (76.91%) compared to the non-GSD group (48.66%, χ2 = 38.70, P < 0.001). This reflects the well-established higher prevalence of gallstone disease in women. In contrast, race/ethnicity did not show a significant association with gallstone prevalence in this sample (χ2 = 2.96, P = 0.481). The rates of GSD were similar across racial groups, indicating no statistically meaningful difference by race within the study population (Table 1).
LASSO regression for key variable selection
To identify key predictive variables associated with GSD, we applied Least Absolute Shrinkage and Selection Operator (LASSO) regression using data from NHANES 2017–2018, screening from among 15 obesity-related indicators. The results demonstrated that BFR and total abdominal fat area were selected as the primary predictive variables for GSD, with their regression coefficients consistently remaining positive across varying values of the regularization parameter (λ) (Figure 2(A)). Notably, when body mass index (BMI) and other anthropometric indices were entered into the same LASSO model, their coefficients were shrunk towards zero, whereas BFR and total abdominal fat area remained in the final model, indicating that these variables carried the most stable predictive information for GSD. The optimal λ value was determined by minimizing binomial deviance using 10-fold cross-validation (Figure 2(B)). Receiver Operating Characteristic (ROC) curve analysis revealed that both BFR and total abdominal fat area had an area under the curve (AUC) of 0.7 (Figure 2(C)); however, the regression coefficient for BFR was notably higher (0.0119 vs. 0.001) (Table 2). These findings indicate that BFR has greater predictive efficacy for GSD risk than BMI and total abdominal fat area among the obesity-related indicators examined.

Diagnostic performance analysis based on LASSO regression. A. Variable coefficient paths under different log(λ) values; B. Binomial deviance curves across log(λ) values (optimal λ determined by minimal deviance); C. Comparison of ROC curves between BFR and total abdominal fat area (AUC = 0.7).
Key predictive variables for gallstone disease identified by LASSO regression (lambda.1se) and their regression coefficients.

Association between BFR and gallstone disease risk
To evaluate the independent relationship between BFR and GSD risk, we constructed multilevel logistic regression models (unadjusted, partially adjusted, and fully adjusted). Results indicated a significant positive association between continuous BFR and GSD risk. In the unadjusted model, each 1% increase in BFR was associated with an 11% higher risk of GSD (OR = 1.11, 95% CI: 1.06–1.16, P < 0.001). After adjustment for gender, race, and age (Model 2), this association remained significant, with a 9% higher risk per 1% increase in BFR (OR = 1.09, 95% CI: 1.04–1.14, P = 0.002). Further adjusting for metabolic and inflammatory markers (Model 3), each 1% increment in BFR still independently increased the risk by 7% (OR = 1.07, 95% CI: 1.02–1.13, P = 0.015).
Quartile analyses based on BFR revealed that individuals in the highest quartile (BFR ≥39.2%) had a 5.48-fold higher risk compared to the lowest quartile group in the unadjusted model (OR = 5.48, 95% CI: 2.03–14.74, P = 0.004). This risk decreased to 2.66-fold in the fully adjusted Model 3 (OR = 2.66, 95% CI: 0.85–8.36, P = 0.114), although this did not reach statistical significance. Trend tests showed a significant dose-response relationship between BFR and GSD risk (P for trend<0.05). These findings suggest that BFR is an independent risk factor for GSD, with its effect significantly enhanced at levels ≥39.2%, and metabolic disturbances may partially mediate this association (Table 3).
Multivariable logistic regression analysis of the association between BFR and gallstone disease risk.
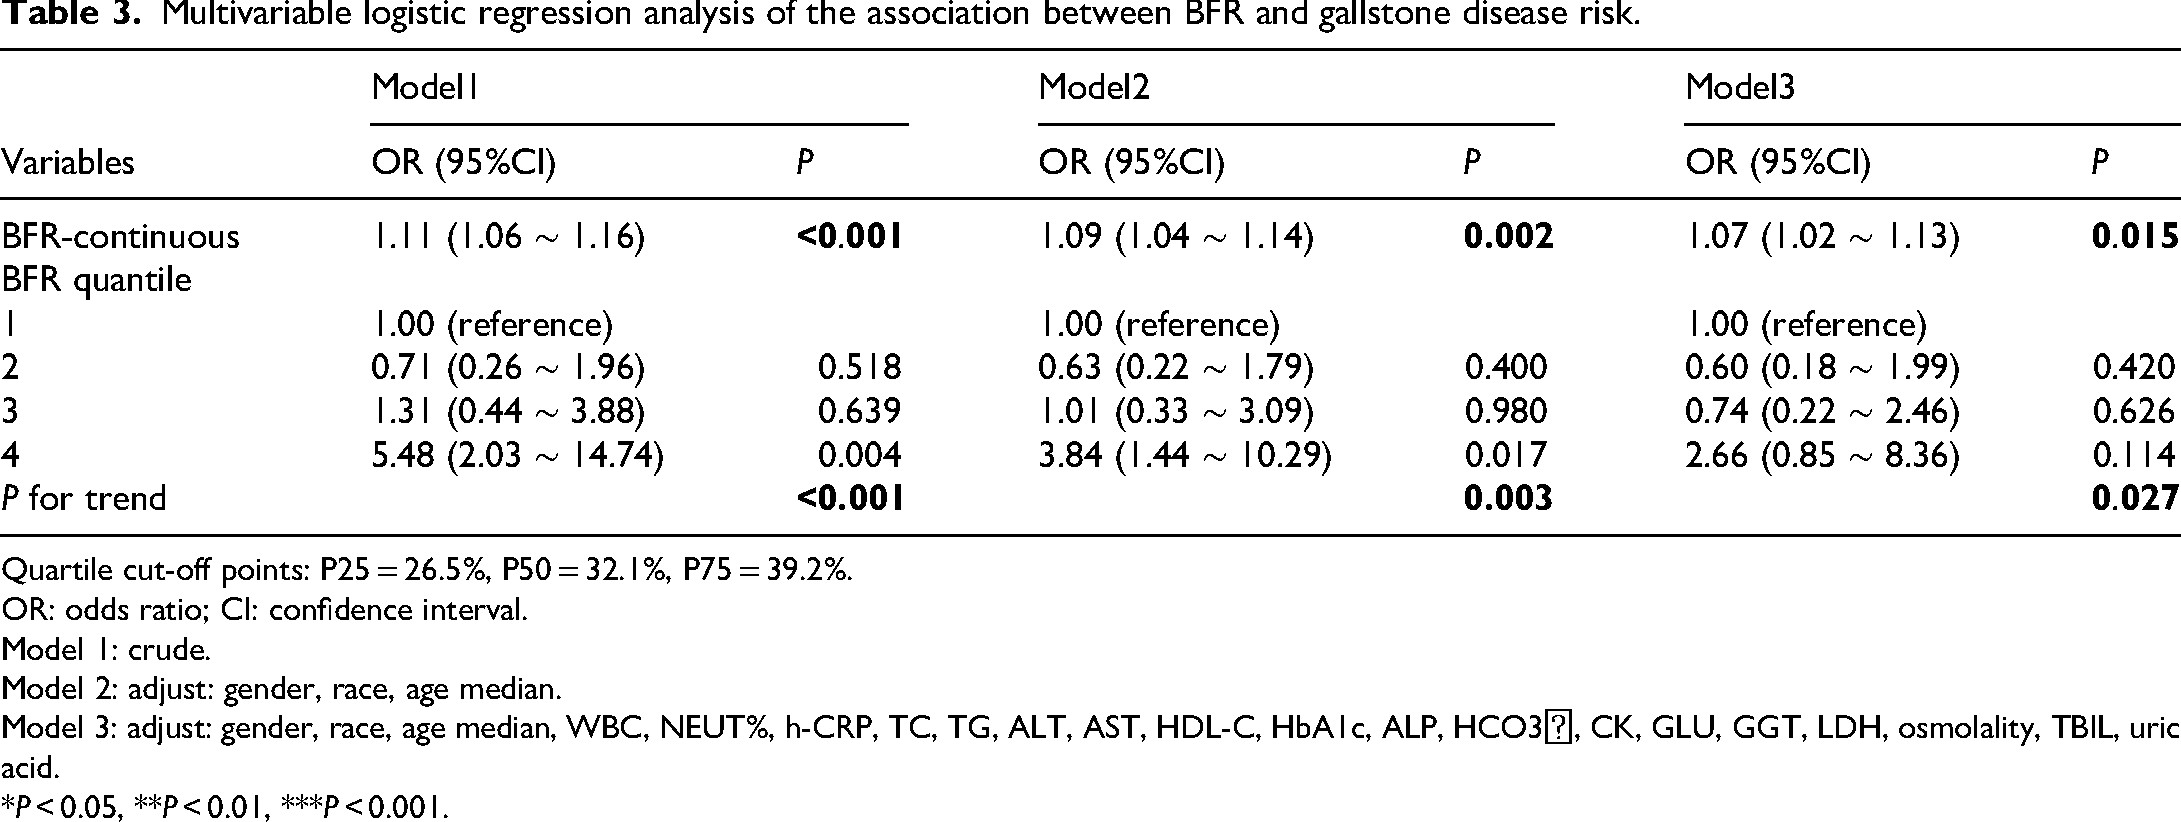
Quartile cut-off points: P25 = 26.5%, P50 = 32.1%, P75 = 39.2%.
OR: odds ratio; CI: confidence interval.
Model 1: crude.
Model 2: adjust: gender, race, age median.
Model 3: adjust: gender, race, age median, WBC, NEUT%, h-CRP, TC, TG, ALT, AST, HDL-C, HbA1c, ALP, HCO3⁻, CK, GLU, GGT, LDH, osmolality, TBIL, uric acid.
*P < 0.05, **P < 0.01, ***P < 0.001.
Nonlinear association and threshold effect
To investigate the potential nonlinear association between BFR and GSD risk, we employed restricted cubic spline (RCS) and segmented regression models, adjusting for gender, race, and age (Model 2). The RCS analysis revealed a significant J-shaped nonlinear relationship between BFR and GSD risk (P for nonlinearity <0.001; Figure 3(A)), indicating that GSD risk increased nonlinearly as BFR increased. Threshold effect analysis further identified an inflection point at 29.1% (95% CI: 27.5–30.7%), suggesting a significantly elevated risk when BFR reached or exceeded this threshold. Specifically, there was no significant association between BFR and GSD risk when BFR was below 29.1% (OR = 0.99, 95% CI: 0.86–1.14, P = 0.887); however, above the threshold of 29.1%, each 1% increase in BFR was associated with a 14% higher GSD risk (OR = 1.14, 95% CI: 1.09–1.19, P < 0.001) (Figure 3(B)). A likelihood ratio test indicated no significant difference in model fit between the segmented and linear models (P = 0.113).

Relationship between BFR and gallstone disease risk with threshold effect. A. Restricted cubic spline (RCS) analysis illustrating a J-shaped association between BFR and GSD risk. The grey shaded area represents the 95% confidence interval, and the red dashed line indicates the inflection point at BFR = 29.1%. B. Piecewise regression analysis demonstrating a significantly increased risk when BFR ≥29.1% (OR = 1.14 per 1% increment, P < 0.001) (Table 4).
Piecewise linear regression analysis of BFR and gallstone disease risk.

Subgroup analysis and interaction effects
To explore potential heterogeneity in the association between BFR and GSD across different populations, we conducted subgroup analyses and interaction tests. The results suggested some variation in this association by gender, race, and age, although formal interaction tests did not show statistically significant effect modification by these factors.
In the gender-specific analysis, the association between BFR and GSD was significant among females (OR = 1.12, 95% CI: 1.08–1.17, P < 0.001), but no significant association was observed among males (OR = 1.02, 95% CI: 0.90–1.14, P = 0.795). However, the interaction between gender and the BFR-GSD association did not reach statistical significance (P for interaction = 0.118).
Regarding racial differences, Mexican Americans exhibited the highest risk of GSD associated with increased BFR (OR = 1.20, 95% CI: 1.09–1.31, P = 0.003). Additionally, non-Hispanic Blacks (OR = 1.15, 95% CI: 1.07–1.23, P = 0.002) and non-Hispanic Whites (OR = 1.11, 95% CI: 1.03–1.20, P = 0.019) also demonstrated elevated risk. The risk among other racial groups ranged from OR = 1.05 to 1.09, with P values between 0.020 and 0.231. Nevertheless, interaction tests indicated that the differences across racial groups were not statistically significant (P for interaction = 0.457).
In the age-stratified analysis, the association was slightly weaker among individuals aged ≥39 years compared to those younger than 39 (OR = 1.10 vs. OR = 1.11, respectively), although both groups exhibited significant associations (P = 0.003 and P = 0.017, respectively). However, the interaction between age and the BFR-GSD association was not significant (P for interaction = 0.830) (Table 5).
Subgroup analysis of the association between BFR and gallstone disease risk.
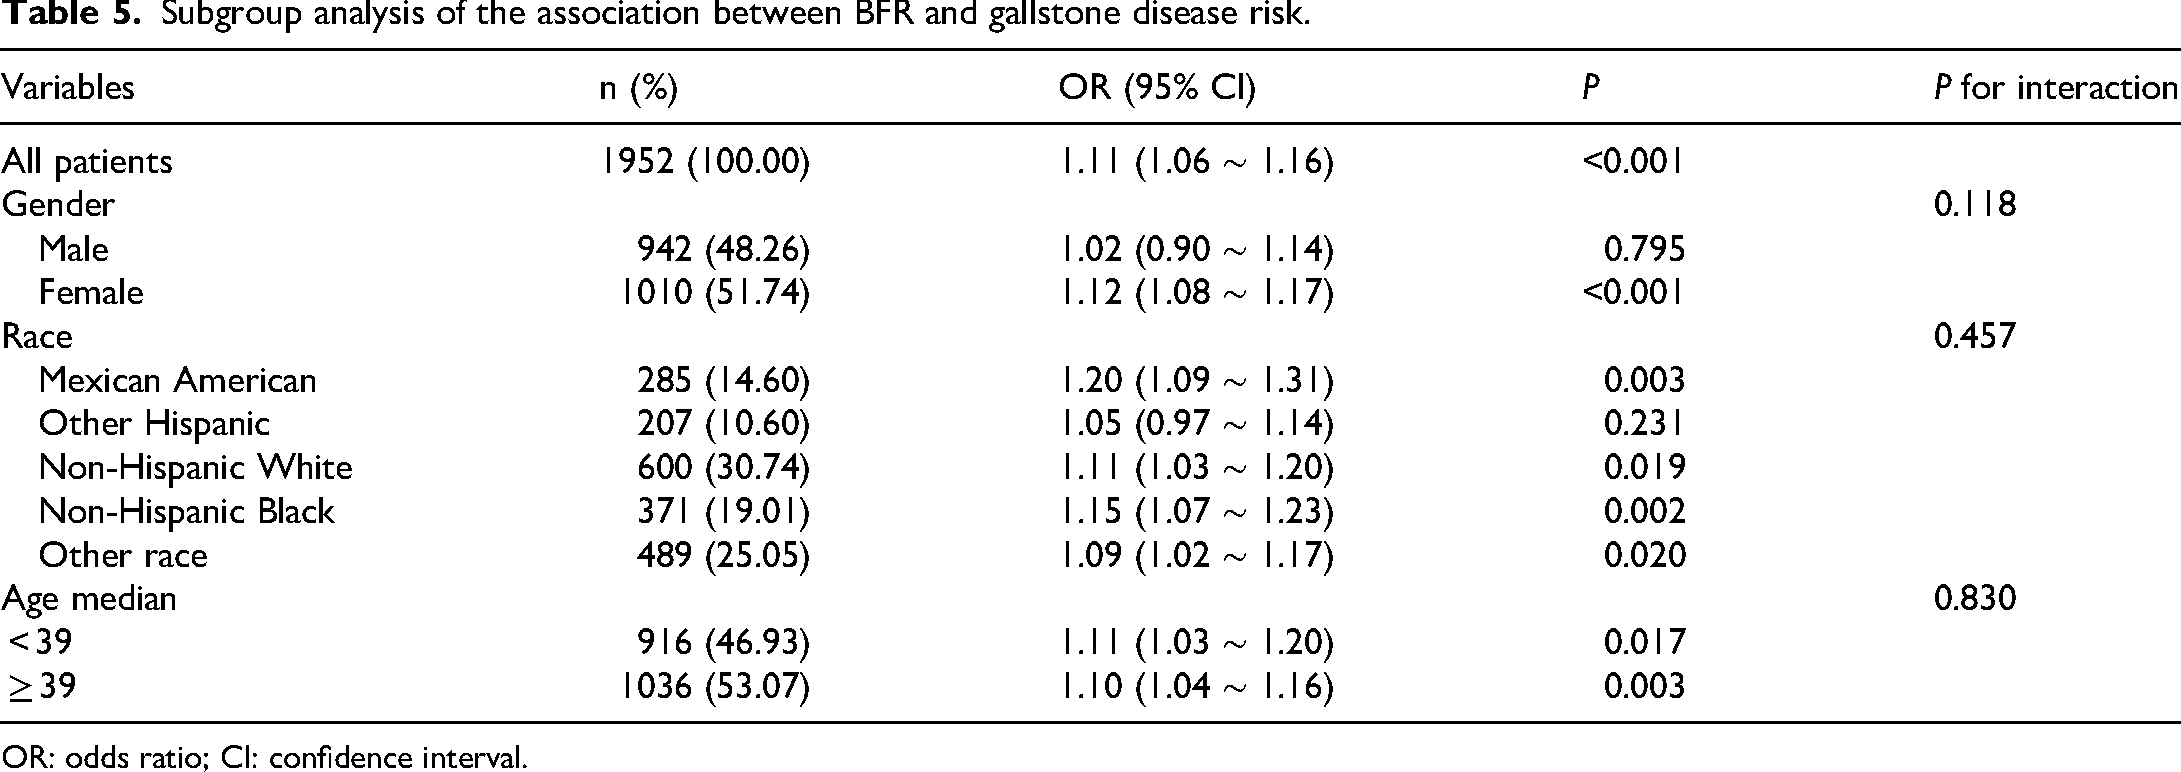
OR: odds ratio; CI: confidence interval.
Discussion
This cross-sectional analysis of NHANES 2017–2018 data identified a nonlinear relationship between BFR and gallstone disease (GSD) risk, with a critical threshold at BFR = 29.1%. Above this threshold, GSD risk increases sharply; every 1% increment in BFR beyond 29.1% is associated with a 14% higher odds of GSD (OR = 1.14). These findings underscore that once adiposity accumulates past a tipping point, metabolic disturbances accelerate gallstone formation. Importantly, to the best of our knowledge, this is the first study to characterize a data-driven BFR threshold for GSD risk and to demonstrate a clear nonlinear dose–response pattern between BFR and GSD in a nationally representative adult population. The magnitude of this association is broadly comparable to the excess GSD risk previously reported for BMI-defined obesity in large observational studies, but our analysis refines this relationship by identifying a quantitative BFR threshold rather than relying solely on BMI categories. Notably, within our LASSO and multivariable logistic models, BFR emerged as a stronger predictor of GSD than BMI, emphasizing the importance of total fat burden over traditional obesity measures.
The concept of a “critical adiposity accumulation” threshold is supported by our data. Below 29.1% BFR, GSD risk remained relatively flat; however, once this threshold is surpassed, metabolic homeostasis may become disrupted, leading to rapid risk escalation. In our piecewise regression, BFR <29.1% was not significantly associated with GSD, whereas above this threshold each 1% increase in BFR was related to a 14% higher odds of GSD, supporting a biologically plausible tipping point rather than a simple linear dose–response. This observation aligns with classical theories of gallstone pathogenesis, in which excess adiposity contributes to bile cholesterol supersaturation and gallbladder stasis, thereby setting the stage for stone formation.22–24 Additionally, we observed that participants with higher BFR exhibited elevated levels of C-reactive protein (CRP) and glycated hemoglobin (HbA1c). Consistent with previous reports linking low-grade inflammation and impaired glucose metabolism to gallstone formation, these markers suggest that chronic inflammation and insulin resistance may mediate the link between BFR and GSD. 25 In our fully adjusted model, additional control for CRP, HbA1c, and other metabolic markers attenuated the BFR–GSD association (from an 11% to a 7% increase in odds per 1% BFR),implying that systemic inflammation and metabolic dysregulation partially explain how increased body fat leads to gallstones. 26 By integrating nonlinear modeling with extensive adjustment for metabolic and inflammatory biomarkers, our analysis extends prior work that primarily evaluated BMI or waist circumference in linear frameworks and helps to quantify how much of the BFR–GSD association may be linked to downstream metabolic disturbance.
Our analysis, including LASSO regression, confirmed that although both body fat ratio (BFR) and body mass index (BMI) were significantly associated with GSD in univariable models, BFR demonstrated a stronger and more stable predictive value than BMI and total abdominal fat area when all obesity-related indicators were entered simultaneously and provided additional information for gallstone risk stratification. Unlike BMI, which cannot differentiate fat mass from lean mass, BFR provides a direct measure of adipose tissue burden, making it a more precise tool for risk stratification regarding metabolic complications. In the LASSO procedure, the coefficients of BMI and other anthropometric indices were shrunk towards zero, whereas BFR and total abdominal fat area remained in the final model, and BFR showed a larger regression coefficient than total abdominal fat area (0.012 vs. 0.001), indicating that BFR carried the most robust signal for GSD risk among the adiposity measures considered. For instance, individuals with high BFR, even if their BMI does not indicate obesity, may still be at elevated risk for GSD. 27 This finding is consistent with emerging research that links total body adiposity more strongly to metabolic dysfunction than body size alone, and it suggests that routine assessment of BFR could enhance GSD risk identification beyond the information provided by BMI or waist circumference. 28 Taken together, these results highlight the incremental predictive value of BFR over traditional anthropometric indices and support its potential role as a complementary marker in obesity-related gallstone risk assessment.
Subgroup analyses revealed notable differences by gender and ethnicity. In gender-stratified analyses, the positive association between body fat ratio and gallstone disease appeared more pronounced in females (OR ≈ 1.12 per 1% increase in body fat ratio) than in males (OR ≈ 1.02), although the formal test for interaction was not statistically significant. This pattern is consistent with the higher burden of gallstone disease described in women in epidemiological studies29and may reflect the combined effects of a higher average body fat percentage, differences in fat distribution, and the influence of sex hormones (e.g. estrogen) on bile composition and gallbladder motility. 30 For ethnicity, Hispanic individuals, particularly those of Mexican American heritage, exhibited the strongest association between body fat ratio and gallstone disease (OR ≈ 1.20 per 1% increase), whereas other racial/ethnic groups also showed positive but slightly weaker associations30. Although the interaction across racial/ethnic groups was not statistically significant, these trends may be related to a combination of genetic susceptibility—for example, variants in genes involved in cholesterol transport and bile acid metabolism—as well as population-specific lifestyle and dietary patterns. 31 Taken together, these exploratory subgroup findings suggest that the impact of excess adiposity on gallstone disease risk may vary across gender and ethnic strata and highlight the potential value of designing prevention strategies that are sensitive to gender- and ethnicity-related differences, while acknowledging that these results require confirmation in larger, prospective studies.
From a clinical perspective, our study supports the use of BFR as a practical screening marker for identifying individuals at high risk for gallstones. In our nationally representative NHANES sample, individuals with BFR ≥29.1% had approximately two- to three-fold higher odds of gallstone disease compared with those in the lowest BFR quartile, and this effect size is broadly comparable to the excess risk that previous observational studies have reported for obesity defined by body mass index. In practice, this entails incorporating BFR measurements (e.g. via bioelectrical impedance or DEXA scans) into routine health assessments, particularly for patients exhibiting features of metabolic syndrome. Individuals with BFR ≥29.1% may benefit from early lifestyle interventions, such as modifications in diet, exercise, and weight management, or from closer monitoring for GSD symptoms. Even if their BMI is not exceedingly high, a high BFR signals an elevated metabolic risk. Furthermore, combining BFR with metabolic biomarkers like HbA1c (to assess glycemic control) and CRP (to evaluate inflammation) could enhance risk stratification; for instance, a patient with BFR above 29% and elevated HbA1c might be prioritized for ultrasound screening or counseled more aggressively on weight reduction.32,33 In our analysis, the area under the ROC curve for BFR alone was approximately 0.70, indicating moderate discriminatory ability that is similar to many single clinical risk factors; therefore, BFR is best viewed as one component of a multifactorial risk assessment rather than a stand-alone diagnostic tool. Future studies are needed to determine whether integrating BFR with additional risk markers—such as metabolic biomarkers, susceptibility genes, or gut microbiome characteristics—can yield more accurate, multidimensional prediction models for gallstone disease.34,35
To build on these findings, several avenues for future research are suggested. First, prospective cohort studies should follow individuals with different levels of body fat ratio to clarify the temporal relationship between higher body fat ratio and incident gallstones, and to examine whether reductions in body fat ratio below the ∼29.1% threshold identified in this study are associated with lower subsequent gallstone risk. Second, mechanistic studies are needed to elucidate how increased body fat ratio—particularly above this threshold—affects bile composition, gallbladder motility and cholesterol crystallization, for example through adipose tissue–derived factors (e.g. free fatty acids, adipokines), chronic low-grade inflammation and insulin resistance. Third, personalized intervention trials could test targeted lifestyle or pharmacologic strategies in individuals with body fat ratio ≥29.1%, and in higher-risk subgroups suggested by our analysis (such as women and Hispanic participants), to determine whether modifying adiposity or metabolic status may attenuate gallstone risk. Finally, multi-omics approaches integrating body fat ratio with genomic, metabolomic and gut microbiome profiling may help to refine the risk stratification models suggested by our data and to generate more precise, biologically grounded hypotheses for gallstone disease prevention.
Several limitations of this study should be acknowledged. First, as this investigation is based on cross-sectional NHANES data, causal inference is inherently limited; while we observed an association between higher body fat ratio and gallstone disease, causality cannot be definitively established, and reverse or bidirectional relationships cannot be excluded. Second, some subgroup analyses, particularly for specific ethnic groups such as Hispanic participants, involved relatively small numbers of gallstone cases, so these estimates are statistically less stable and should be interpreted with caution and validated in larger, targeted cohorts. Third, although adjustment for inflammatory and glycemic markers (e.g. hs-CRP and HbA1c) attenuated the association between body fat ratio and gallstone disease, the cross-sectional nature of the data precludes formal mediation analysis; longitudinal studies are required to clarify whether changes in these biomarkers truly mediate the relationship between reductions in adiposity and lower gallstone risk. In addition, body fat ratio in NHANES was estimated using multi-frequency bioelectrical impedance analysis, which, although validated, is less precise than imaging techniques such as dual-energy X-ray absorptiometry or computed tomography—particularly for quantifying visceral fat—so non-differential measurement error may have led to misclassification that biased some associations toward the null. Finally, the threshold of 29.1% was derived from a U.S. adult population in the 2017–2018 survey cycle and may differ in other populations, settings, or age groups; moreover, our analysis focused on overall adiposity and did not separately model visceral versus subcutaneous fat, which may have distinct relationships with gallstone disease.
Despite these limitations, the study provides valuable insight by pinpointing a potential adiposity threshold for gallstone risk and highlighting the importance of body fat percentage as a metric. In particular, by leveraging nationally representative data, directly measured body fat percentage, and advanced nonlinear modeling, our findings add novel evidence that BFR is not only associated with GSD but also exhibits a clinically relevant risk threshold that may refine future strategies for screening and prevention.
Conclusion
In summary, this cross-sectional study suggests that BFR may be an independent predictor of gallstone disease risk and may provide additional information beyond body mass index. We observed a possible threshold around 29.1% body fat, above which the probability of gallstone disease appeared to increase more steeply. These findings indicate a potential nonlinear association between excess adiposity and gallstone risk and may help to refine risk stratification for obesity-related gallstone disease. If confirmed in prospective and mechanistic studies, BFR-based thresholds might help to inform earlier and more targeted preventive strategies in individuals at higher risk.
Footnotes
Abbreviations
Acknowledgements
We sincerely thank the participants and investigators of the NHANES datasets for making their data publicly available for research purposes. Additionally, we extend our gratitude to Xiantao Academic for their valuable support and contributions to this study.
Ethics approval and consent to participate
The NHANES protocol was reviewed and approved by the National Center for Health Statistics (NCHS) Research Ethics Review Board (ERB) (Protocol #2011–17, Continuation of Protocol #2005–06).
This study was conducted in accordance with the ethical principles of the Declaration of Helsinki (1975) and its most recent revision in 2024.
All participants in NHANES provided written informed consent at the time of the original survey. This study is a retrospective secondary analysis of publicly available, de-identified NHANES data. In accordance with the policy of the Ethics Committee of The First Affiliated Hospital of Wannan Medical College (Wuhu, China), such analyses are exempt from additional institutional review; therefore, no further IRB approval was required for this study.
Author contributions
HYZ: conceptualization, data curation, formal analysis, investigation, methodology, software, validation, visualization, writing – original draft, and writing – review and editing. NZY: data curation, investigation, methodology, and writing – review and editing. GL: data curation, formal analysis, software, and writing – review and editing. YXF: methodology, validation, and writing – review and editing. XPC: project administration, resources, supervision, and writing – review and editing. JZ: conceptualization, funding acquisition, methodology, resources, supervision, validation, writing – original draft, and writing – review and editing.
Funding
The authors disclosed receipt of the following financial support for the research, authorship, and/or publication of this article: This work was supported by the 2023 Anhui Provincial Health and Wellness Research Project, Anhui Province Clinical Medicine Research and Transformation Program, 2024 Key Research Project Fund (Natural Sciences Category), and 2024 University-Enterprise Integrated Development “Qilu Research Fund” Project (grant number AHWJ2023Bba20065, 202427b10020034, WK2024ZZD28, XQQL202408).
Declaration of conflicting interests
The authors declared no potential conflicts of interest with respect to the research, authorship, and/or publication of this article.