
Abstract
Economic agglomeration plays an important role in China's social transformation process of industry feeding agriculture and urban supporting rural areas, and is one of the core weapons to promote agricultural economic growth and green and efficient development. Based on panel data of 41 cities in the Yangtze River Delta (YRD) from 2010 to 2020, this paper constructs an “environment-resource-energy-economy” agricultural input-output system, taking into account carbon emissions and surface pollution, and provides a more comprehensive accounting of agricultural green total factor productivity (AGTFP), the non-linear effects of economic agglomeration on AGTFP and shock responses were empirically analyzed using a panel threshold model and a panel vector autoregression (VAR), respectively. The findings show that: (1) during the period 2010–2020, the AGTFP in the YRD showed an overall rising trend with regional spatial agglomeration characteristics. (2) Economic agglomeration has a triple threshold effect on AGTFP, which was a weak facilitative effect in the early stage, inhibited by the siphoning effect of resource loss and arable land fragmentation in the growth stage, promoted by the radiation effect of external increasing return to scale in the form of sharing, matching and learning in the maturity stage, and finally tends to decline. (3) The shock response of economic agglomeration to AGTFP showed a continuous positive shock, peaking in the first period and then gradually converging to zero. (4) The heterogeneity analysis demonstrated that economic agglomeration has a considerable impact on boosting AGTFP in non-metropolitan areas and cities on the outskirts of YRD. In the future, China should effectively play a positive role in economic agglomeration on AGTFP and enhance the mutual coordination of economic agglomeration and agricultural green development in the process of urban cluster economic growth.
Keywords
Introduction
One of the major concerns for agricultural economic growth has been the topic of green development in agriculture. 1 Since the Green Revolution (GR), global agricultural yields and per capita food have grown substantially, especially in developing countries, where food production has achieved extraordinary growth, hunger and malnutrition have been effectively alleviated. However, its limitations have gradually been exposed: the high level of fertilizer and pesticide application brought about by GR has seriously damaged the ecological environment.2,3 In the 40 years since reform and opening up, China's rural and agricultural economies have witnessed profound transformations, with the primary sector's real value-added expanding at an average annual rate of 4.3% from 1978 to 2020. The percentage of employed employees in the primary sector declined from 70.5% in 1978 to 23.6% in 2020, as agriculture labor productivity and agricultural automation rates both increased rapidly. 4 This signifies that Chinese agriculture's overall factor productivity has increased significantly. However, this shift was the result of China's long-term reliance on factor drive, which has been compounded by resource, energy, and environmental limits, putting pressure on long-term agricultural development. As a result, the environment was extensively contaminated, and significant greenhouse gas emissions were produced.5,6 Total Factor Productivity (TFP) has always been the core indicator of agricultural economic development, although it only considers labor and capital, and is less involved in agricultural pollution or greenhouse gas emissions. However, the use of contemporary agricultural production materials such as pesticides, agricultural films, fertilizers, and agricultural gear is rising, as is the total amount of agricultural carbon emissions, which makes the current Chinese agriculture show high carbon. Ignoring the environmental costs of agricultural production will inevitably distort the status quo of agricultural green development, exaggerate the performance of agricultural green development, and propose policies and measures that mislead agricultural green development. Therefore, it is necessary to incorporate environmental resource constraints into the analysis framework, fully consider undesired outputs, and achieve a scientific and systematic analysis of agricultural green total factor productivity (AGTFP), which can better grasp the development status of green agriculture in China and improve the level of agricultural greening in a more targeted manner.
As early as the early twentieth century, scholars have recognized that economic agglomeration can reduce costs, increase wages, and play an important role in increasing labor productivity. 7 As China gradually enters the new normal of economy, the industrial form has changed from agriculture-supporting industry to industry-supporting agriculture; from rural areas serving cities to urban driving rural areas. Meanwhile, the relationship between industry and agriculture, city and rural is undergoing an unprecedented historical transformation. Economic development is also shifting from a crude model of pursuing growth rate to a connotative model of pursuing structural adjustment and environmental efficiency, with economic agglomeration undoubtedly becoming one of the themes in China's green transformation and development. 8 With the acceleration of urban-rural integration in China, economic agglomeration can produce an agglomeration effect through the redistribution of economic factors and affect the transformation of the agricultural development mode. Accordingly, studies have shown that food production is closely related to economic development. 9 Countries have more capital ability to enhance fiscal spending on agriculture to sustain food production as a result of fast economic development. 10
As a testing ground for ecological green integration in China, the problems of green agricultural development in the Yangtze River Delta (YRD) cannot be ignored. Because of its better geographical advantages, metropolitan clusters such as Beijing-Tianjin-Hebei, Yangtze River Delta, and Pearl River Delta have quickly concentrated their economic activity in the last three decades. As economic agglomeration accelerates, population agglomeration and industrial agglomeration promote each other, and land conversion from farmland to urban areas becomes increasingly intensive,11,12 resulting in a significant reduction in the number of available cultivated land, particularly in the YRD. Rapid urbanization has taken up a lot of fertile farmlands, among which the supply of cultivated land in Shanghai, eastern Zhejiang, and southern Jiangsu is currently unable to meet demand. 13 During 2005–2015, the rate of farmland loss in 16 cities in the YRD reached 69.02 hm2 during the 20-year period, of which 87.1% was caused by urban sprawl. 14 Economic agglomeration also brings about a decline in the quality of cultivated land. More than half of China's cultivated land is thought to have been degraded in some way as a result of excessive chemical agricultural inputs such as fertilizers and pesticides. Similarly, the growth in production scale brought about by economic agglomeration is sure to result in greater energy consumption and carbon emissions, posing a serious challenge to the future sustainability of Chinese agriculture.15,16 Therefore, it is of great significance to fully understand the relationship between economic agglomeration and agricultural green development, and to systematically analyze the influence of economic agglomeration on AGTFP. However, there are still several questions that need to be addressed: What kind of impact does economic agglomeration play on AGTFP? Is there a non-linear relationship between them? What are the paths and mechanisms of the influence? The answers to the above questions not only provide rich empirical evidence for urban economic agglomeration supporting green agricultural development in China in the new era, but also provide experiences for green and efficient agricultural development in other developing countries.
The marginal contributions of this paper are as follows: (1) Focusing on the agricultural sector. Most of the existing literature on the effects of economic agglomeration on green total factor productivity (GTFP) mostly focuses on cities, and rarely on agriculture. Besides, it differs from previous research that solely focuses on agricultural carbon emissions in a narrow sense in terms of agricultural material inputs, agricultural energy, and so on. By accounting for surface source pollution from fertilizer inputs during agricultural cultivation, this paper achieves a thorough characterization of AGTFP. (2) To better identify the interaction between Chinese industry and agriculture, urban and rural areas. This paper breaks through the previous perspectives of industrial agglomeration and urbanization, and innovatively explores the nonlinear effects of economic agglomeration on AGTFP from the perspective of economic agglomeration at the overall city level and based on the accounting of AGTFP. In addition, considering the development process of economic agglomeration with its resulting lagged effects, this paper captures the impact of economic agglomeration on AGTFP in terms of threshold effects and impulse responses. (3) This paper also compares the heterogeneous effect of economic agglomeration on AGTFP in two dimensions, namely, center-periphery, and metropolitan-nonmetropolitan.
Literature review
According to the conventional economic theory of agglomeration, compact economic activities can produce various agglomeration and spillover effects, which are conducive to improving the efficiency of factor use under the impact of positive externalities. 17 Related studies also showed that the positive effects of economic agglomeration outweigh the negative effects. Zeng and Zhao, 18 Dean et al. 19 stated that economic agglomeration can alleviate pollution through externalities such as knowledge spillover effects and economies of scale. Zhou et al. 20 also came to the same conclusion with 339 cities in China, that is, under the background of economic agglomeration, the increase of economic activity can significantly enhance resource and energy usage efficiency, which is beneficial to curb water pollution, and this effect was more obvious in small-sized and medium-sized cities. Based on an ecological footprint model, Jin et al. 21 discovered a positive correlation between economic agglomeration and eco-efficiency, and the improvement of the level of economic agglomeration can promote local resource utilization efficiency. Wang et al. 22 conducted an empirical analysis from the perspective of spatial effects and found that economic agglomeration can affect labor productivity and thus had a considerable spatial spillover effect on haze pollution. In general, when economic agglomeration was at a mature level, it can play a self-purifying function, promoting pollution control.
However, some scholars also advocated the negative externalities of economic agglomeration. While economic agglomeration might improve technical efficiency, it also produces additional resource consumption and demand, resulting in a rebound effect in which resource savings from improved technical efficiency were countered by increasing carbon emissions from economic expansion. 23 Furthermore, the extension of urbanization as a result of economic agglomeration will influence agricultural infrastructure in surrounding rural regions, increase agricultural costs and the degree of fragmentation of cultivated land, and adversely affect agricultural productivity. 24
The effect of economic agglomeration on environmental pollution depends on the combined effect of the above positive and negative effects, and therefore some empirical studies have found the relationship between the two to be uncertain or non-linear. For example, Wang et al. 22 based on panel data from 74 cities in China's Yellow River Basin, inferred an N-type relationship between economic agglomeration and haze pollution. Glaeser and Kahn 25 hold that increasing urban economic density was conducive to reducing carbon emissions, with a non-linear relationship between the two indicators. Shao et al. 8 based on 22 years of panel data for 30 provinces in China and concluded that there is an inverted N curve relationship between economic agglomeration and carbon emission intensity and per capita carbon emission and that once the economic agglomeration level reaches a certain threshold, it can show significant energy-saving and emission reduction effects.
Based on the above literature review, it could be found that the existing literature on the effects of economic agglomeration on environmental pollution and resource utilization is rich, and the research mechanism is relatively mature, but there are still two limitations. On the one hand, previous literature about the effects of economic agglomeration on GTFP is less focused on agriculture. However, the process of urban-rural integration has accelerated since October 2003, when China explicitly proposed to integrate urban and rural development. The economic development of cities has also had a profound impact on local agriculture, and various economic, social, and environmental problems in the agricultural industry have occurred frequently, and the effect of economic agglomeration on green agricultural development deserves more attention. On the other hand, previous research mostly focused on the one-way linear relationship between economic agglomeration and green agricultural development, but the reality is often more complex, with differences in the impact of different stages of economic development on agriculture.
Accordingly, three marginal contributions of this paper are proposed, firstly, focusing on the agricultural sector; secondly, downscaling analysis. Using the YRD city cluster as a research scale to investigate the dynamic relationship between economic agglomeration and AGTFP, unlike the traditional sample of provincial economic regions, urban agglomerations are themselves a mapping of economic agglomeration in spatial organization. Thus, the findings of this paper are more pertinent to the sustainable development of regionally integrated agriculture. Thirdly, the life-cycle of economic agglomeration is introduced into the theoretical analytical framework and paired with a panel threshold model for empirical testing, building on the life-cycle theory of industrial agglomeration. This conclusion serves as a guide for policymakers working on high-quality agricultural development.
This paper is structured as follows: Literature review analyzes relevant studies on economic agglomeration and AGTFP. Theoretical analysis and research hypothesis introduce the life cycle theory of economic agglomeration and present the corresponding hypotheses. Methods and materials explain the measurement method of AGTFP and the setting of the empirical model. Results analyze the spatial and temporal distribution characteristics of AGTFP and also provide empirical results. Discussion provides conclusions, significant findings, study implications, and limitations.
Theoretical analysis and hypothesis
Previous research shows that the impact of economic agglomeration on resource efficiency and pollution has both promoting and inhibiting features. Similarly, the Williamson hypothesis states that when economic agglomeration exceeds a particular threshold value, it causes agglomeration diseconomies, resulting in a loss of economic efficiency, and the two have an inverted U-shaped connection. In order to account for both environmental and economic benefits, AGTFP is used as an indicator to evaluate China's agricultural green development. Therefore, the first hypothesis is formulated: Hypothesis 1: Economic agglomeration has an impact on AGTFP, and the two have a non-linear relationship.
Is the relationship between economic agglomeration and AGTFP just an inverted U shape? Does it have different effects with different developmental periods? Tichy, an Austrian economist, researched the dynamics of industrial agglomeration through time and created the industrial agglomeration life cycle theory. 26 Industrial agglomeration is one of the most visible forms of economic agglomeration, with varied life cycles corresponding to different stages of economic growth. Based on the life cycle theory of industrial agglomeration, economic agglomeration development is divided into four stages: infancy, growth, maturity, and decline. The level of externality manifested by the agglomeration effect varies in different stages of economic development,27,28 implying that the influence of economic agglomeration on AGTFP varies over time. Figure 1 depicts the theoretical analytical framework.

Mechanisms of economic agglomeration on AGTFP.
As shown in Figure 1, economic agglomeration can increase AGTFP during the infancy stage, although the effect is minor. As economic agglomeration grows, it may result in the formation of several economic uplands, resulting in more employment opportunities for farmers with higher income levels, which can benefit local farmers through trickle-down mechanisms, 29 cash and technology assistance are provided for agricultural production and the use of ecologically friendly technology. In reality, economic agglomeration in the true sense of the word has not yet been formed, and it is only at the stage of merging like items of some capital and industries in the region, and the organizational model is still in a disorderly state, and the benefits of agglomeration have not yet been fully realized. Despite the trickle-down effect that can influence farmers, it is unclear if it will have a substantial impact on the improvement of AGTFP.
In the growth stage, economic agglomeration plays a significant inhibiting role on AGTFP. The degree of economic agglomeration is expanding, the factor attraction of the urban center agglomeration region is increasing, and rapid production capacity growth will result in a dramatic increase in energy consumption. At this time, the siphon effect circle continued to expand, as production factors flow from periphery areas to central cities, and agriculture and rural regions are under tremendous pressure from the loss of resource factors, which are manifested in three levels: (1) Human capital level. Young and middle-aged rural labor force are migrating to cities, rural productivity is inadequate, and the elderly left behind in rural areas are unable to master modern production equipment and professional production technology; (2) Financial Capital Level. Currently, the level of financial product development in China's financial system for rural areas and agriculture lags behind the development of rural agriculture, resulting in financial institutions failing to meet the policy of benefiting farmers and instead allowing rural capital to be transferred to towns and big cities, causing a lack of financial resources needed in rural areas; (3) Technology and capital level. The results of scientific and technological progress in agriculture have limited economic benefits, and are more of public and social nature. Further, from an analysis of the investment return ratio, agricultural projects and agricultural technology equipment are characterized by long investment cycles and low returns, which are not conducive to the entry of social resources, and inherently have the risk of resource loss.
In the maturity stage, economic agglomeration plays a significant role in promoting AGTFP. Specifically, economic agglomeration provides for a radiation effect on rural regions to boost AGTFP through the following three mechanisms. Firstly, sharing mechanism. The improvement of infrastructure in agglomeration areas brought about by economic agglomeration enables urban and rural areas to effectively share inseparable services or facilities, share external risks, share specialization and diversification, and make farmers’ lives more convenient. With the sharing mechanism, the economic agglomeration in the maturity stage can promote the development of the local economy and maximize the trickle-down effect to benefit farmers, which has a significant impact on agricultural income growth. 30 In addition, whether or not farmers obtain more income in an environment of economic agglomeration, they still benefit from a lower consumer price index and hence higher real wages owing to the price index effect. Secondly, the matching mechanism. Matching agricultural goods and markets minimize transaction costs, and allows for knowledge and technology exchange and innovation, thereby increasing labor productivity, which is critical for AGTFP. Thirdly, learning mechanism. The knowledge spillover effect from economic agglomeration is self-evident. The diffusion and creation of knowledge and technology promote the improvement of the cultural quality of agricultural producers so that they have the ability to reduce pollution emissions during agricultural production through the more rational use of chemical factors and more organic fertilizers and other environmentally friendly behaviors. Furthermore, owing to the rational use of elements, agricultural producers with high educational levels will also obtain considerably high output efficiency and profitability. Under the dual action, AGTFP is significantly improved.
In the decline stage, economic agglomeration weakens AGTFP. When economic agglomeration reaches a certain level, resources will be scarce, rising factor prices, and intense competition for agglomeration, resulting in the crowding effect, also known as the density restriction, which states that additional labor and capital inputs on a given land would bring about a higher density of factor inputs per unit of land. Increasing crowding reduces the productivity of capital and labor, leading to diminishing marginal output. Based on this, this paper puts forward the second hypothesis: Hypothesis 2a: In the infancy stage, economic agglomeration has a catalytic effect on AGTFP in the form of a trickle-down effect, but the effect is weak.
Hypothesis 2b: In the growth stage, economic agglomeration has a negative impact on AGTFP, mainly through the siphoning effect to suppress AGTFP.
Hypothesis 2c: In the maturity stage, economic agglomeration has a positive impact on AGTFP, mainly through the radiation effect to promote AGTFP.
Hypothesis 2d: In the decline stage, economic agglomeration has a suppressive effect on AGTFP, manifested as a crowding effect.
Study area
YRD is located in the heart of mainland China's eastern shore, with a regional area of 356,700km2. It is one of China's most dynamic, open, and inventive economic zones, as well as a model location for ecological and green integrated development. Besides, YRD is also a significant agricultural zone. In 2020, YRD generated a total value added in agriculture of roughly 999.397-billion-yuan, accounting for more than 12% of the national agricultural economy, and played an essential role in the country's agricultural economic development. The rapid growth of YRD's agricultural economy is also accompanied by a high dependence on agrochemicals, showing serious surface source pollution problems and an urgent need for green transformation in agricultural development. The study area includes three provinces and one municipality in YRD, with 13 prefecture-level cities in Jiangsu, 11 prefecture-level cities in Zhejiang, 16 prefecture-level cities in Anhui, and 1 municipality directly under the Central Government in Shanghai. Therefore, there are 41 basic units in the study area. Figure 2.

Location of the study area in the YRD.
Methods and materials
Measurement of green total factor productivity of China's agriculture
AGTFP is the inclusion of resource and environmental factors in the measurement of agricultural productivity, which is used to examine the effectiveness of agricultural green development, and this paper mainly adopts the SBM-GML method. The traditional TFP measurement methods mainly include Stochastic Frontier Analysis (SFA) and Data Envelopment Analysis (DEA), and SFA is limited in application because it requires pre-defined production functions and technical inefficiency term distribution forms. DEA overcomes these drawbacks, but considering the non-angular, non-radial characteristics of traditional DEA models, Tone 31 proposed a standard efficiency model for SBM. The SBM standard efficiency model cannot rank two or more active cells when they exist in the same period. For this reason, Tone 32 further proposed the super-efficient SBM model, however, this model also fails to take into account undesired outputs. Ultimately, referencing Tone 33 a super-efficient SBM model capable of incorporating undesired output was chosen. In addition, in order to reflect the inter-annual variation of AGTFP, the most widely used methods are the Malmquist-Luenberger (ML) index. However, ML indexes are often not circular and often suffer from problems such as linear programming insolvability. Oh 34 further proposed the Global Malmquist-Luenberger (GML) index. Nowadays the combination of the super-efficient SBM model and the GML index has been widely used as an estimation method to measure GTFP. Liu and Xin35 measured GTFP in major provinces along the Belt and Road and found an overall upward trend, but with significant regional differences. Wang et al. 36 considered three types of non-desired outputs, wastewater, waste gas and solid waste, and found that GTFP in the Central Plains urban agglomeration of China exhibited a fluctuating upward trend, but productivity levels remained low.
Super-SBM model
The inputs of agricultural production components yield desired outputs such as food and economic advantages in the agricultural production process. Excessive use of agrochemicals, on the other hand, might result in undesirable outputs such as agricultural pollution emissions. This paper chooses the Super-SBM model to measure AGTFP to thoroughly and truly portray the agricultural production process.33,37 The model can take undesirable outputs and slack into account as well as fully consider the environmental benefits.
38
The model assumes that YRD has n cities and that each city serves as a decision unit on the production frontier. m inputs are used by each decision unit,


Global malmquist-luenberger Index
The Super-SBM model can only measure the annual AGTFP level of YRD cities, and cannot reflect the dynamic changes between this year and the previous year, or this year and the next year. The GML index will be used in this paper. Referring to Oh
34
the GML index is defined as:

Model setting
Baseline regression model
This paper focuses on the effect of economic agglomeration on AGTFP. Considering the possible non-linear relationship between economic agglomeration and AGTFP, the squared term of economic agglomeration is added to the regression model, and the empirical model is as follows:

Panel threshold regression model
The preceding theoretical research reveals that, depending on the agglomeration effect, the influence of economic agglomeration on AGTFP differs over the four stages. That is, at distinct threshold intervals, there are fundamental abrupt shifts in the influence of economic agglomeration on AGTFP, and there may be more than one such threshold effect. This paper uses a multiple threshold model based on panel data to measure the nonlinear relationship between economic agglomeration and AGTFP.
39
The model is set up as follows:

Panel vector autoregressive model
To better understand the dynamic relationship between economic agglomeration and AGTFP, this paper employs a panel vector autoregressive (VAR) model that incorporates lags, endogenous variables, and individual heterogeneity while maintaining the benefits of time-series characteristics, as represented by the model as:

Variable selection
Dependent variable
Agricultural green total factor productivity (AGTFP) is the dependent variable, and it is measured with the super-SBM model and GML index. The inputs and outputs indicators are shown in Table 1.
Input-output indicators of AGTFP.

N:P:C = Phosphate fertilizer: Nitrogen fertilizer: Compound fertilizer.
Labor, land, mechanical power, fertilizer, pesticide, and film were used as input indicators. In contrast to previous literature, draft animals were not taken into account. There are two reasons. On the one hand, China's mechanization has been continuously improved since the twenty-first century, and animal husbandry as a driving force has become increasingly rare; on the other hand, most yearbooks no longer include statistical indicators for draft animals, considering the availability of data, draft animals are not included in the input indicators.
Agricultural value added is selected as the desirable output indicator. In the current study, gross output and added value of agriculture are most widely used as the desirable outputs. However, the gross output value is often affected by intermediate consumption and does not reflect the real output. Therefore, it is more reasonable to use agricultural value added to represent the desirable output.
Agricultural carbon emissions and fertilizer pollution a were chosen as undesirable output variables. Agricultural non-point source pollution has several origins, and their definitions are quite different. Generally speaking, agricultural non-point source pollution mainly refers to chemical pollution caused by chemical fertilizer, livestock and poultry breeding, solid waste, and rural life are all examples of. To begin with, there is worldwide agreement on nitrogen and phosphorus contamination caused by chemical fertilizer use. Secondly, while livestock and poultry breeding pollution are mainly related to manure, livestock and poultry manure has long been utilized as a fertilizer, and the pollution is still open to question. Straw is the most common type of solid waste, in China, the government has strictly regulated the burning of straw in the fields, and by 2020, China has reached a complete utilization rate of over 90% of straw; hence, straw should not be included in undesirable outputs. Finally, although human emissions account for the majority of rural home pollution, agriculture is not the only source of pollution.
Therefore, this paper primarily uses fertilizer-related surface source pollution as a measurement index of agricultural non-point source pollution, that is, the total nitrogen, total phosphorus, and ammonia nitrogen pollution caused by chemical fertilizer application.
Core independent Variable
Economic agglomeration (AGG), as measured by economic density, 30 is the core independent variable in this paper, and it has a high level of recognition. The reason for this is that economic agglomeration mainly refers to the density of economic activities in a unit space, which is the process and phenomena of concentration of diverse economic activities in an area. Its common measurement indicators include the spatial Gini coefficient, the Herfindahl index, but these indicators ignore the differences of small geographical units, whereas output density, namely the amount of economic activity carried per unit area, is considered a good indicator of economic agglomeration in a region. 45 It has been widely used.8,20
Control variables
The following variables were selected to control for unobservable factors to more accurately estimate the influence of economic agglomeration on AGTFP. (1) The digital inclusive finance index (DIF) is a measurement of the digital financial level (DIF). 46 The popularity and growth of digital inclusive finance in rural regions is a general trend in China's digital countryside, and some research has demonstrated that digital inclusive finance has a heterogeneous impact on agro-ecological efficiency. 47 (2) Economic level (PGDP), as measured by GDP per capita. For the purpose of controlling differences in regional economic development levels. (3) Level of urbanization, expressed as a share of the non-farm population in the total population. Increased urbanization brings losses of agricultural land and makes agricultural activities more difficult. The pressure on farmers is multiplied. 48 (4) Industry structure, expressed as food sown area/total crop sown area. 49 (5) Industrialization level (IND), expressed in terms of regional industrial value-added and the resident population at the end of the year. 49 The notion of industry nurturing agriculture is a policy concept with Chinese features, as well as the stage of agricultural growth that China is going through. (6) Income gap (GAP), expressed as the ratio of urban per capita disposable income to rural per capita disposable income. Agricultural carbon emissions are influenced by the optimization of urban-rural income distribution patterns. 50 (7) Environmental controls (ER). Learning from the study of Chen et al., the frequency of 15 keywords related to green development and agricultural non-point source pollution that occurs in the year's local government work report is calculated. 51 Statistics description of variables is shown in Table 2.
Statistical description of variables.

Date sources
From 2010 to 2020, panel data was collected for 41 prefecture-level cities in the YRD. The data came from the China Urban Statistical Yearbook, China Urban and Rural Construction Statistical Yearbook, China Agricultural Yearbook, and yearly statistical yearbooks of Chinese prefecture-level cities. For missing values in the data source, this paper uses interpolation to fill in. In all subsequent models, except for AGTFP, the data of the rest variables are processed with a natural logarithm. The data processing and statistical analysis software used in this paper were MaxDEA6.7, Stata16.0, and ArcMap10.8.
Results
Temporal and spatial characteristics of the AGTFP
Considering that the AGTFP measured above was a chain index, it mainly represented the change of AGTFP of the current year compared with the previous year. As a result, the index is turned into a fixed-base index in Figure 3 to show AGTFP's cumulative trend, which is convenient for analyzing its geographical and temporal variation characteristics. That is, taking the AGTFP of 2010 as the base period and making it equal to 1. The actual value of the AGTFP for 2011 is the product of the AGTFP for the current year and the AGTFP for 2010, and the estimated value of AGTFP in other years was deduced by analogy. As demonstrated in Figure 2, the AGTFP showed an upward trend year by year from 2011 to 2020. In terms of the time period, in the early period (2011–2013), the improvement of AGTFP showed a form of diffusion from the center to the surrounding area, in the mid-to-late period (2014–2020), the trend of AGTFP growth showed a concentration from northern and southern cities to central cities. Regionally, there were significant differences and spatial agglomeration characteristics of AGTFP among cities. Specifically, Shanghai, is the city with the lowest AGTFP average value (1.09) and Wuxi (3.01), with a difference of 3 times. Wuxi actively developed high-quality, high-efficiency and green agriculture, focusing on agricultural science and technology means driven. Since 2010, Wuxi has made biological and intelligent agriculture a new growth point for the city's modern agricultural development. As of 2020, the application of Wuxi's chemical fertilizer and pesticide has been maintaining zero growth compared to 2015, and the straw utilization rate was stable at over 95%. From these indicators, Wuxi's AGTFP level was in the leading position in China. However, Shanghai's urban agriculture model has produced the typical phenomenon of the Inverse Thunen Circle, that is, Shanghai's suburban cities were prone to the excessive pursuit of short-term land transfer added-value benefits, resulting in extensive land management or low utilization, which resulted in a significant increase in agricultural carbon emissions and non-point surface pollution, leading to a low level of AGTFP development.

AGTFP of the YRD from 2011 to 2020.
Baseline regression results
A fixed effects model was used to estimate the model parameters. As shown in model (1) of Table 3, the coefficients of the primary and quadratic terms of economic agglomeration were significant at the 1% and 5% levels, respectively, and were positive and negative in turn, showing an inverted U-shaped curve. Combined with the characteristics of economic agglomeration, a possible explanation was that the economies of scale, and spillover effects from economic agglomeration can promote AGTFP. According to Marshall's concept of externalities, spatial agglomeration was a result of the snowball effect, as the level of economic agglomeration rises, more and more labor and industry converge on urban centers to share the benefits of economic diversification and specialization. Furthermore, the lag of rural modernization has prompted a large number of peasants to leave their land and their hometowns to flock to cities disorderly, making the phenomenon of empty nests in rural areas increasingly serious; the number of idle village houses and contracted land abandoned continued to rise; the phenomenon of urban-rural polarization has intensified, and the Matthew effect appeared, namely the weak getting weaker and the strong getting stronger. On the one hand, farmers’ agricultural labor productivity was declining, while on the other side, farmers were opting for the easy way out by increasing fertilizer inputs to equal historical yields. Under the combined action of various factors, it made sense that the AGTFP would decline. However, the actual situation was often more complicated, given that the relationship between economic agglomeration and AGTFP is not a simple inverted U-shaped relationship, there may be multiple thresholds, so a further threshold is required.
Benchmark regression and robustness checks.
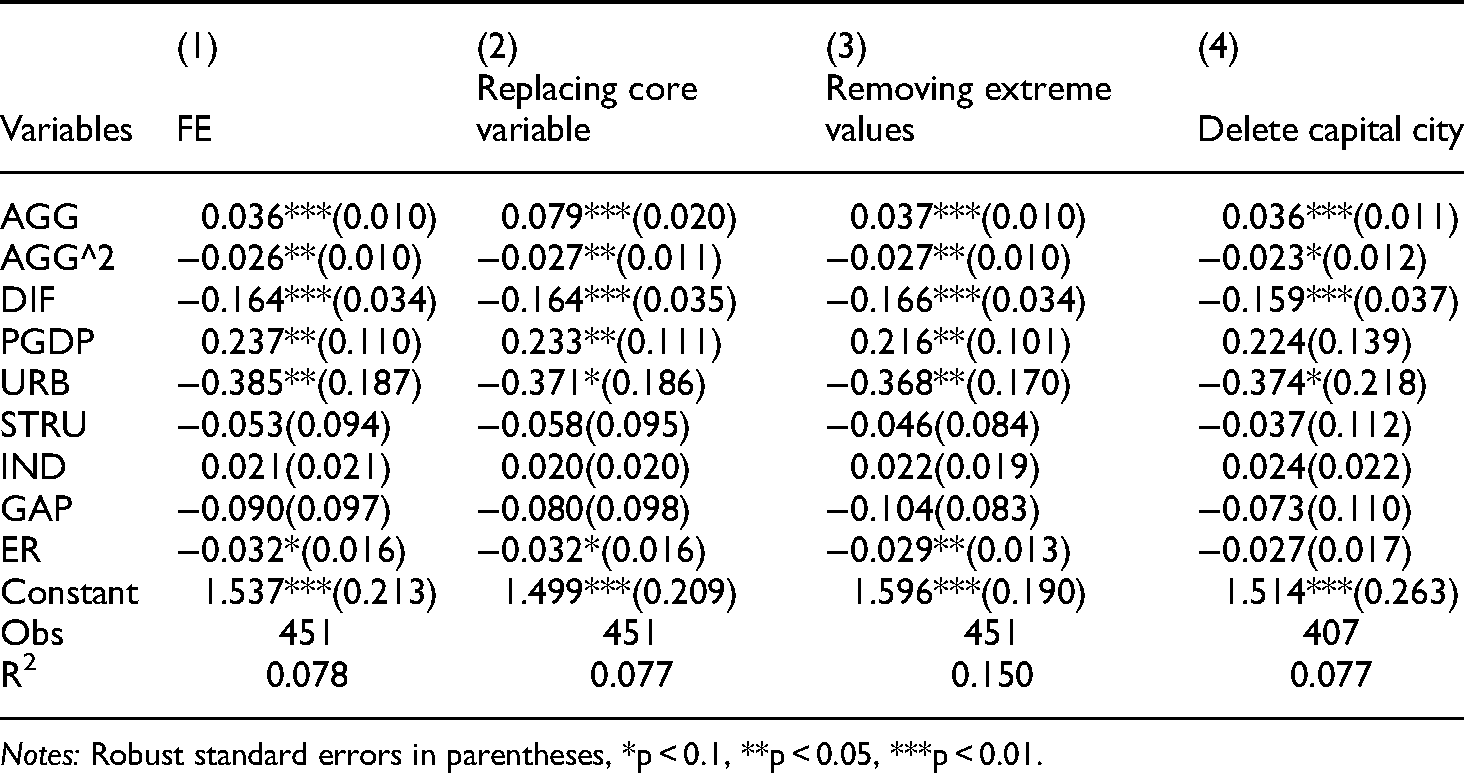
Notes: Robust standard errors in parentheses, *p < 0.1, **p < 0.05, ***p < 0.01.
In terms of control variables, digital inclusion finance was significantly negative at the 1% level, indicating that the dividends of digital inclusion financial development were mainly reflected in the cities and remained negative for agricultural production. The level of economic development was significantly positive at the 5% level, showing that the higher the level of regional economic development, the stronger the public awareness of environmental protection, while the greater the government's financial support for agricultural development was conducive to AGTFP. Urbanization was significantly negative at the 5% level. In terms of economic trends, urbanization has more advantages than disadvantages, as small towns can create new jobs and divert some of the surplus farmers. Then, through farmland renovation and farmer training, conditions were created for future large-scale industrialization of agriculture and professionalization of farmers. However, nature was different in a country like China, which has a long-standing dualistic economic structure. China's economic progress has been built on the sacrifices of generations. Although a few people became wealthy, the bulk did not. If we merely chase the appearance of riches through town construction, the peasants will lose even their most basic land. Environmental regulation was significantly negative at 10%, indicating that for weak agriculture, too strong environmental regulation can instead inhibit AGTFP.
Robustness test
Models (2)-(4) in Table 3 provided the three methods of robustness testing: replacing core independent variables, removing extreme values, and removing provincial capitals or municipalities. Economic agglomeration indicators were recalculated using the locational entropy approach and introduced as core independent variables in the benchmark regression model. In addition, the baseline regression results were re-estimated by removing the 1% extreme values. Due to the unique political and locational conditions of provincial capital cities (municipalities directly under the central government), economic agglomeration has an inherent advantage, which may also affect the empirical results. Therefore, cities such as Shanghai, Hangzhou, Nanjing, and Hefei were excluded from the total sample. Under all three methods, the primary and quadratic terms of economic agglomeration remain significant, and the coefficients were in the same direction. As a consequence, the findings of this paper were robust.
Threshold effect of economic agglomeration on AGTFP
The non-linear relationship between economic agglomeration and AGTFP has been confirmed above. To further investigate whether there were multiple thresholds, this paper used economic agglomeration as a threshold-dependent variable, and minimized the sum of squares to determine the threshold of economic agglomeration, and then assumed that a single threshold was known to search for other thresholds. Because the threshold value cannot be identified under the original threshold effect assumption, that is, the F statistic was non-normal distribution, this paper adopted the Bootstrap method, sets the number of 500 self-sampling to obtain the asymptotic distribution of F values, and then constructed the corresponding P values. As shown in Table 4, economic agglomeration passed only the single threshold test The possible reason was that the impact of economic agglomeration on AGTFP had a path-dependent characteristic in time, that is, time effect, and there was a bidirectional causal relationship between them. In this regard, the one-period lag of the economic agglomeration variable was introduced as the core independent variable in the panel threshold model, which also alleviated the model endogeneity problem and ensured the robustness of the empirical results. The findings revealed that the p-values of AGGt−1 of single threshold, double threshold, and triple threshold were significant at the 5%, 10%, and 5% levels, respectively. Hence the threshold number was set to three, then specific thresholds were determined, and the maximum likelihood function was used to estimate the triple threshold values of economic agglomeration.
Results of the threshold effect.

Notes: F denotes the F statistic; BS denotes the number of Bootstrap.
As shown in Table 5, the estimation results of the AGTFP triple threshold model of economic agglomeration with one lag period showed that its four threshold intervals correspond to the four periods of the life cycle of economic agglomeration, which confirms Hypothesis 2.
When the degree of economic agglomeration was low and less than the first threshold value (lnAGG ≤ -0.424), the coefficient of economic agglomeration was significantly positive. However, in terms of the magnitude of the regression coefficient, the small value implied a weak facilitation effect. The infancy stage was represented by this. The number and scale of various industries in the agglomeration area were relatively small, and they were frequently in the stage of an agriculture-supporting industry. Economic development, technology level, and agglomeration degree were relatively low, and although there was a certain trickle-down effect, the effect was weak. Crossing the first threshold and reaching the second threshold value (−0.424 < lnAGG ≤ -0.204), it was significantly negative at the 1% level, and economic agglomeration presented a significant inhibitory effect on AGTFP (−0.334). This interval corresponded to the growth stage, China's initial rapid economic development was undoubtedly based on the blood-sucking of the scissors in the rural areas. Rapid urbanization led to the outflow of the rural population, and the siphoning effect of cities left a large number of rural areas in ruins. Crossing the second threshold (−0.204 < lnAGG ≤ -0.196), it was significantly positive at the 1% level, that is, economic agglomeration showed a promoting effect and has a strong positive effect on AGTFP (4.569). This interval corresponded to the maturity stage, higher economic density implied the spillover effects of sharing, matching, and learning in agglomeration economies were greater.
28
At this time, the localized and urbanized economies were prominent, and the externalities generated by the higher level of economic agglomeration promoted AGTFP through the radiation effect. In a real sense, it has entered the stage of industry back-feeding agriculture and urban supporting rural areas. With the increasing degree of economic agglomeration greater than the third threshold (lnAGG ≥ −0.196), economic agglomeration presented a weak but insignificant inhibitory effect on AGTFP. This interval corresponded to the decline stage, the crowding effect was manifested by the shortage of resources, rising factor prices, and intense competition for agglomeration. The reason for the insignificant effect may be that the economic agglomeration in YRD was mostly in its infancy and rapid development stages, and has not yet reached the decline stage.
Result of threshold regression.

Notes: *p < 0.1, **p < 0.05, ***p < 0.01.
Impulse response of economic agglomeration on AGTFP
The impulse response analysis employing a panel VAR model is more suited for determining the degree of dynamic influence of economic agglomeration. The LLC, IPS and ADF-Fisher tests were chosen to perform unit root checks of the data to test the stationarity of the data, as shown in Table 6.
Test for stationarity of variables.

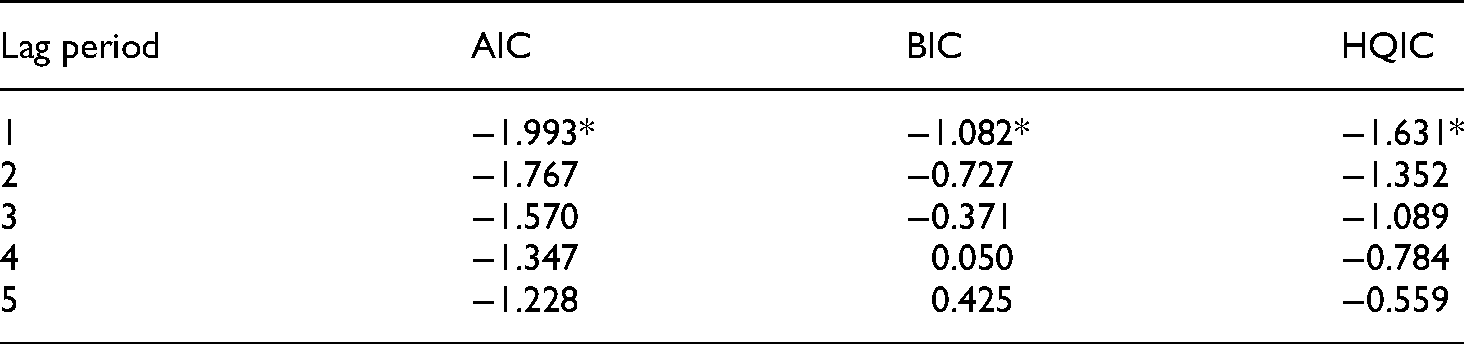
The model's optimal lag order was then determined, as shown in Table 7, and the results of the three determination criteria, AIC, BIC, and HQIC, indicated that the choice of lag order-1 was appropriate.
The choice of lag order of variables.
Finally, impulse response function analysis was performed to summarize the impulse response plots of the Monte-Carlo simulation 500 times. The results of the impulse response analysis were as follows:
Figure 4(a) represents the response of AGTFP to its own shocks. Specifically, the peak of AGTFP on self-shock was in period 1, indicating that the value of AGTFP in the current period was closely related to that of AGTFP in the previous period, and had a weak negative effect initially. As the number of periods increases, the impact effect of AGTFP on itself gradually diminishes and basically converges to zero in period 4. It showed that agricultural resource inputs and outputs from the previous period have a positive impact on the subsequent AGTFP, and that the high-quality development trend of agriculture must be maintained to reduce undesirable outputs, which was conducive to agricultural green development in the next phase. Figure 4(b) represents the shock response of economic agglomeration (AGG) to AGTFP. The effect of economic agglomeration on AGTFP showed a continuous effect after being influenced by one standard deviation of economic agglomeration. After reaching the peak in the second period, it began to decrease slowly and lasted for a long time, and still maintained a positive effect in the tenth period. That is, it showed a positive effect trend of rising first and then falling, and tends to be stable in the long run.

Results of impulse response analysis.
Regional heterogeneity analysis
Because cities differ in terms of economic emphasis, financial support for agriculture, and rural human capital, distinct effects of economic agglomeration on local AGTFP may occur. As a consequence, this paper divided the 41 cities in the YRD region into two types of samples: center cities and peripheral cities, metropolitan coordinating region and non-metropolitan coordinating region. And then explored the regional heterogeneity of the impact of economic agglomeration on AGTFP.
(1) Center-peripheral cities. (2) Metropolitan cities and non-metropolitan cities
The municipalities directly under the central government and provincial capitals of the YRD's 41 cities were regarded as center cities. At the same time, since Ningbo was a sub-provincial city and Suzhou was the city in Jiangsu Province with the largest GDP, both Ningbo and Suzhou were also categorized as central cities, while other prefecture-level cities were classified as peripheral cities. Comparing model (1) and model (2) in Table 8, it can be seen that economic agglomeration showed a negative but insignificant effect on AGTFP for the central cities, while the AGTFP for peripheral cities was significantly positive at the 1% level. The crux of the problem was the rising cost of urban and rural mobility. In coastal locations, housing cost has become a significant expense of life, while the cost of housing in center cities was out of reach for most farmers. If the rural labor force is free to relocate to cities, rural regions can better achieve the growth of agricultural scale and modernization, which was conducive to rural revitalization, and also helped to reduce the production cost of Chinese agricultural products and improve agricultural international competitiveness,
52
which had a substantial impact on AGTFP growth.
Analysis of heterogeneity in YRD.

Notes: Robust standard errors in parentheses, *p < 0.1, **p < 0.05, ***p < 0.01.
The metropolitan cities were the 26 cities listed in the Yangtze River Delta City Cluster Development Plan, which was formally accepted by the executive meeting of the State Council in May 2016, and Non-metropolitan cities referred to the remaining 15 cities. The results of model (3) and model (4) in Table 8 showed that economic agglomeration was significantly positive at the 5% level for non-metropolitan cities, but not for metropolitan cities. The reason for this was that as the metropolitan region continued to urbanize, the agricultural circle continued to migrate outward. Suburban agriculture was impacted by the large market in the urban region, which must fulfill the consumption demand of the urban population in the metropolitan area while also competing with the income of the urban inhabitants. As a result, suburban agriculture had the development direction of mechanization, intensification, facility and high efficiency.
Interestingly, in the metropolitan cities, as shown in model (3), industrialization was significantly positive. The reason was that Peigang Zhang defined industrialization in Agriculture and Industrialization in a new way: not only the increase of the proportion of industrial production but also the mechanization and modernization of agriculture. When industrialization reached a mature stage, if the market law was allowed to continue to work, it will inevitably lead to changes in the structure of agricultural production, the expansion of agricultural markets and the improvement of agricultural production technology. This was the time to officially enter the stage of industry nurturing agriculture, which was conducive to the improvement of AGTFP. In the non-metropolitan area, as shown in model (4), a significant positive effect of urbanization was observed for the first time. This suggested that non-metropolitan locations had lower living costs than metropolitan areas, as well as reduced human resource flow costs between urban and rural areas. As a result, social capital may be diverted to rural regions, and new energy can be pumped into agriculture's green development.
Discussion and conclusion
Based on the above empirical results, the following three conclusions were obtained:(1) From 2010 to 2020, the YRD's overall AGTFP increased steadily over time, while the spatial pattern showed a synergistic increase around the core cities (Nanjing, Hangzhou, and Hefei), with the northern and southern cities having distinct spatial clustering characteristics. (2) Economic agglomeration has a non-linear effect on AGTFP. Specifically, the infancy stage exerted a weak promotion effect on AGTFP through the trickle-down effect; the growth stage suppressed AGTFP through the siphoning effect; the maturity stage significantly promoted AGTFP through the radiation effect; and the decline stage showed a crowding effect, which was detrimental to AGTFP. Overall, economic agglomeration has a positive impact on AGTFP, but the effect lagged. (3) Economic agglomeration can promote AGTFP in peripheral cities and non-metropolitan area cities, while it showed a suppressive effect in central cities.
Some important findings deserve special attention. This paper verified that the nonlinear effect of economic agglomeration in the YRD region on AGTFP was consistent with life-cycle theory through a threshold model, the growth and maturation stages were of particular interest To begin, in the growth stage, economic agglomeration can inhibit AGTFP through the siphoning effect. Industrialization and urbanization were typical paths of economic development in developing countries, and early accumulation that lacked external resources had to rely on the low cost of its resources such as land and human resources. Thus, in the early stage of economic growth, acquiring a large number of cheap land and cheap labor from rural areas was a shortcut to the economic miracle. In the case of China's reality, the urbanization brought about by rapid economic agglomeration has not essentially absorbed the rural population, but rather served as a casualty of urban development. Many rural laborers went to cities but struggled to afford the high cost of living, and as they aged, the final destination was still the countryside. However, since the main labor forces of the countryside flowed to the cities, it was difficult for the countryside to develop, which was a vicious circle. Then, In the maturity stage, economic agglomeration can promote AGTFP through the radiation effect. The high concentration of economic activities effectively reduced barriers to capital factor mobility by amplifying the effects of sharing, matching and learning, which in turn optimized capital allocation and improved AGTFP. Last, digital inclusion financial was not conducive to AGTFP improvement, this result was different from existing studies.47,53,54 The reason for this may be that, on the one hand, due to a lack of agricultural production factors and a scarcity of financial products that truly correspond to “agriculture, rural areas, farmers”, many platforms were directly moved from the city back to the rural, which was not only ineffective but also wasteful of resources, making it difficult to promote and implement digital financial inclusion products. On the other hand, farmers’ lack of financial literacy and traditional conservative thinking has led to insufficient awareness of financial services and low Internet participation, such as loans, payments, and wealth management through digital financial service platforms. Farmers and rural businesses have difficulty in taking advantage of the third-party financial support provided by digital financial inclusion to increase productivity. 55
This paper has both theoretical and practical implications. In the theoretical sense, on the one hand, it breaks through the limitations of existing agricultural green transformation from the perspective of economic agglomeration research. On the other hand, the life cycle theory is introduced to further expand the theoretical mechanism of the impact of economic agglomeration on AGTFP. In a practical sense, this study helps to understand the relationship between economic agglomeration and AGTFP in the social context of urban support for rural areas and industrial support for agriculture in China. It has important implications on how to coordinate the two and thus promote green and high-quality agricultural development. Therefore, the following two recommendations are made: (1) Economic agglomeration has a substantial direct impact on the enhancement of AGTFP, and a green development path for agriculture induced by economic agglomeration should be established. However, since economic agglomeration has a non-linear effect on AGTFP, the government should accurately grasp the critical point at which the positive externalities of economic agglomeration come into play and objectively view the impact of economic agglomeration on rural farmers in agriculture. (2) The influence of economic agglomeration on AGTFP tends to lag, and agricultural inputs and outputs differ significantly across urban regions. Accordingly, agricultural development and environmental protection strategies are designed with a long-term vision on the one hand. Government, on the other hand, the government should formulate differentiated regional development policies to guide local agricultural production on the actual situation.
There are still limitations in this paper, and two points deserve improvement. The first point is that some studies have shown that the spatial diffusivity of economic agglomeration is consistent with spatial spillover effects in spatial econometric analysis.8,45 So, is there a spatial correlation between economic agglomeration and green agricultural development? Given the space limitation and outside the theoretical framework of this study, but is well worth exploring in future research. Another point is that pesticides are not considered in the calculation of agricultural non-point source pollution. The reason for this is the difficulty of quantifying pesticide pollution sources and the unavailability of discounted data. The measurement of pesticide contamination deserves further analysis in future studies.
Author statement
Fengting Wang: Conceptualization, Writing-Original draft preparation, Writing-Reviewing and Editing. Hao Wang: Methodology, Software, Visualization, Resources. Cong Liu: Data curation. Lichun Xiong: Resources, Software, Validation. Fanbin Kong: Writing-Reviewing and Editing, Supervision, Project administration.
Footnotes
Declaration of conflicting interests
The author(s) declared no potential conflicts of interest with respect to the research, authorship, and/or publication of this article.
Funding
The author(s) disclosed receipt of the following financial support for the research, authorship, and/or publication of this article: This research was funded by the Leading Talent Cultivation Project of Philosophy and Social Sciences in Zhejiang Province, grant number 21YJRC12-1YB.
Notes
Author biographies
Fengting Wang received her PhD from China Agricultural University in 2020. She is a lecturer at Zhejiang A&F University and her current research interests are in agroecology and environment.
Hao Wang was born in 1999 and is a master's student at Zhejiang A&F University. His current research interest is in green development of agriculture.
Cong Liu was born in 2000 and is a master's student at Zhejiang A&F University. Her current research interest is in green development of agriculture.
Lichun Xiong received his PhD from Beijing Forestry University in 2019. He is currently an associate professor at Zhejiang A&F University, and his main research interests are in agroecology and environment.
Kong Fanbin is a professor in the School of Economics and Management at Zhejiang A&F University, focusing on agricultural resources and environment.