
Abstract
This paper characterizes the shape of supercooled large droplet (SLD) ice as a combination of horn ice and plume ice, leveraging its typical features. A numerical simulation approach is employed to investigate how SLD ice with varying heights and ranges impacts aerodynamics on supercritical airfoils. For cruise airfoils, the height change of plume ice has a significant threshold effect on lift-drag characteristics. When the plume ice height nears or surpasses that of the horn ice, lift and drag characteristics deteriorate sharply. In the case of high-lift airfoils, the range change of plume ice shows a notable threshold effect. Once the plume ice range extends to the main wing's upper surface, lift and drag characteristics decline abruptly. In contrast to the single ridge ice, this study fills the knowledge gap regarding the influence of SLD ice on lift and drag characteristics. It also offers crucial references for establishing the criticality criteria of SLD ice.
Keywords
Introduction
Aircraft icing has become a serious threat to flight safety. Jeffrey A. Cale and Wayne R. Sand 1 researched 803 icing-related accidents in the United States between 1975 and 1988. Kevin R. Petty and Carol D. J. Floyd 2 compiled the statistics related to icing accidents in the U.S. from 1982 to 2000 by reviewing the NTSB accident database. In particular, in 1994, an air disaster occurred in Roselawn, USA, where an ATR-72 aircraft plunged and crashed, resulting in the death of all the passengers and the flight crew. 3 This is an accident caused by supercooled large droplets icing.
Unlike regular droplets whose particle size does not exceed 100 μm, supercooled large droplets will form unique SLD ice patterns on the surface when impacting the wall due to their special dynamics, such as fragmentation, impact splash and rebound,4–9 as shown in Figure 1. SLD icing typically occurs beyond the existing icing protection zone of an aircraft. The most important feature of this SLD ice accumulation is presence of nodule feature (called plume ice in this paper) after the leading horn feature (called horn ice in this paper), which alters the wing shape, thereby affects the flow field characteristics outside the wing, and thus affects the aerodynamic performance of the aircraft.

Typical ice shape after the horn ice of the SLD accumulation. 4
Icing-related accidents have driven researchers to carry out numerical simulations and experimental investigations to elucidate icing concept on an airplane. Today, extensive research is ongoing to gain deeper insights into how icing affects aircraft flight performance.
In terms of experiments, Pouryoussefi 10 researched the effects of icing on an NACA23012 airfoil. Their experiments were applied to the clean airfoil, runback ice, horn ice, and spanwise ridge ice. This work found that ice accretion on the airfoil can contribute to formation of a flow separation bubble on the upper surface downstream from the leading edge.
Liu 11 investigated the effects of ice accretion on the aerodynamic performances and wake characteristics of a propeller model used for unmanned-aerial-system (UAS) under different icing conditions (i.e. rime and glaze). It is found that complex large-scale vortices are found to enhance the turbulent mixing in the propeller wake and produce an evident velocity deficit channel around the outer board of the propeller blades, providing direct evidences in elucidating the dramatic decrease in thrust generation and the significant increase in power consumption of the rotating propeller model in icing conditions.
Hann 12 investigated the aerodynamic performance degradation on an S826 airfoil with 3D-printed ice shapes. The experimental results showed that the icing performance penalty correlated to the complexity of the ice geometry.
Broeren 13 conducted an experimental effort to quantify the aerodynamic degradation due to artificial ice shapes attached to a 5.2% scale semi-span model of the High-Lift Common Research Model (CRM-HL) in the NASA National Transonic Test Facility (NTF). The reduction in maximum lift coefficient ranged from 8.0% to 9.8% depending upon Reynolds number and ice-shape configuration.
Broeren 14 simulated the plume ice, the main feature of the SLD ice (Figure 2), and carried out experiments on the effect of the SLD ice on the aerodynamic characteristics of a single-segment airfoil (without leading edge slats and trailing edge flaps). The test results show that the horn ice is still the most influential ice feature on aerodynamic characteristics. The aerodynamic characteristics of the “horn ice + plume ice” combination are better than those of the horn ice only.

Simulated ice for plume ice. 14
Breitfuß 15 studied lift characteristics under different icing conditions including normal droplet, freezing drizzle and freezing rain (two categories of SLD) based on a NACA0012 airfoil with a wingspan of 1.8 m and chord length of 1.0 m, and determined the effect of different droplet sizes on the aerodynamic performance.
Bragg 16 conducted an experimental study on the aerodynamic characteristics of NACA23012 with multiple ice profiles.
Lee 17 provided a review of findings from recent Illinois investigations on the effects of icing on airfoil aerodynamics. Bragg 18 also gave an overview of the effect of various ice types on the aerodynamic characteristics of airfoils.
Meanwhile, many researchers conducted studies on the impact of icing on aircraft using the CFD method. Liu, 19 Zhou 20 studies on the aerodynamic characteristics of a NACA23012 airfoil with a single ice ridge by CFD. Their work shows that the numerical simulation is valid, and it can be an alternative to study ice accretion effects at the SLD condition on airfoil aerodynamics, leading to reduction in research cycle time and cost.
Kumar 21 conducted numerical simulations of the aerodynamic characteristics of multiple airfoils with SLD ice. However, it should be noted that the SLD ice shape in 21 was only an ice-ridge formed behind the anti-icing area, lacking the main horn ice at the airfoil leading edge. Additionally, the airfoils studied did not include supercritical airfoils. Nevertheless, the numerical simulation approach was similar to that used in this study. This also demonstrates the feasibility of our method for investigating the effects of SLD ice on aerodynamic characteristics.
Zhang 22 investigated the aerodynamic characteristics of iced high-lift airfoils under SLD conditions with varying large droplet sizes by CFD. However, the study had two key limitations: (1) The SLD ice shapes were numerically generated and only accounted for horn ice at leading-edge, omitting downstream plume ice caused by droplet splashing/bounce and reattachment. Consequently, the ice in reference 22 fails to exhibit fundamental differences between SLD and normal icing characteristics. (2) Reference 22 analyzed only the pressure distribution under a single condition, lacking computational analysis of stall characteristics.
Page 23 addressed the topics of three-dimensional inflight icing simulation and CFD analysis of iced tails in the industrial environment. Iced lifting performance is found to correlate positively with forward sweep and exhibit a more nuanced relationship to chord and span of leading edge extension.
Bornhoft 24 scanned the ice shapes by laser, then convert those full 3-D images and then simulated the fluid field by wall-modeled LES. The study demonstrates the effectiveness of the wall-modeled LES technique in simulating the complex aerodynamic effects of iced airfoils, providing valuable insights for aircraft design in icing environments and highlighting the importance of accurately representing ice geometries and roughness scales in simulations.
Zhou 25 employed an improved delayed detached eddy simulation (AMD-IDDES) method to investigate the flow characteristics of an iced swept wing. Compared with an iced straight wing, a swept wing exhibits distinct aerodynamic behavior driven mainly by the sweep angle. Overall, this study highlights that the aerodynamic forces of an iced swept wing are primarily governed by sweep-induced spanwise flow and associated shear layer dynamics, with minimal influence from the root and tip regions.
Shah 26 presented a computational investigation of glaze ice effects on a swept wing using simplified, spoiler-like geometries to imitate horn ice shapes. The results demonstrate that the RANS approach captures key aerodynamic trends, including lift degradation and pitching moment inflection behavior, despite known limitations in modeling separated flows. Comparisons with experimental data reveal that configurations with spoilers oriented normal to the wing surface incur the most severe aerodynamic penalties. Overall, the RANS approach proves to be a suitable starting point for characterizing the performance impacts of ice accretion on swept wings with simplified horn-shape imitators.
Ignatowicz 27 investigated how surface roughness was tackled in RANS with wall resolved boundary layers for aeronautics applications, with a focus on ice-induced roughness. This work principally involves turbulence model modifications to account for changes in the velocity and temperature profiles in the near-wall region.
Chen 28 employed a modified laminar–turbulent transition model that incorporates both separation and roughness-induced transition correction for icing simulations. The results indicate that roughness induces an earlier laminar–turbulent transition, thereby influencing the heat transfer coefficients. The effects of separation and roughness correction on rime icing simulation are minimal, but they are significant for glaze icing simulation, resulting in more accurate predictions of maximum ice thickness and ice horn orientation.
Kwon 29 simulated the aerodynamic load characteristics and the performance degradation of moderate aspect ratio wings with glaze leading edge ice using a three-dimensional compressible Navier-Stokes solver. Correlation of predictions with experimental data for swept wings with and without leading-edge ice formation shows the ability of the present computational technique to predict accurately both the distributed surface pressures and integrated sectional loads. The leading-edge flow separation and reattachment on the wing surface caused by the leading-edge ice shape are also well captured, showing a vortex formation and the spanwise migration of the flow inside the separated flow region. The performance degradation of the wing as a result of the leading-edge ice formation is numerically well demonstrated.
References10–29 demonstrate current research on the effects of ice shapes on airfoil/wing aerodynamic characteristics. However, the effect of SLD ice on the aerodynamic characteristics of supercritical airfoils or the high-lift airfoils with leading edge slats and trailing edge flaps was not included. Meanwhile, with advancements in computer CPU capabilities, mesh generation software, and numerical simulation software, the adoption rate of CFD methods has demonstrated significant advantages.
In this paper, the aerodynamic characteristics of both single-segment airfoil and high-lift airfoil with SLD ice are evaluated. Different combinations of horn ice and plume ice are considered. Within the reasonable range of the typical characteristics of the SLD ice (the height of the plume ice is lower than that of the horn ice), the most detrimental effects of SLD ice on aerodynamics can be found out based on CFD method, so that the critical SLD ice can be determined even when icing wind tunnel tests cannot be implemented. The critical ice refers to the ice shape that has the worst impact on the aerodynamics (especially lift) of an airfoil.
Calculating airfoils and ices
Three cut sections perpendicular to the leading edge of CJ828 aircraft wing both in cruise and high-lift configurations to obtain three airfoils with chord length of 3.6 m, 4.1 m, 7 m, as shown in Figure 3. CJ828 aircraft is the result of integrated and optimized design by new employees from different disciplines of Shanghai Aircraft Design and Research Institute (SADRI). Because of the different percentage of the slat to the whole wing, three different chord lengths were chosen. Also, because different chord lengths result in different ice shapes. The ice shape gets smaller as the chord length increases.

Calculated airfoil. (a) Cruise configuration of supercritical airfoils; (b) supercritical airfoils in a high-lift configuration.
The ice shape has two main components: horn ice (blue curve) + plume ice (red curve), as shown in Figure 4. The horn ice is calculated using LEWICE version V3.2.2, and the calculated status is the typical holding state of a wide-body aircraft. And the detailed status is: H = 13,000 ft, velocity = 130 m/s, AOA = 3.5°, MVD = 20 μm, LWC = 0.47 g/m3, T = 265.65 K. The shape of the plume ice is a reference to the SADRI icing wind tunnel tests in the NRC-AIWT. 5 This paper uses approximate equilateral triangles as an approximation to replace the plume ice.

Ice on the airfoils. (a) Horn ice and plume ice of the cruise airfoil; (b) horn ice and plume ice of a high-lift airfoil.
The calculation state of the supercritical wing in cruise configuration is: Ma = 0.45, T = 265.4 K, H = 11,500 ft, P = 65,780 Pa. The high-lift state is: Ma = 0.2, T = 265.4 K, H = 1000 ft, P = 97,716 Pa.
Calculation of aerodynamics
Numerical method and verification
The numerical simulation is conducted using ANSYS CFX version R18.1 for calculations. The governing equations are the Reynolds-averaged Navier-Stokes equations, and the turbulence model is the SST 30 full turbulence model.
The 30P30N high-lift airfoil is used as the test case. The airfoil and experimental results are from reference. 31 The cord length is 22in, Ma = 0.2, reference pressure is 349,600 Pa, density is 4.23 kg/m3, Re = 9 × 10⁶, temperature is 288.15 K.
The comparison between experimental and computational data is shown in Figure 5. The calculated results are basically in agreement with the experimental results. The calculated pressure coefficient (CP) distribution on the airfoil surface at AOA = 8o and 21o shown in Figure 6 is basically in agreement with the experimental results. The comparison results indicate that the numerical simulation method in this paper is credible.
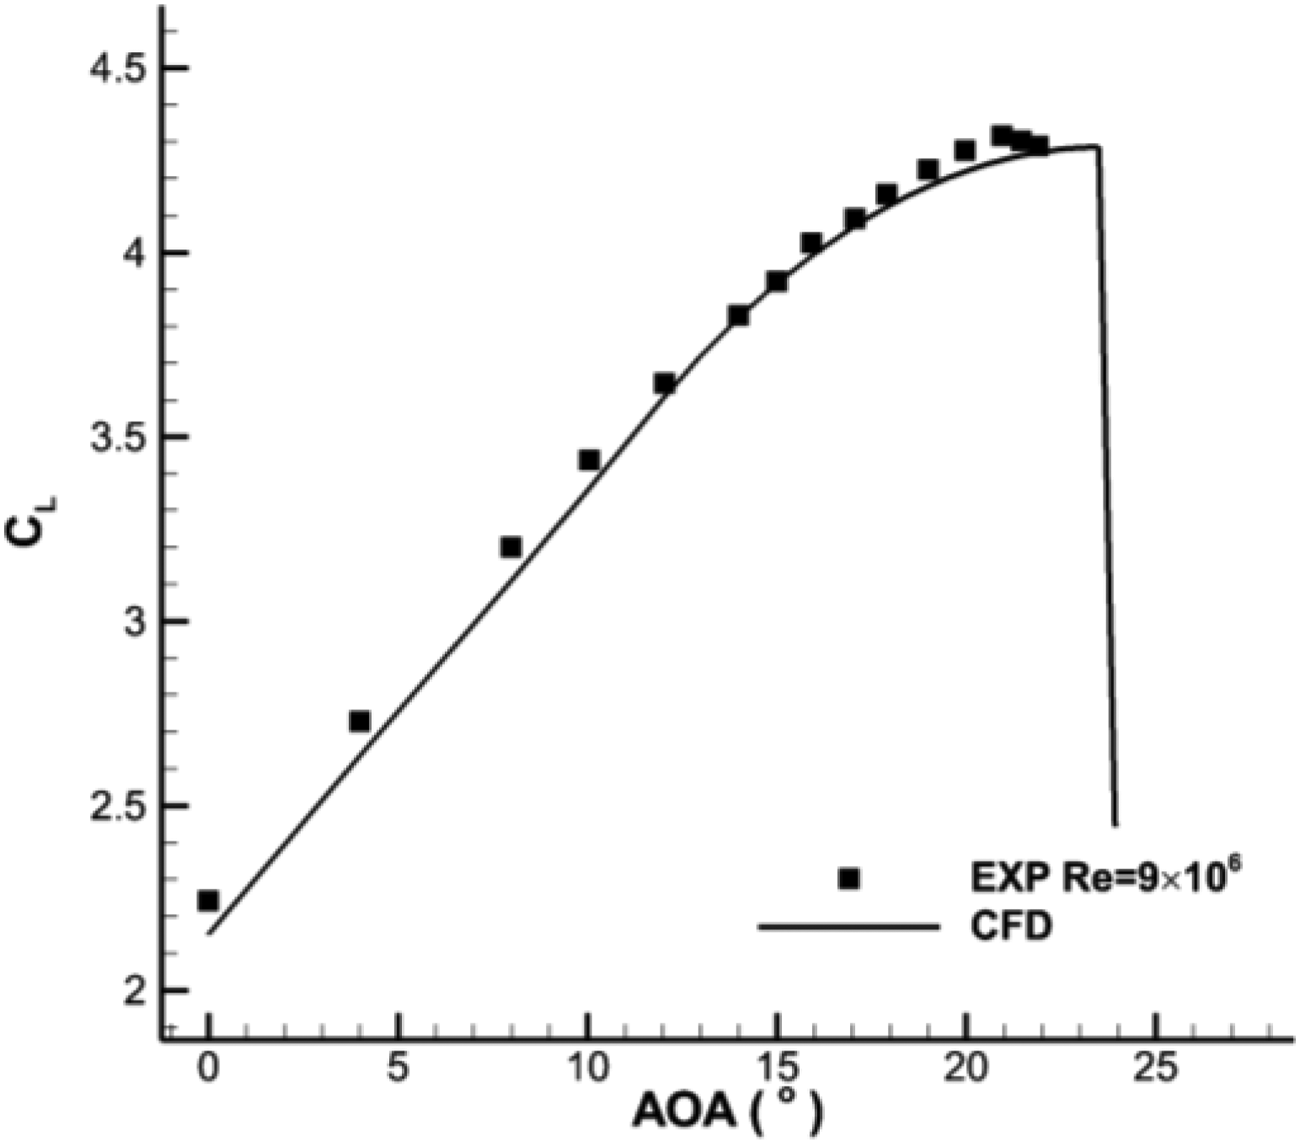
Comparison of lift coefficient (CL) between experimental and calculating results.

Comparison of pressure coefficient (CP) distribution between experimental and calculating results. (a) AOA = 8°; (b) AOA = 21.
Airfoil with 4.1 m chord length
Firstly, the aerodynamic characteristics with ice are calculated for an airfoil with a chord length of 4.1 m.
Taking the horn ice as benchmark, the aerodynamic characteristics of different SLD ice shapes (four different heights and four ranges of plume ice) are calculated for the combinations of the horn ice. As shown in Figure 7, the heights of the plume ice are 4.6 mm, 6.6 mm, 9.0 mm, and 20.0 mm. All the plume ice ranges are averaged into four equal parts.

Plume ice at different heights. (a) Four different heights; (b) Four ranges.
In Figure 8, the roughness in “roughness_4.6mm_1” denotes the plume ice. 4.6 mm in “roughness_4.6mm_1” denotes the height of the plume ice is 4.6 mm. 1 in “roughness_4.6mm_1” denotes the first area with plume ice after the horn ice. It should be noted that even within the range of range4, there is no plume ice on the main wing, meaning the maximum extent of feather ice is limited to the slat.

Aerodynamic characteristics for 4.1 m cruise configuration with different SLD ice shapes. (a) Lift coefficients for cruise airfoil; (b) drag coefficients for cruise airfoil. “roughness_X.Ymm_N” indicating that the ice in this case is with plume ice, and the height of plume ice is X.Ymm, and the range of plume ice is N.
The results are shown in Figures 8 and 9. For the cruise configuration (Figure 8), the aerodynamic characteristics of the horn ice with plume ice are better than those of the horn ice only. It can be observed that the height of the plume ice is less than the height of the horn ice. The maximum lift coefficient (CLMAX) does not decrease in each state, and when the height of the plume ice approaches that of the horn ice, the CLMAX actually increases. The impact of the plume ice range on the CLMAX is not significant. The larger the extent of plume ice, the more favorable its impact on aerodynamic performance.

Aerodynamic characteristics for the 4.1 m high-lift configuration with different SLD ice shapes. (a) Lift coefficients for high-lift airfoil; (b) Drag coefficient of the high-lift airfoil. “roughness_X.Ymm_N” indicating that the ice in this case is with plume ice, and the height of plume ice is X.Ymm, and the range of plume ice is N.
For the high-lift configuration (Figure 9), the maximum lift coefficient (CLMAX) does not decrease in each state. Height of plume ice has minimal impact on aerodynamics. Similar to the situation in the cruise configuration, the larger the extent of plume ice, the more favorable its impact on aerodynamic performance.
Airfoil with 3.6 m chord length
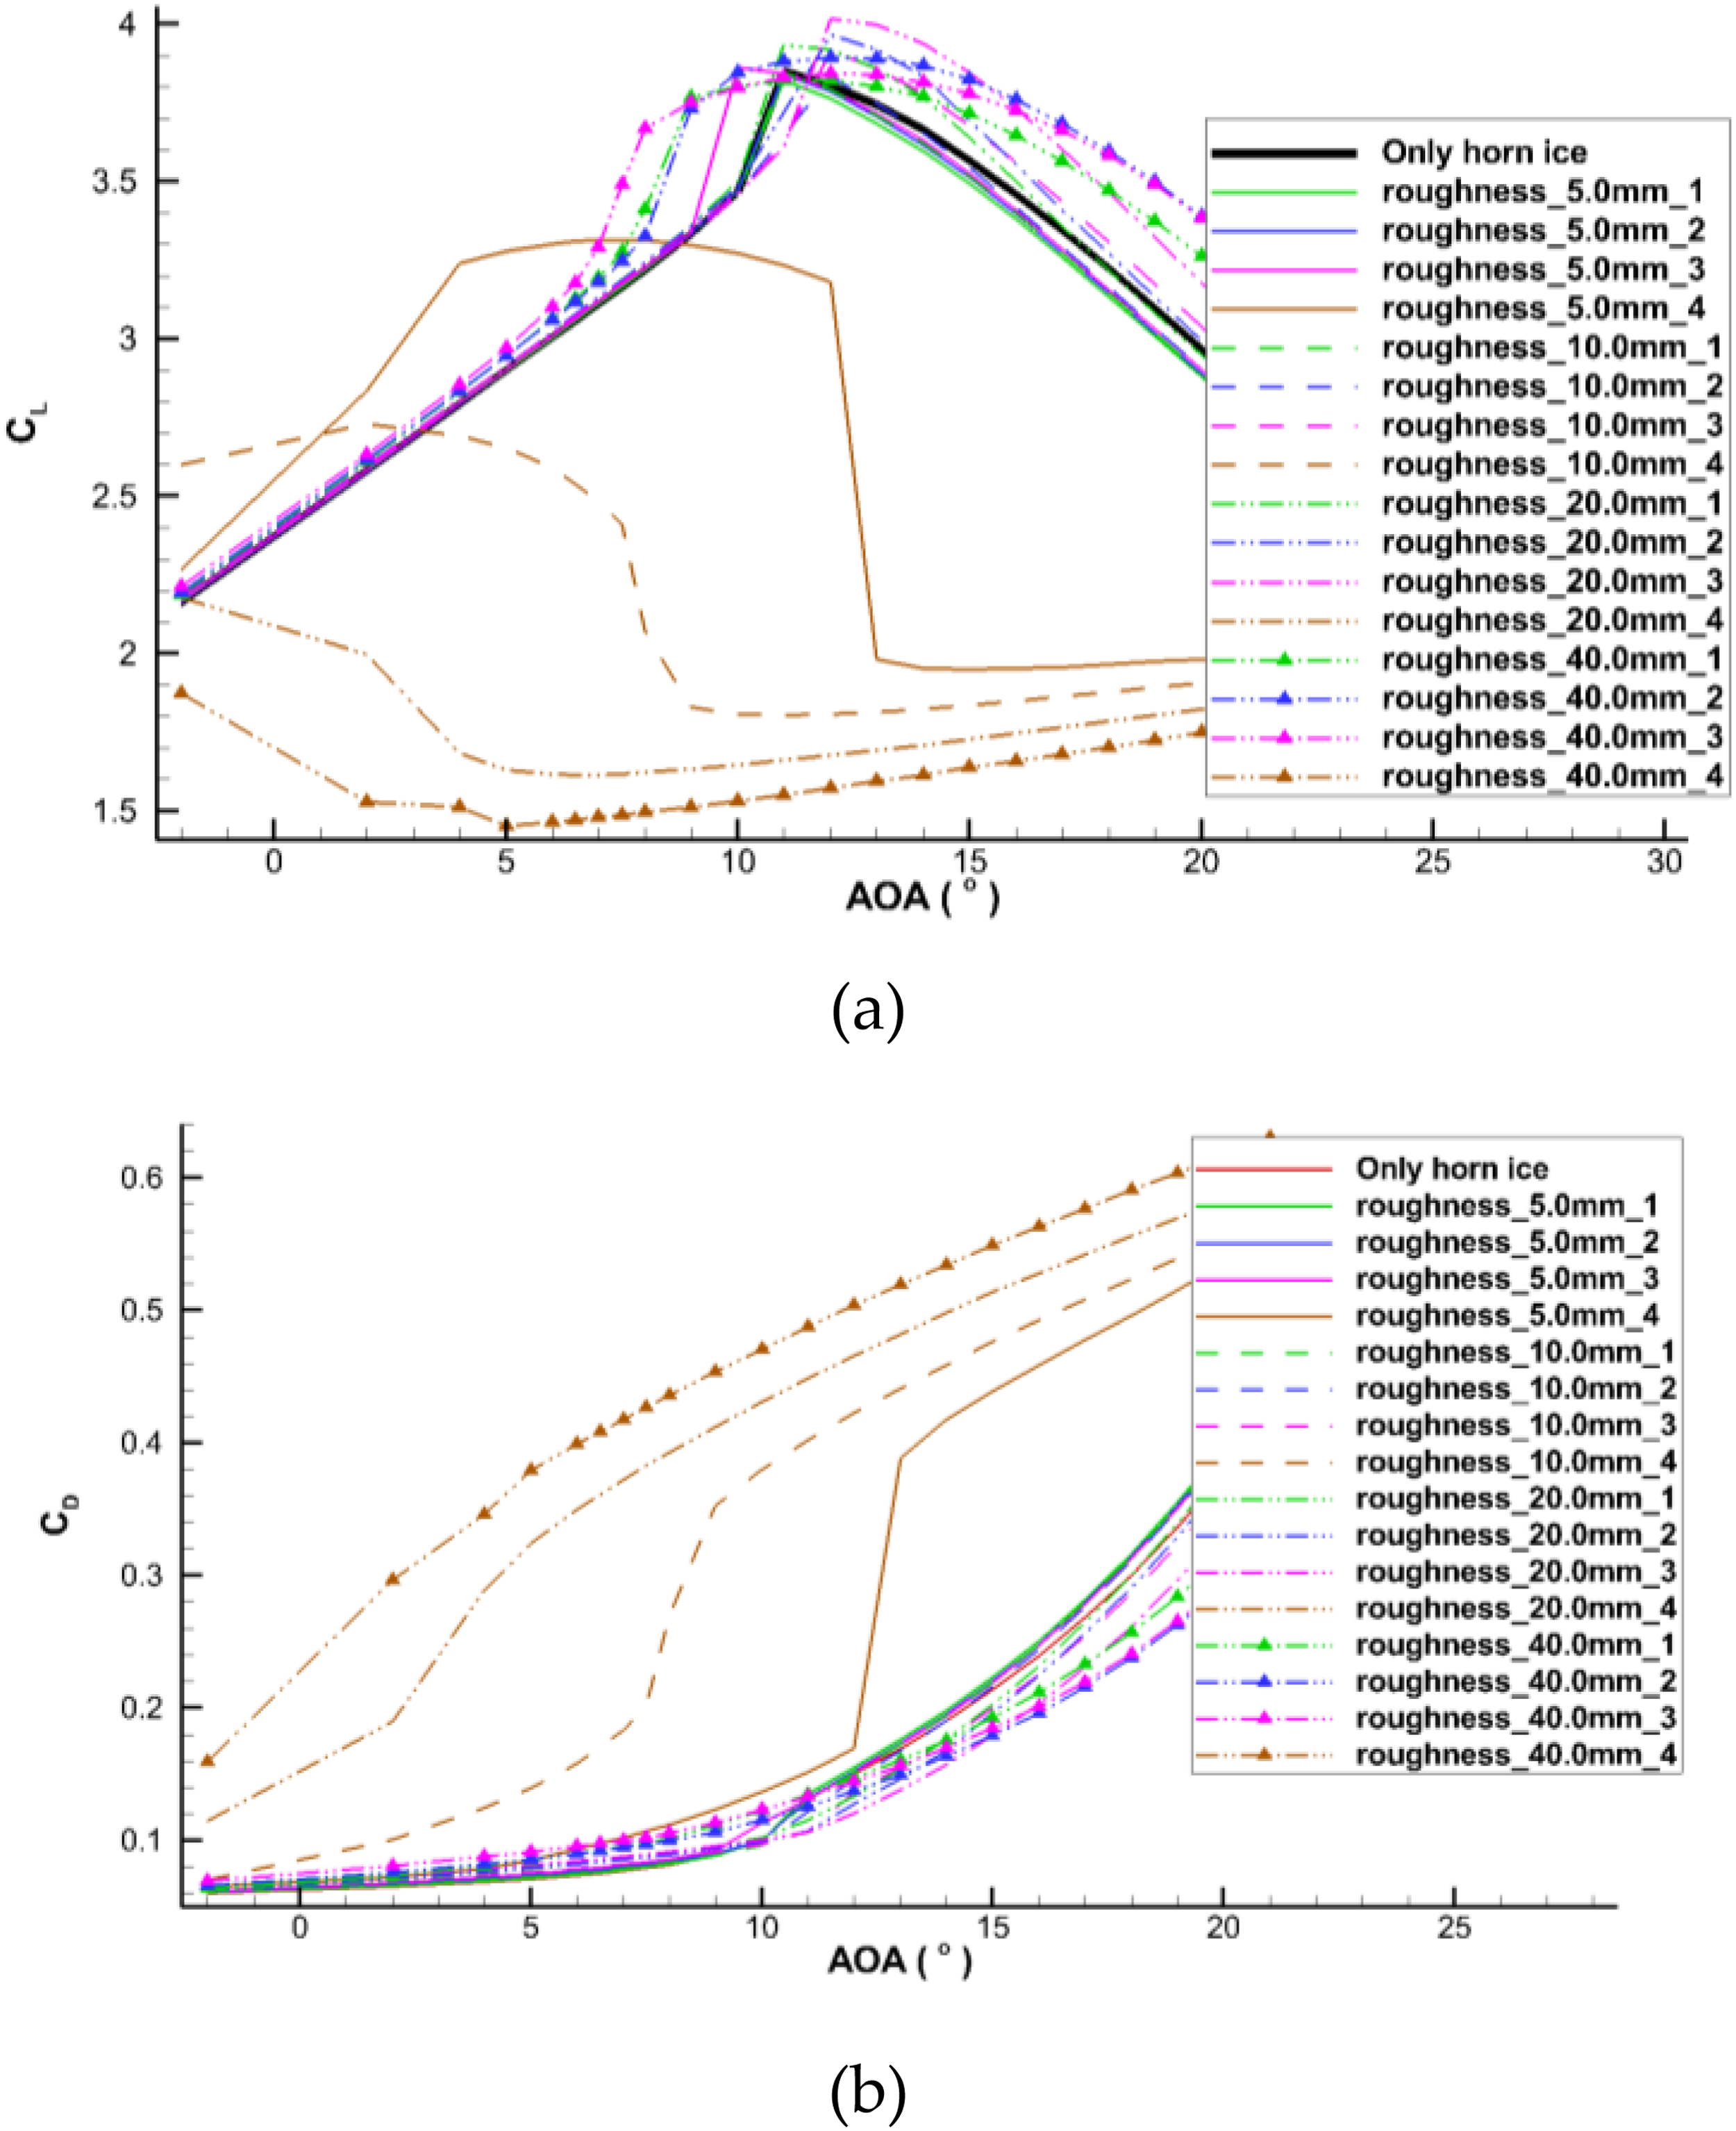
It should be noted that the plume ice range of the 4.1 m airfoil is on the slat only. It does not expand into the main wing. Moreover, the heights of the plume ice are smaller than the height of the horn ice. In this chapter, we will continue the study on the 3.6 m chord length airfoil and expand the range of the plume ice to the main wing, as shown in Figure 10. The heights of the plume ice are 5.0 mm, 10.0 mm, 20.0 mm, and 40.0 mm. The entire plume ice range is averaged into 4 equal parts. The height of 40.0 mm plume ice has exceeded the height of the horn ice. The calculation results are shown in Figures 11 and 12.

Upper surface of main wing with plume ice.

Aerodynamic characteristic for 3.6 m cruise configuration with different SLD ice shapes. (a) Lift coefficients for cruise airfoil; (b) drag coefficients for cruise airfoil. “roughness_X.Ymm_N” indicating that the ice in this case is with plume ice, and the height of plume ice is X.Ymm, and the range of plume ice is N.
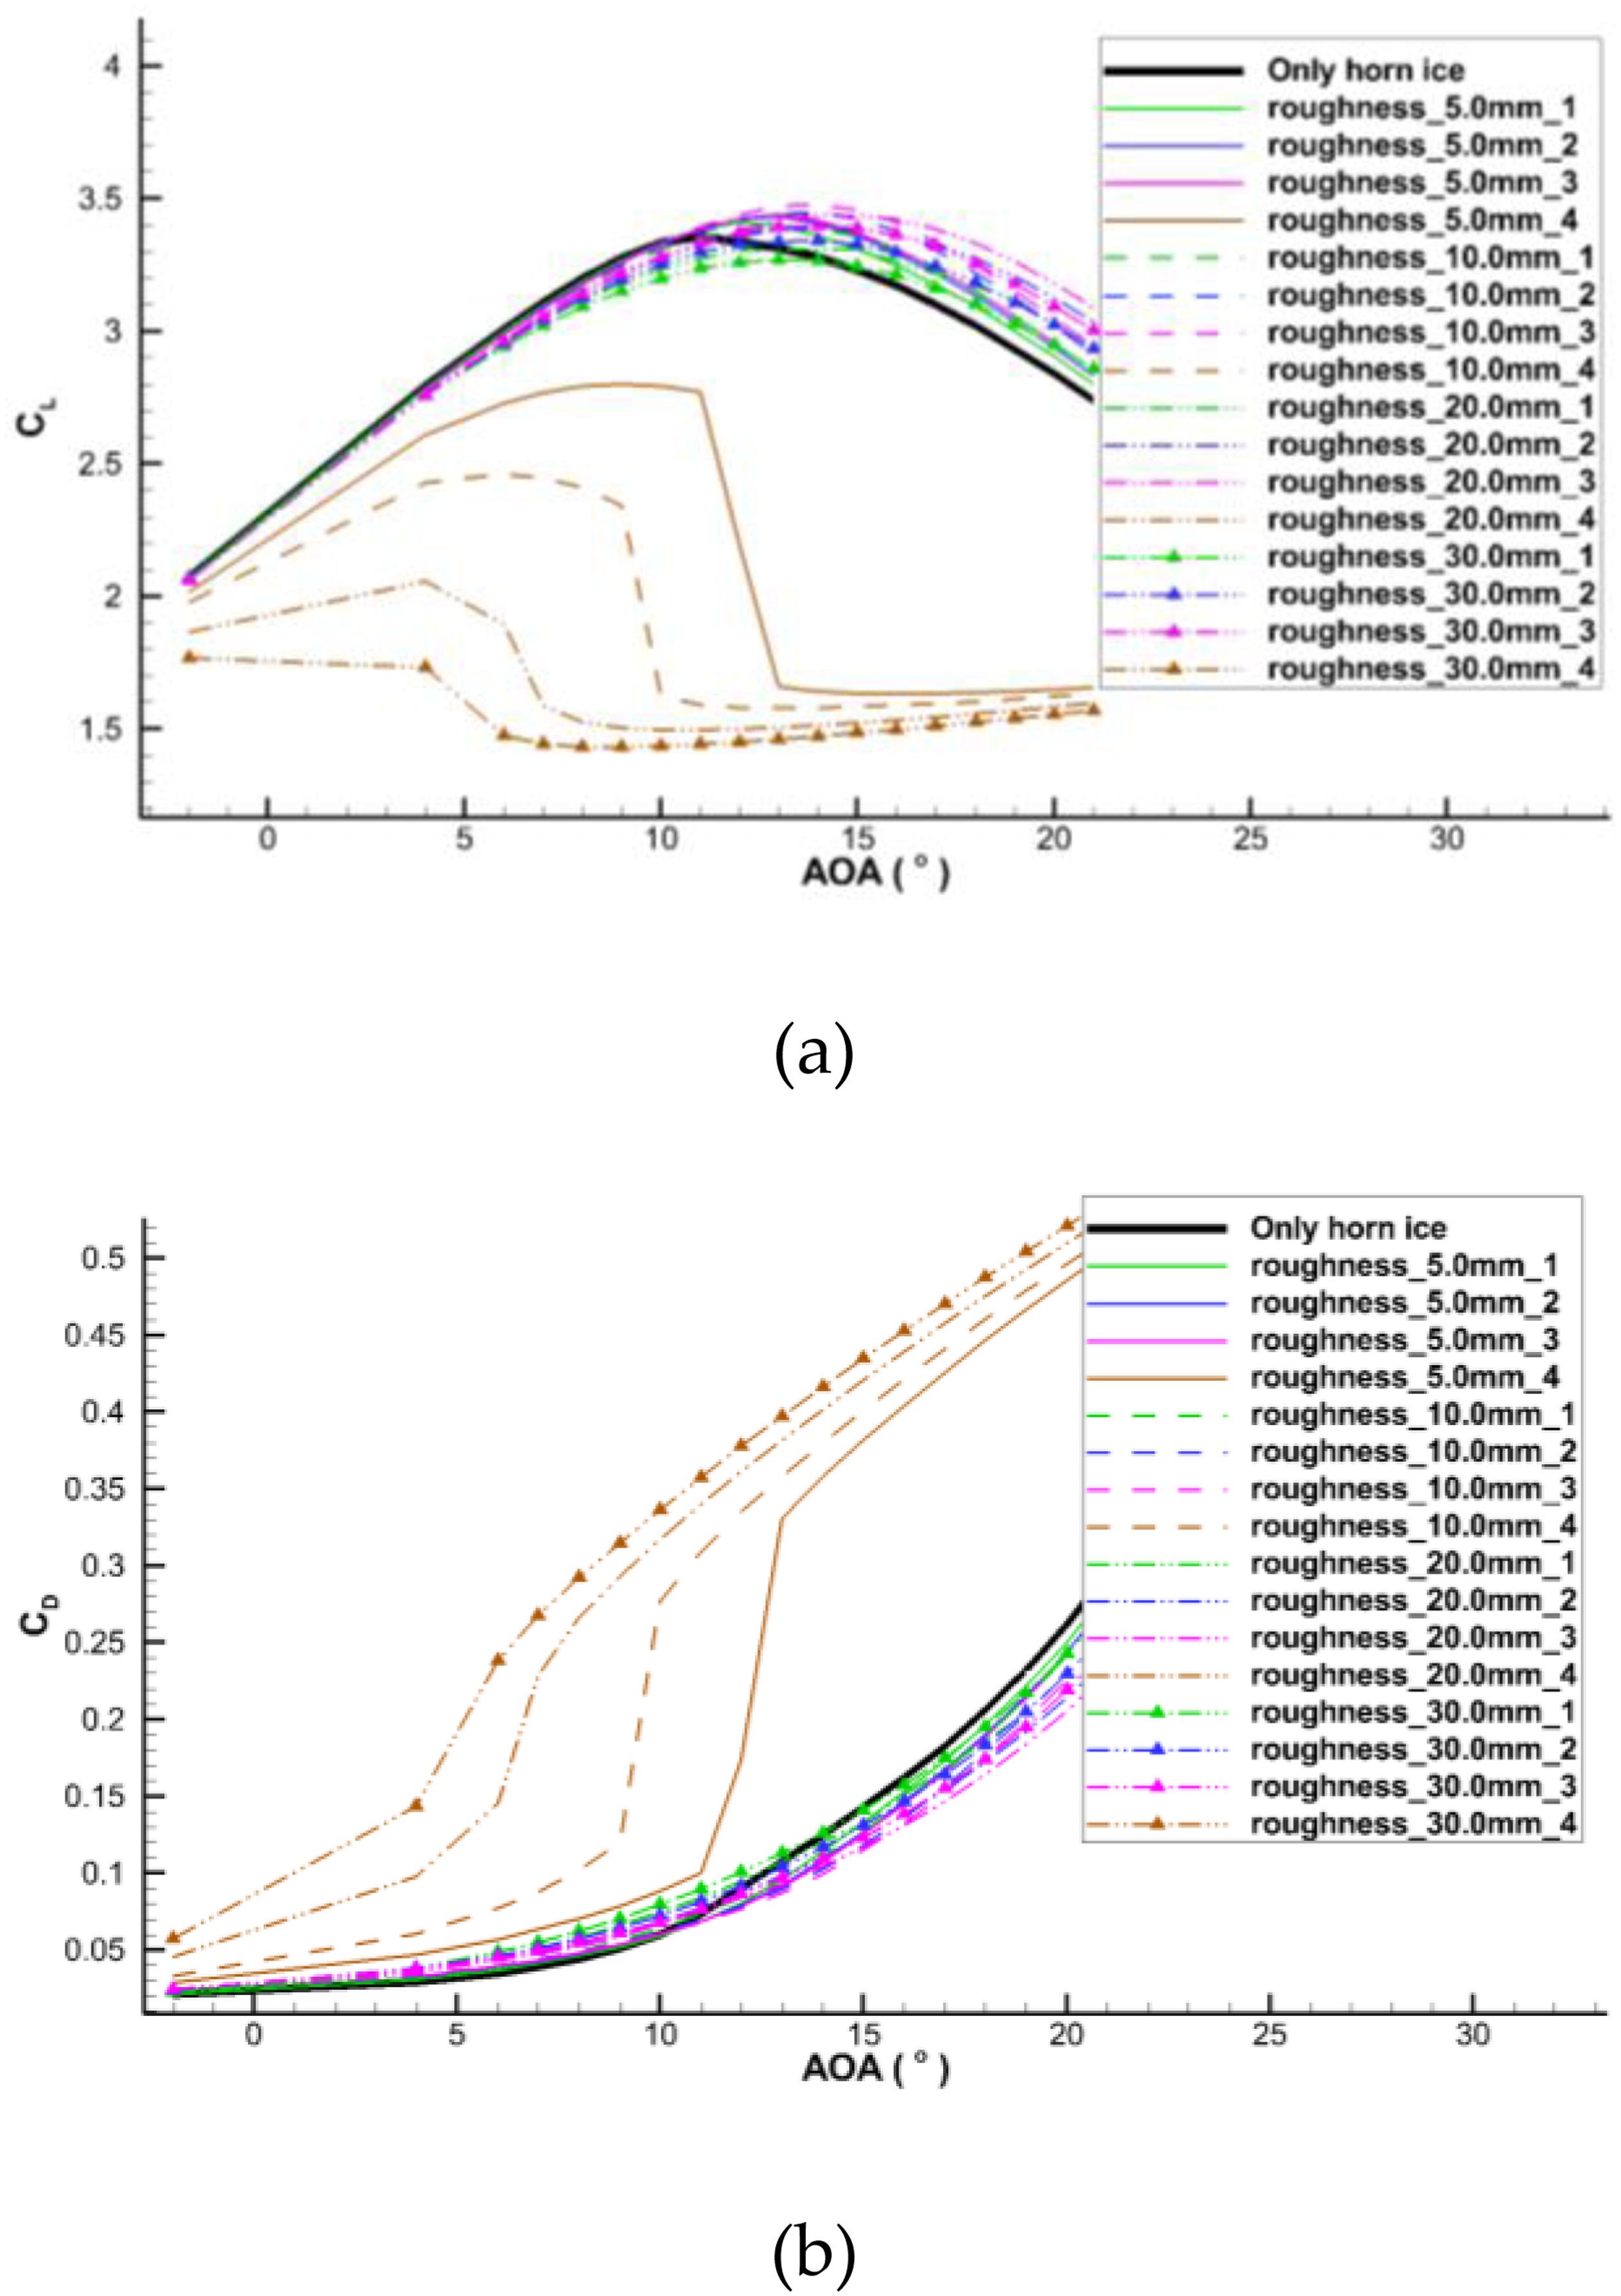
Aerodynamic characteristics for 3.6 m high-lift configuration with different SLD ice. (a) Lift coefficients for high-lift airfoil; (b) drag coefficients for high-lift airfoil. “roughness_X.Ymm_N” indicating that the ice in this case is with plume ice, and the height of plume ice is X.Ymm, and the range of plume ice is N.
It must be clarified that in this configuration, the plume ice distribution of range4 is located on the main wing.
For the cruise configuration (Figure 11), the deterioration of the SLD ice shape is obvious when the height of the plume ice is higher than horn ice. When the height of the plume ice is less than the horn ice, the aerodynamic characteristics of the SLD ice are better than those of the single horn ice. When the height of the plume ice approaches that of the horn ice, the CLMAX actually increases the most. When the height of plume ice exceeds that of the horn ice, the aerodynamic performance deteriorates. A larger coverage area is more beneficial to aerodynamics.
For the high-lift configuration (Figure 12), When the height of plume ice has minimal impact on aerodynamics, and its coverage also exerts little influence when plume ice is distributed solely on the slat. But the aerodynamic performance deteriorates sharply once the plume ice extends onto the main wing.
Airfoil with 7.0 m chord length
The heights of the plume ice for airfoil with 7.0 m chord length are 5.0 mm, 10.0 mm, 20.0 mm and 30.0 mm. Similarly, the whole plume ice range is divided into 4 equal parts. The 4th plume ice is on the upper surface of the main wing. The height of 20 mm plume ice is close to the height of the horn ice. The results are shown in Figures 13 and 14.

Aerodynamic characteristics for 7.0 m cruise configuration with different SLD ice shapes. (a) Lift coefficients for cruise airfoil; (b) drag coefficients for cruise airfoil. “roughness_X.Ymm_N” indicating that the ice in this case is with plume ice, and the height of plume ice is X.Ymm, and the range of plume ice is N.
Aerodynamic characteristics for 7 m high-lift airfoil with different SLD ice. (a) Lift coefficients for high-lift airfoil; (b) drag coefficient for high-lift airfoil. “roughness_X.Ymm_N” indicating that the ice in this case is with plume ice, and the height of plume ice is X.Ymm, and the range of plume ice is N.
For the cruise configuration (Figure 13), the deterioration of aerodynamic characteristics of the airfoil with SLD ice is obvious when the height of the plume ice is close to or higher than the height of the horn ice. When the height of the plume ice is smaller than the horn ice, the aerodynamic characteristics of airfoil with SLD ice shapes do not have any obvious deterioration. A larger coverage area is more beneficial to aerodynamics.
For the high-lift configuration (Figure 14), the aerodynamic characteristics deteriorates sharply when there is plume ice on the main wing. When there is no plume ice on the main wing, there was no obvious deterioration in the aerodynamic characteristics of the horn ice with various combinations of plume ice.
Flow field analysis
Cruise airfoil
Figures 8, 11 and 13 show that the cruise airfoils with different chord lengths have the same aerodynamic characteristics with SLD ice. The 3.6 m chord length airfoil is analyzed as an example.
As shown in Figure 15, when plume ice is present after the horn ice (the height of the plume ice does not exceed the horn ice), the large separating vortex after the horn ice is replaced by plume ice and small separating vortex. The peak suction is increased (see Figure 16). Smaller separating vortices exist between the plume ice, which act as aerodynamic bearings and reduce drag. And as the ranges of the plume ice increase, the separating vortex behind the plume ice gradually decrease (see Figure 17), resulting in a gradual increase in suction on the region close to the horn ice (Figure 16(b)), which leads to an increase in the lift coefficient.

Comparison of flow field between 20 mm plume ice and no plume ice. (a) Only horn ice; (b) horn ice with 20 mm plume ice.

Comparison of Cp between 20 mm plume ice and no plume ice. (a) Cp of the whole airfoil; (b) zoom in the horn ice and plume ice region.
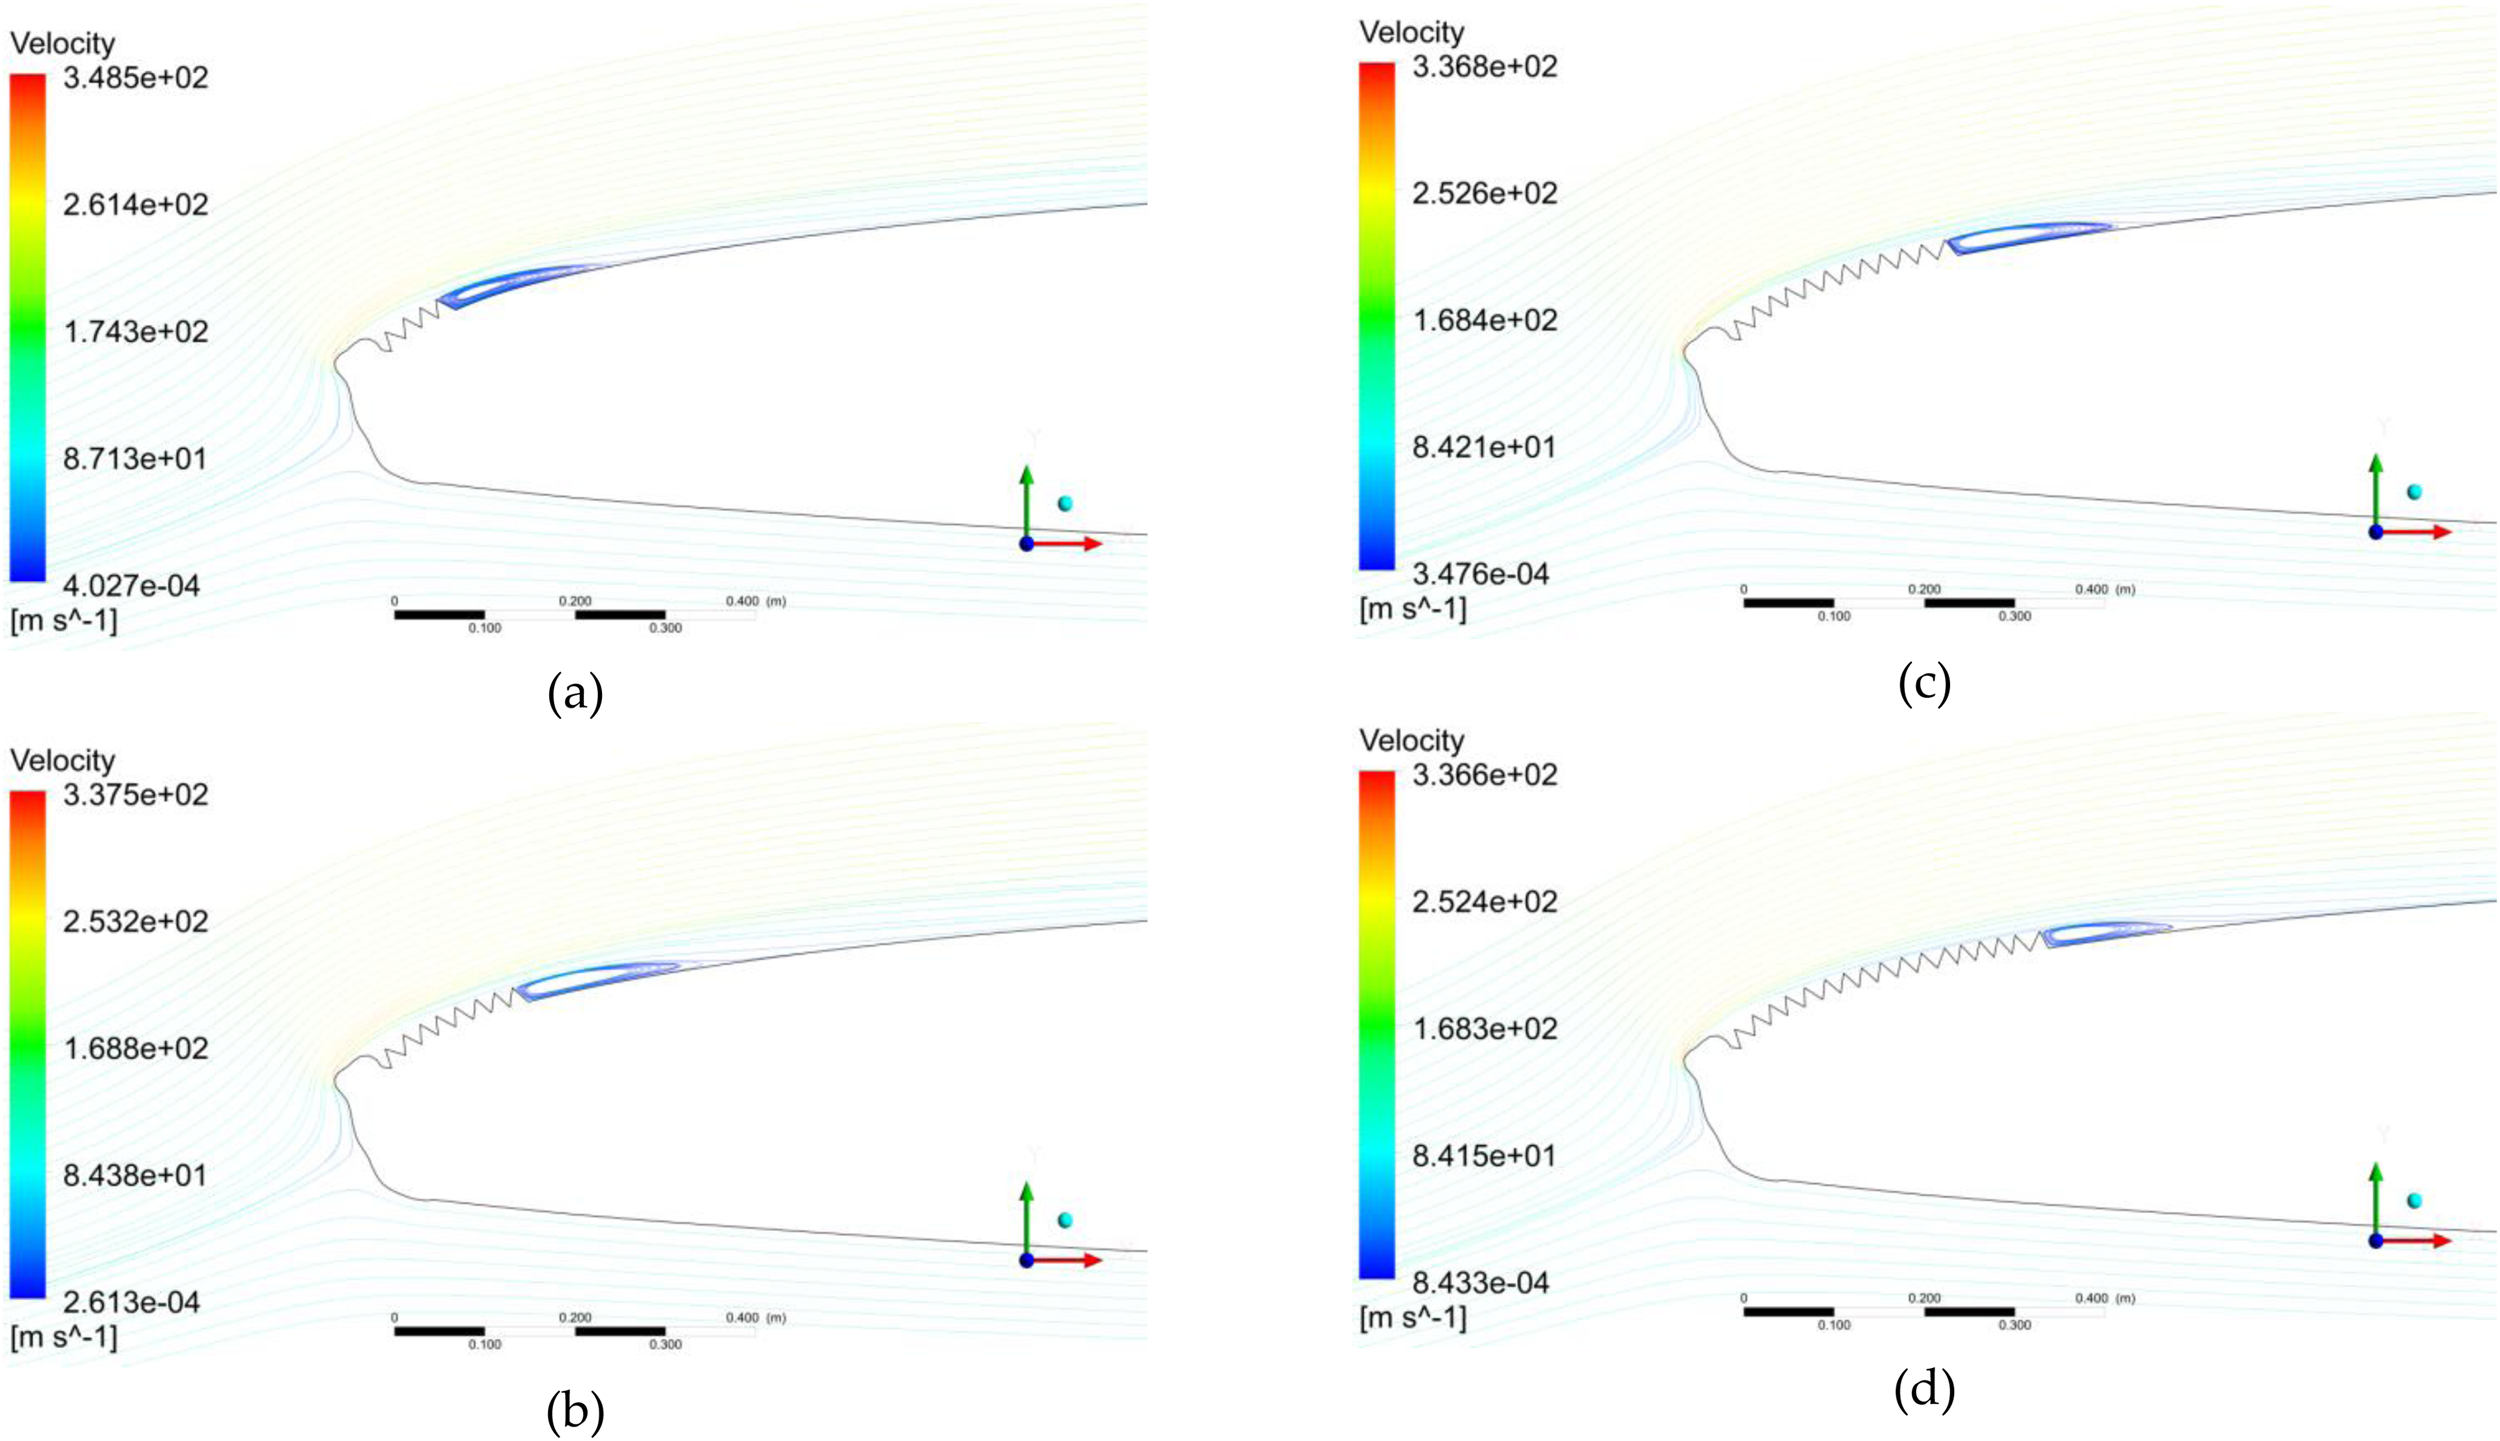
Streamlines for different ranges of 20 mm plume ice at AOA = 4°. (a) Range 1 with plume ice; (b) range 2 with plume ice; (c) range 3 with plume ice; (d) range 4 with plume ice.
When the plume ice after the horn ice approaches or even exceeds the horn ice, the separating vortex caused by the plume ice exceeds the separation vortex caused by the horn ice, which leads to the deterioration of aerodynamic characteristics.
High-lift airfoil
As shown in Figure 18, when there is plume ice on the main wing, it corresponds to the presence of ice ridges on the upper airfoil surface of the main wing,16,17,19,20 which will generate separation vortex on the upper surface of the main wing. It will lead to a decrease in the lift coefficient on the upper surfaces of the slat, main wing and particularly the flap, resulting in a sharp decrease in the lift coefficient (In the Figure 19, the roughness in “roughness_R5_4” denotes the plume ice. R5 in “roughness_R5_4” denotes the height of the plume ice is 5 mm. 4 in “roughness_R5_4” denotes the upper surface of full slat and part of main wing is with plume ice). It can be noticed that at a plume ice height of 10 mm, there is a big separation vortex on the entire upper surface of the main wing.

Streamlines of the high-lift airfoil with plume ice on the main wing at AOA = 10°. (a) Only the horn ice; (b) horn ice and 5 mm plume ice; (c) horn ice and 10 mm plume ice; (d) horn ice and 20 mm plume ice; (e) horn ice and 40 mm plume ice.

Cp of the high-lift airfoil with plume ice on the main wing at AOA = 10°. “roughness_RXX_N” indicating that the ice in this case is with plume ice, and the height of plume ice is XXmm, and the range of plume ice is N.
Conclusion
The SLD ice is characterized by the horn ice with the plume ice. The aerodynamic characteristics of the cruise and high-lift airfoils of different chord lengths with different SLD ice shapes are calculated. Compared to the normal droplet ice, it is found that the cruise configuration is not sensitive to the range of the plume ice when the height of the plume ice is less than the height of the horn ice. However, the aerodynamic characteristics deteriorate significantly when the height of plume ice approaches or exceeds the horn ice. The high-lift airfoil is not sensitive to the height of the plume ice. However, the aerodynamic characteristics deteriorate significantly when there is ice on the main wing. When there is no plume ice on the main wing, it is also insensitive to the range of plume ice.
Consider that the source of the plume ice is the secondary attachment of splash and rebound droplets from large droplets that hit the leading edge of the wing. The collection efficiency of droplets after the horn ice is smaller than the leading-edge area, which makes the height of the plume ice be smaller than the horn ice. Therefore, for modern transport aircraft, the main threat to the SLD ice is whether the splash and bounce of water droplets will produce ice accumulation on the upper surface of the main wing.
Footnotes
Author contributions
Conceptualization and methodology, Y.J.; methodology, X.H.; resources and data curation, Z.H; writing—original draft preparation, X.H.; writing—review and editing, F.Z.; writing—review and editing, L.H.; supervision, Y.C.; project administration, Y.C.; funding acquisition, Y.C. All authors have read and agreed to the published version of the manuscript.
Funding
This research was funded by the National Key R&D Program of China (Project No. 2020YFA0712000).
Declaration of conflicting interests
The authors declared no potential conflicts of interest with respect to the research, authorship, and/or publication of this article.