
Abstract
Objective
This study sought to explore the association of magnesium (Mg) status and blood glucose control, represented by Mg depletion score (MDS) and hemoglobin A1c (HbA1c) level, respectively, with the risk of diabetic retinopathy (DR) among type 2 diabetes mellitus (T2DM) patients, and whether there were interactions between Mg status and blood glucose control on the risk of DR.
Methods
Data of this cross-sectional study were extracted from the National Health and Nutrition Examination Surveys (NHANES) database 2005–2018. MDS was an indicator to assess the overall Mg status in the human body that considers the pathophysiological factors influencing the kidneys’ reabsorption capability. Blood glucose control was represented by hemoglobin A1c (HbA1c) and HbA1c level ≥7% referred to poor blood glucose control. Receiver Operating curve (ROC) analysis was performed to evaluate the predictive performance of MDS and HbA1c for DR. Weighted univariate and multivariate analyses were utilized to explore the MDS and HbA1c and their interactions effects on the risk of DR, with odds ratios (ORs), 95% confidence intervals (CIs), relative excess risk due to interactions (RERI) and attributable proportion due to interactions (AP). These interactions were further explored based on the age, gender, and cardiovascular disease (CVD) history.
Results
A total of 4487 T2DM patients were included, of whom 942 (20.99%) had DR. After covariate adjustment, both high MDS (≥2) and elevated HbA1c levels (≥7%) demonstrated significant independent associations with increased DR risk. ROC analysis showed MDS (AUC = 0.766) and HbA1c (AUC = 0.749) in fully adjusted models. Significant interactions between MDS and HbA1c amplified DR risk beyond individual effects, with this pattern most pronounced among female patients, those aged ≥60 years, and individuals with a cardiovascular disease history.
Conclusions
The results of this study suggested that high MDS as well as high HbA1c level may have interaction effects on the high risk of DR among T2DM patients.
Keywords
Introduction
Globally, diabetes mellitus (DM) is a major challenge of public health. It is estimated by the International Diabetes Federation that the prevalence of DM will be anticipated to rise to 700.2 million (10.9%) before 2045, 1 of which 90% cases are type 2 DM (T2DM). 2 T2DM is a complex metabolic condition related to a plethora of complications in peripheral organs. Diabetic retinopathy (DR), caused by microvascular injury, is a common complication of T2DM and has become the main cause of vision disorders or even blindness among adults worldwide. 3 Almost 20% of DM patients have DR at the time of diagnosis with DM and overall 40%–45% of the DM patients develop retinopathy during the course of DM. 4 Hence, positive identification and intervention of the modifiable factor for DR is of great significance to reduce the disease burden of DR to the public health-care systems.
Previous studies explored the risk correlated to DR, in addition to the common risk factors including blood glucose, blood fat, smoking and body mass index (BMI), 5 recent studies suggested that several microelements also correlated with DR, notably magnesium (Mg).6,7 Mg is an essential microelement that plays a vital role in maintaining normal nerve, cardiac excitability, neuromuscular conduction, and glucose and insulin metabolism.8,9 Clinically, serum Mg is often used to assess Mg shortage, however, it may not accurately represent whole body Mg status. The kidneys ultrafilter and reabsorb over 80% of serum Mg, which plays a vital role in maintaining Mg homeostasis. 10 Thus, Mg depletion score (MDS) as a complex indictor was proposed to evaluate Mg shortage status with taken into account the pathophysiological factors influencing the kidney's reabsorption capability. 11 Fan et al. 11 suggested that MDS is more sensitive and reliable than other Mg clinical prediction indicators.
Mg involves in more than 300 enzymatic reactions in the human body, and regulates several biochemical reactions including blood glucose control. 12 In pancreatic β-cells, Mg serves as an essential cofactor for glucokinase, participating in glucose phosphorylation and thereby regulating insulin secretion. Mg also regulates the activity of KATP channels by binding to the SUR1 subunit, affecting membrane depolarization and L-type calcium channel opening, thereby promoting insulin release. In insulin signaling pathways, magnesium participates in the phosphorylation of insulin receptor tyrosine kinase (IRTK), activating insulin receptor substrates (IRS) and downstream phosphatidylinositol 3-kinase (PI3K) and protein kinase B (Akt), thereby regulating glucose uptake and metabolism. 13 Therefore, the effect of Mg on DM and its complications may also be influenced by the patients’ blood glucose control. Wang et al. 14 found the interactions effect on the Mg intake and blood glucose control with the prognosis of DM patients. Chen et al. 15 explored the association between MDS and DR, however, the potential effect of blood glucose control is not considered.
Herein, based on the National Health and Nutrition Examination Surveys (NHANES) database, the purpose of the present study is to explore the association of single MDS and blood glucose control and their interaction effects on the risk of DR.
Methods
Study design and participants
Data of this cross-sectional study were extracted from the NHANES 2005–2018, a representative cross-sectional survey of the non-institutionalized civilian population in the United States. NHANES is a major project of the National Center for Health Statistics (NCHS), affiliated with the Centers for Disease Control and Prevention (CDC), and aims to assess health and nutritional information for the U.S. civilian population. This survey used complex, multistage, probability sampling methods based on broad population distributions. This survey received approval from the National Center for Health Statistics Research Ethics Review Board, and all subjects signed informed consent forms. The reporting of this study conforms to STROBE guidelines. 16
The inclusion criteria were: (1) patients with T2DM; (2) patients aged ≥20 years old. The exclusion criteria were: (1) missing retinopathy testing information; (2) missing HbA1c examination; (3) missing data required for complete MDS calculation; (4) severe renal impairment [estimated glomerular filtration rate (eGFR) < 15 ml/min/1.73 m2] 17 ; (5) using anti-angiogenic ophthalmic agents and ophthalmic steroids; (6) gastrointestinal disorders known to affect magnesium absorption, including celiac disease, inflammatory bowel disease, or history of gastric bypass surgery; (7) primary intestinal hypomagnesemia or other inherited magnesium metabolism disorders; (8) current use of medications causing excessive magnesium loss, including aminoglycosides, certain chemotherapeutic agents, and high-dose loop diuretics (beyond those captured in the MDS calculation).
Definition of T2DM and Dr
Based on the Standards of Medical Care in Diabetes, T2DM was defined as fasting blood glucose ≥7.0 mmol/L or hemoglobin A1c (HbA1c) ≥ 6.5%, or diagnosed as DM by the clinician or confirmed to be taking insulin or hypoglycemic agent. 18 DR was classified as subjects who responded “yes” to the question “Diabetes affected eyes/had retinopathy.” Blood glucose control was classified as either good (HbA1c < 7%) or poor (HbA1c ≥ 7%). 19
MDS calculation
MDS was an indicator calculated to assess the total body Mg status as described in previous study. 11 Briefly, MDS was calculated as the sum of the following 4 factors: (1) current use of diuretics was scored 1 point; (2) current use of proton pump inhibitor (PPI) was scored 1 point; (3) 60 ml/min/1.73 m2 ≤eGFR <90 ml/min/1.73 m2 was scored 1 point, or eGFR <60 ml/min/1.73 m2 was scored 2 points; and (4) heavy drinking (>1 drink/d for women and >2 drink/d for men) was scored 1 point. 11 In present study, MDS was further divided into two categories for ease of analysis and application with a cutoff value of 2 point based on previous studies. 20
Potential covariates
The present study utilized a variety of covariates, including demographic and lifestyle characteristics [age, gender, ethnicity, education level, poverty-to-income ratio (PIR), physical activity, smoking and drinking], treatments (diuretic, PPI, anti-angiogenic ophthalmic agents, ophthalmic steroids, antidiabetic agents, antihyperlipidemic agents and antihypertensive agents), physical examination [height weight, BMI, systolic blood pressure (SBP) and diastolic blood pressure (DBP)], complications [hypertension, diabetes, dyslipidemia, cardiovascular disease, chronic kidney disease (CKD) and duration of diabetes] and laboratory value [calcium, vitamin D, high density lipoprotein-cholesterol (HDL-C), low-density lipoprotein-cholesterol (LDL-C), total cholesterol (TC), triglyceride (TG), fasting plasma glucose (FPG), HbA1c, creatinine and eGFR].
PIR was categorized as <1.3 (insufficient income), ≥ 1.3 (sufficient income) or unknown by the federal poverty level (FPL). 21 Smoking was defined as former smoker (smoking more than 100 cigarettes in life but quit now), current smoker (smoking more than 100 cigarettes in lifetime and still smoking now) and never smoker (smoking less than 100 cigarettes in lifetime). Physical activity was expressed as the metabolic equivalent task (MET) and calculated as the following formula: physical activity (met·min/week) = recommended MET × exercise time for corresponding activities (min/day) × the number of exercise days per week (day). 22 Hypertension was defined as SBP ≥130 mmHg or DBP ≥80 mmHg or self-reported condition or taking anti-hypertension medication. 23 Dyslipidemia was defined as TC ≥200 mg/dL (5.2 mmol/L), TG ≥150 mg/dL (1.7 mmol/L), LDL-C ≥ 130 mg/dL (3.4 mmol/L), HDL-C ≤ 40 mg/dL (1.0 mmol/L), self-reported condition or receiving lipid-lowering therapy. 24 Cardiovascular disease (CVD) history was assessed by the question “Have you ever been told you had (congestive) heart failure, coronary heart disease, angina/angina pectoris, heart attack or stroke?” CKD was defined as urine albumin-to-creatinine ratio (UACR) > 30 mg/g or eGFR <60 ml/min/1.73 m2. 25 Duration of diabetes was assessed by the question “How old were you when a doctor or other health professional first told you that you had diabetes or sugar diabetes?”
Statistics analysis
The measurement data was described as mean and standard error (S.E.), and a weighted unpaired t-test was used for comparison between groups. Categorical variables were expressed as the number and percentage [n (%)], and comparisons between groups used the Rao-Scott Chi-square test. Sensitivity analyses were conducted to compare whether the results were different before and after imputation of missing variables (Table S1). To evaluate the predictive performance of MDS and HbA1c for DR, receiver operating characteristic (ROC) curve analysis was performed for each indicator, respectively. The area under the curve (AUC) was calculated to assess the overall discriminative ability of MDS, with corresponding 95% confidence intervals. The weighted univariable and multivariable logistics regression models were utilized to explore the association of single MDS and HbA1c and their interaction effects on the risk of DR, with odds ratios (ORs), 95% confidence intervals (CIs), relative excess risk of interaction (RERI), and attributable proportion due to interaction (AP). The interaction measures RERI and AP employed in this analysis represent statistical interactions on the additive scale, reflecting the mathematical departure from additivity in risk estimates when both exposures are present simultaneously. Model 1 was a crude model without adjusting any covariates. Model 2 adjusted common demographic covariates, including age, gender, race, and education level. In addition to the above covariates, model 3 also adjusted for PIR, physical activity, duration of diabetes, calcium level, and vitamin D level. Subgroup analyses were further conducted to explore whether these interaction effects were robust stratified by age, female, and cardiovascular disease (CVD) history.
All statistical analyses were performed by SAS 9.4 (SAS Institute Inc., Cary, NC, USA). The final sample size was weighted with SDMVPSU, SDMVSTRA, and WTMEC2YR. Differences were considered statistically significant when the two-sided P-value <0.05.
Results
Characteristics of T2DM
The recruitment process is shown in Figure 1. Totally, 7418 T2DM patients aged ≥20 years old were extracted. Among them, 2338 patients missing retinopathy assessment information, 414 patients missing HbA1c measurement information, 120 patients missing complete MDS calculation information, 41 patients with renal failure, and 18 patients using anti-angiogenic ophthalmic agents and ophthalmic steroids were excluded. Finally, 4487 T2DM patients were included, of whom 942 (20.99%) had DR. The characteristics of the study patients were listed in Table 1. The proportion of patients with high MDS (≥2) in the DR group was significantly higher than in the non-DR group (44.43% vs. 33.78%), and the proportion of patients with poor blood glucose control (HbA1c ≥ 7%) in the DR group was also higher than in the non-DR group (60.73% vs. 45.58%). The differences were found in the level of education, PIR, physical activity, calcium, vitamin D, MDS and HbA1c, the history of CVD and CKD, duration of diabetes, and intake of calcium between DR and non-DR groups.

Flowchart of study participant selection from NHANES.
Demographic and clinical characteristics of study subjects.

Note: SE: standard error; t: weighted t test; χ²: chi-square test; DR: diabetic retinopathy; PIR: poverty-to-income ratio; met: metabolic equivalent; CVD: cardiovascular disease; CKD: chronic kidney disease; BMI: body mass index; PPI: proton pump inhibitor; eGFR: estimated glomerular filtration rate; MDS: magnesium depletion rate; HbA1c: hemoglobin A1c.
MDS, HbA1c, and the risk of DR
Three logistics regression models were utilized to explore the single MDS and HbA1c with the risk of DR, as presented in Table 2. In the fully adjusted model, poor glycemic control (HbA1c ≥ 7%) was associated with elevated DR risk, while high MDS (≥2) similarly exhibited significant risk increase, establishing both parameters as independent predictive factors.
Association between HbA1c, MDS, and the risk of DR.
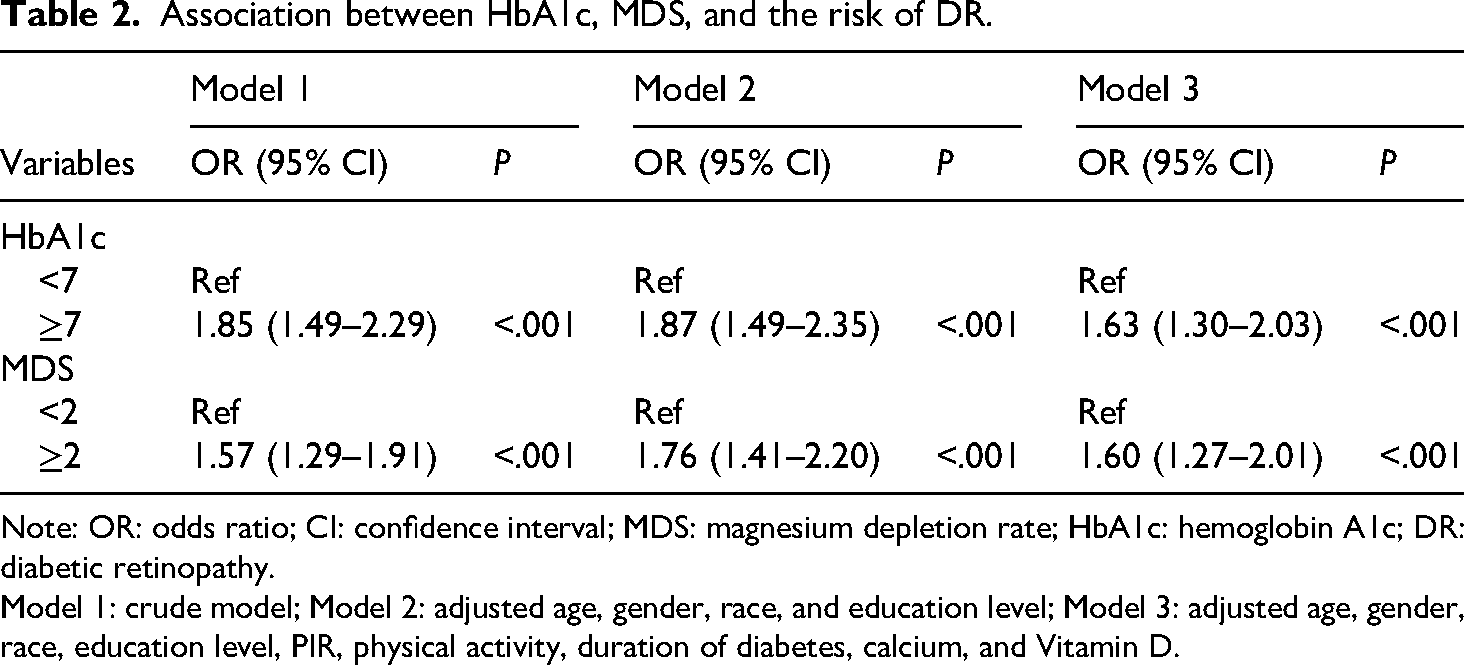
Note: OR: odds ratio; CI: confidence interval; MDS: magnesium depletion rate; HbA1c: hemoglobin A1c; DR: diabetic retinopathy.
Model 1: crude model; Model 2: adjusted age, gender, race, and education level; Model 3: adjusted age, gender, race, education level, PIR, physical activity, duration of diabetes, calcium, and Vitamin D.
ROC curve analysis for MDS and HbA1c
ROC curve analysis was performed to evaluate the predictive performance of MDS and HbA1c for DR across different adjustment models (Figure 2). The discriminative ability of MDS improved with model adjustment (Figure 2(a)). Model 1 (crude analysis) yielded an AUC of 0.746, which remained stable in Model 2 following demographic covariate adjustment. The fully adjusted Model 3 achieved performance with an AUC of 0.766, demonstrating clinically meaningful sensitivity (68.4%) and specificity (72.6%) at the cut-off value of ≥2. Similarly, HbA1c exhibited consistent discriminative performance across all adjustment models (Figure 2(b)). Model 1 demonstrated an AUC of 0.728, with minimal variation observed in Model 2 (AUC = 0.729). The fully adjusted Model 3 achieved an AUC of 0.749, with optimal cut-off performance at ≥7% yielding sensitivity of 65.7% and specificity of 74.3%.

ROC analysis for MDS and HbA1c in predicting DR risk.
Interaction effects of MDS and HbA1c on the risk of DR
Then, we explored whether there were interaction effects of MDS and HbA1c on the risk of DR. As shown in Table 3, after covariate adjustment, patients with both high MDS and elevated HbA1c levels demonstrated significantly amplified DR risk compared to those with optimal levels of both parameters, indicating significant additive interactions.
Interaction effect of HbA1c and MDS on the risk of DR.

Note: OR: odds ratio; CI: confidence interval; Ref: reference; RERI: relative excess risk due to interaction; AP: attributable proportion due to interaction; MDS: magnesium depletion rate; HbA1c: hemoglobin A1c; DR: diabetic retinopathy.
Model 1: crude model; Model 2: adjusted age, gender, race, and education level; Model 3: adjusted age, gender, race, education level, PIR, physical activity, duration of diabetes, calcium, and Vitamin D.
Interaction effect of MDS and HbA1c on the risk of DR based on age, gender, and CVD history
Subgroup analysis was conducted to further explore the interaction effects of MDS and HbA1c on the risk of DR (Table 4). After adjusting all covariates, interactions between magnesium depletion and poor glycemic control exhibited particular significance among elderly patients (≥60 years), female subjects, and individuals with established cardiovascular disease.
Subgroup analysis of the interaction effect of HbA1c and MDS on DR risk by age, gender, and CVD history.
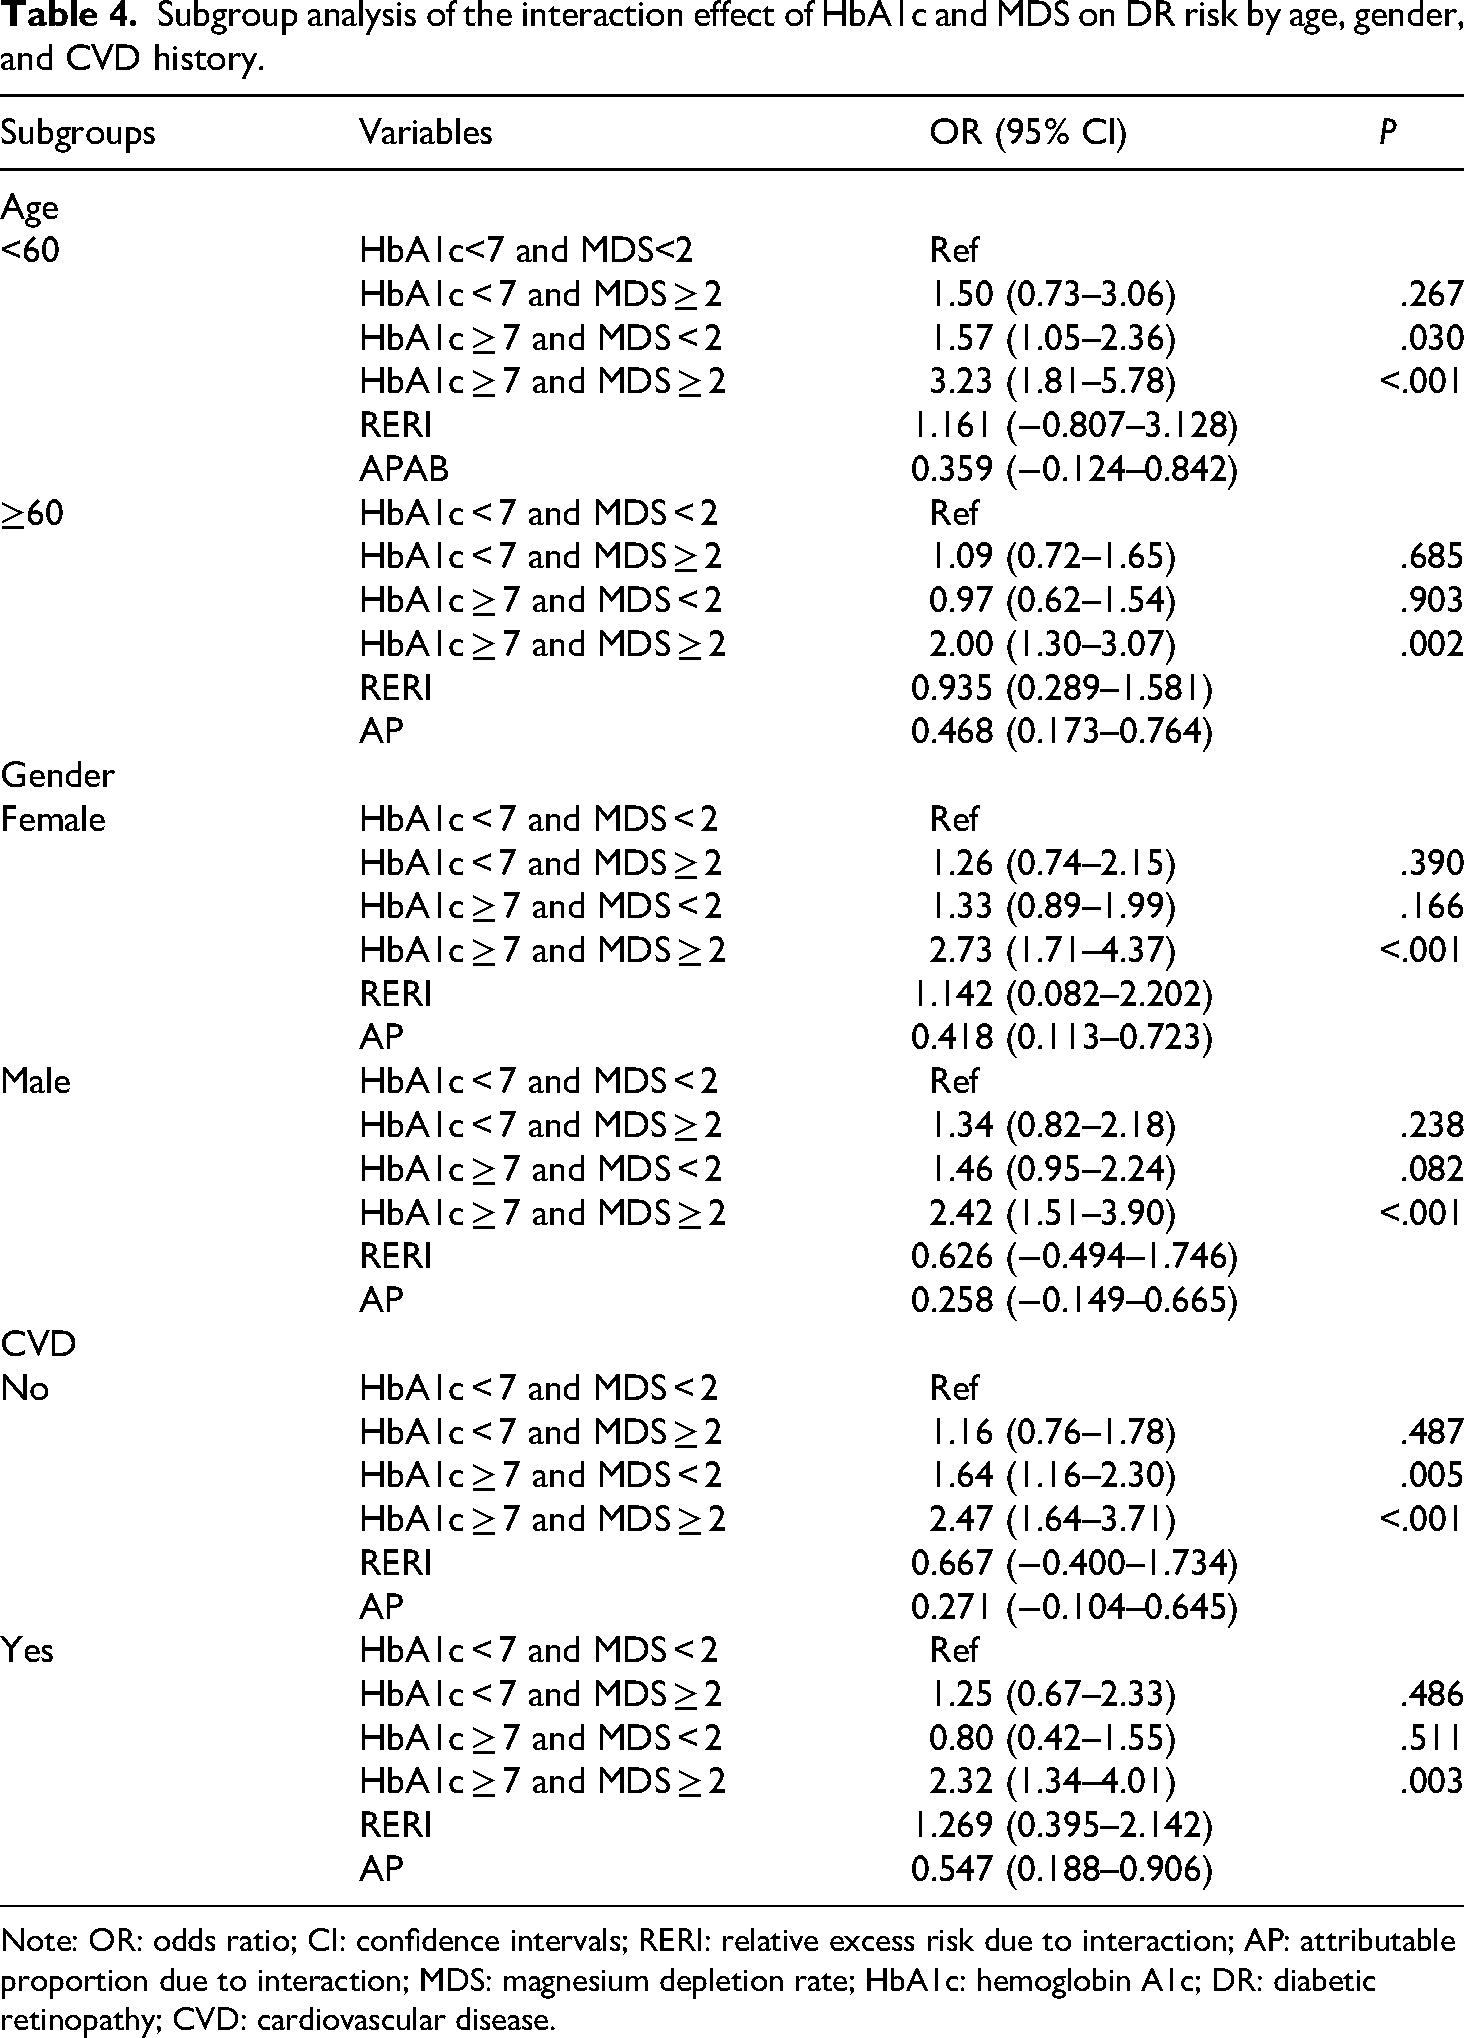
Note: OR: odds ratio; CI: confidence intervals; RERI: relative excess risk due to interaction; AP: attributable proportion due to interaction; MDS: magnesium depletion rate; HbA1c: hemoglobin A1c; DR: diabetic retinopathy; CVD: cardiovascular disease.
Discussion
In this study, we examined the association between MDS and blood glucose control, as indicated by HbA1c, with the risk of DR among patients with T2DM. The results indicated that both high MDS, which reflects magnesium deficiency, and elevated HbA1c, which represents poor blood glucose control, are independently associated with an increased risk of DR. Moreover, the interaction between MDS and HbA1c amplifies the risk of DR compared to when both parameters are at lower levels. This interaction effect was found to be especially prominent among patients aged ≥60 years, females, and those with a history of cardiovascular disease. The ROC analysis further showed the predictive value of both MDS and HbA1c for DR risk, with AUC values of 0.766 and 0.749, respectively, indicating good discriminative performance. This underscores the potential clinical utility of these markers as screening tools for identifying T2DM patients at higher risk for developing DR.
Mg is the second most abundant intracellular cation and plays a vital role in numerous biological reactions, including insulin secretion and insulin resistance. 26 Hypomagnesemia refers to serum Mg2+ < 0.7 mmol/L, and its prevalence in T2DM has been observed to vary between 11% and 47.7% globally. 27 It has been suggested that a low-grade inflammation triggered or exacerbated by Mg deficit may support cluster formation. Therefore, a low Mg status is highly prevalent in several complications of diabetes characterized by a chronic inflammatory component. 13 Mg deficiency elevates oxidative stress by reducing the activity of antioxidant enzymes, such as superoxide dismutase and glutathione peroxidase, which results in increased levels of reactive oxygen species (ROS) and the upregulation of endothelial differentiation factor-1 (EDF-1). 28 Furthermore, Mg deficiency promotes lipid accumulation in endothelial cells through the upregulation of PPARγ and EDF-1, reduces nitric oxide (NO) synthesis by impairing endothelial nitric oxide synthase (eNOS) activity, and activates the NF-κB signaling pathway. 28 Thereby, this deficiency can exacerbate vascular dysfunction through increased inflammatory reaction.
Previous studies have investigated the association of Mg and DR, with most relying on serum Mg levels to reflect systemic Mg status. However, the results have been inconclusive. A retrospective study of Xing et al. 7 explored the relationship between serum Mg level and DR in T2DM patients and found no matter whether the interference of covariates, low serum Mg level remained associated with the risk of DR in T2DM patients independently. Meta-analyses by Veronese et al. 29 and Tan et al. 30 found that oral Mg supplements significantly reduced fasting blood glucose levels in diabetes patients and gestational diabetes patients, and improved insulin sensitivity. These findings were consistent with our findings, although we used MDS for assessing systemic Mg levels instead of serum Mg concentration. Xu et al. 6 explored that serum Mg levels were higher in patients with DR than in those patients without DR, which was inconsistent with our study. However, the study had a small sample size, with only 34 DR patients, and its conclusions may have certain biases and limited generalizability. Serum Mg accounts for approximately 1% of the total Mg level in the human body, although serum Mg level can be used for the medical diagnosis of severe Mg deficiency, directly measured serum Mg level does not represent the overall Mg status reliably because it lacks consideration of the vital role of renal reabsorption in maintaining Mg homeostasis. 31 MDS, an indicator of measuring Mg shortage that took the pathophysiological factors influencing the kidney's reabsorption capability into consideration, was proposed and has been proven to be associated with diseases related to Mg deficiency. 11 Wang et al. 32 reported that higher urinary Mg loss as quantified by MDS may be an independent linear risk factor for metabolic syndrome in US adults. Therefore, this study chose to assess the association between magnesium and DR through MDS, and the results showed that MDS ≥ 2 was an independent risk factor for DR occurrence in T2DM patients. This conclusion is similar to the results of multiple previous studies. For example, Tian et al. 20 found that in populations with MDS ≥ 2, the diabetes prevalence ratio was 1.26, suggesting that adequate dietary magnesium intake may reduce diabetes risk. Chen et al. 15 explored the association between MDS and the risk of DR and found that there is an adverse association between MDS and DR risk. Similarly, Zhang et al. 33 also found that elevated MDS was associated with increased all-cause mortality and cardiovascular mortality in diabetes patients. Altogether, this study and previous research provide insight into the effects of Mg in the prevention and treatment of T2DM or diabetic complications.
Recent studies reported that several microelements, especially Mg, have a protective role against insulin resistance. Mg acts in the insulin secretion by pancreatic β-cells and participates in the signaling pathway in peripheral tissues. 34 Moreover, insulin can regulate the balance of Mg ions, and Mg is also an important factor in insulin signal transduction. 13 To this extent, the effect of Mg on the risk of DR may also be potentially influenced by the blood glucose control of T2DM patients. Hence, our study further explored the association of Mg status and the risk of DR with good and poor blood glucose control, and explored whether there was an interaction between Mg status and blood glucose control on the risk of DR. As consistent with the findings of Chen et al., 15 we found that high MDS was related to high DR risk; moreover, high HbA1c, which represents the poor blood glucose control status, was also associated with high DR risk. A randomized, controlled trial of EL Derawi et al. 26 reported revealed that oral Mg supplementation reduces insulin resistance and improves the blood glucose control indicators among T2DM patients. The effect of sufficient Mg on good blood glucose control can be explained by the following mechanism: Mg as a calcium antagonist and inhibits calcium-induced cell death. The intracellular calcium level increased may act a pathogenic role in insulin resistance syndrome and trigger cell death. In addition to the insulin sensitivity, the improvement effect of Mg on the blood glucose control may also be associated with Mg facilitating the translocation of glucose transporter number 4 (GLUT 4) to the cell membrane. 35 Notably, in this study, interactions described by RERI and AP were also observed for MDS and HbA1c on the risk of DR, with findings consistent with previous research. Although we have discussed the potential biological mechanisms underlying these associations, it is essential to emphasize that the observed interaction effects between MDS and HbA1c represent statistical interactions on the additive scale rather than direct biological mechanistic interactions at the cellular or molecular level. Future mechanistic studies will be necessary to uncover the underlying biological pathways.
The findings suggest that MDS may serve as a practical screening tool for identifying T2DM patients at elevated risk for DR, particularly given its superior performance compared to traditional serum magnesium measurements. The implementation of MDS-based risk stratification could inform targeted prevention strategies in diabetic care, potentially enabling earlier intervention through magnesium optimization and enhanced glycemic monitoring in high-risk populations. These results support the integration of MDS assessment into routine diabetic management protocols, offering clinicians an accessible biomarker for retinopathy risk assessment that complements existing glycemic control measures.
Several limitations need caution in interpreting our findings. The cross-sectional study design limits our ability to establish causal relationships or determine temporal sequence between Mg status, blood glucose control, and DR development. Another methodological limitation involves DR diagnosis, which relied on self-reported questionnaire responses rather than standardized ophthalmologic examination or retinal photography. This methodology introduces potential for misclassification bias, as patients may be unaware of asymptomatic early-stage retinopathy or may inaccurately report their condition, potentially leading to both false-positive and false-negative classifications that could bias observed associations. Additionally, self-reporting cannot distinguish retinopathy severity stages, differentiate DR from other retinal pathologies such as hypertensive retinopathy, or classify proliferative versus non-proliferative forms. The dichotomization of both HbA1c and MDS may introduce another analytical limitation, as while these thresholds reflect established clinical guidelines and previous research applications, respectively, alternative cut-points were not evaluated in our analysis. Different threshold selections could potentially alter the effect magnifications and the statistical significance of observed associations. Additional study variables obtained through NHANES questionnaires, including complication history, physical activity, and dietary intake, may have introduced reporting bias similar to the retinopathy classification issue. Finally, as NHANES represents the US population, the generalizability of observed interactions between Mg status and blood glucose control on DR risk among other populations requires exploration through further large-scale prospective studies capable of establishing temporal relationships and addressing the methodological limitations identified in this cross-sectional analysis.
Conclusion
This cross-sectional investigation demonstrates associations between elevated MDS and HbA1c level with DR risk among T2DM patients. However, the observational and cross-sectional design precludes the establishment of temporal relationships or causal inference between these variables. Future longitudinal cohort studies are needed to establish temporal relationships and causality between magnesium status, glycemic control, and DR progression. Randomized controlled trials investigating magnesium supplementation combined with intensive glycemic management could provide valuable evidence for clinical practice. These findings may inform the development of comprehensive prevention strategies that address both micronutrient optimization and glycemic control in diabetic care.
Supplemental Material
sj-docx-1-sci-10.1177_00368504251392701 - Supplemental material for Blood glucose control, magnesium status, and diabetic retinopathy in patients with type 2 diabetes mellitus: Evidence from NHANES 2005–2018
Supplemental material, sj-docx-1-sci-10.1177_00368504251392701 for Blood glucose control, magnesium status, and diabetic retinopathy in patients with type 2 diabetes mellitus: Evidence from NHANES 2005–2018 by Liping Gu, Song Jia and Juan Chen in Science Progress
Footnotes
Ethical approval
Ethical approval was not provided for this study on human participants because NHANES is a publicly available dataset. The patients provided their written informed consent to participate in this study. According to the Ethics Review Board of Suzhou Eye Hospital, retrospective cohort studies have been exempted from ethical review.
Author contributions
Liping Gu designed the study, Liping Gu wrote the manuscript, Juan Chen collected, analyzed, and interpreted the data, Song Jia critically reviewed the manuscript, and all authors read and approved the manuscript.
Funding
The authors received no financial support for the research, authorship, and/or publication of this article.
Declaration of conflicting interests
The authors declared no potential conflicts of interest with respect to the research, authorship, and/or publication of this article.
Data availability statement
Ethical approval was not provided for this study on human participants because NHANES is a publicly available dataset; this data can be found here: NHANES, NHANES Questionnaires, Datasets, and Related Documentation (cdc.gov).
Supplemental material
Supplemental material for this article is available online.
References
Supplementary Material
Please find the following supplemental material available below.
For Open Access articles published under a Creative Commons License, all supplemental material carries the same license as the article it is associated with.
For non-Open Access articles published, all supplemental material carries a non-exclusive license, and permission requests for re-use of supplemental material or any part of supplemental material shall be sent directly to the copyright owner as specified in the copyright notice associated with the article.