
Abstract
With the continuous reduction of cultivated land in China, this study aims to develop a comprehensive monitoring system to support sustainable cropland management in complex terrains. Yanshan city in Jiangxi Province was selected as the study area to address the challenges of large-scale cropland, complex terrain, and fragmented land parcels. Twenty scenes of Sentinel-1A imagery collected between 26 October 2022 and 24 May 2024 were utilized for ground subsidence analysis using SBAS-InSAR techniques. Sentinel-2 imagery was used for supervised classification, achieving an overall accuracy of 81.43% and a Kappa coefficient of 0.7833. Cropland exhibiting significant subsidence was identified through overlay analysis to inform field verification. To enable unified management and analysis of multi-source data, a conceptual E–R model was implemented in PostgreSQL/PostGIS and transformed into an object-relational spatial database, integrating unmanned aerial vehicle imagery, light detection and ranging point clouds, Sentinel-1 stacks, and obstacle factors. The system provides user management, point cloud-to-3D-Tiles conversion, and high-precision Global Navigation Satellite System support. Preliminary tests confirmed the framework's reliability and operational feasibility. The novelty lies in integrating multi-source remote sensing, geospatial analysis, and spatial database technology into a scalable, parcel-centered framework for complex agricultural landscapes, supporting cultivated land protection and land-use-change monitoring.
Introduction
In the face of dual pressures from global climate change and increasing population growth, the safeguarding and prudent management of cultivated land resources have emerged as paramount priorities. 1 Especially in the complex landscapes of hilly regions, where the terrain is rugged, cropland parcels are fragmented, and planting types are diverse, the task of monitoring cultivated land changes and planting attributes poses significant challenges. These efforts often struggle with difficulties, incompleteness, and a notable lack of automation, necessitating innovative solutions. Due to its extensive coverage, rapid data acquisition cycles, and vast informational capacity, remote sensing technology has gained widespread adoption in cultivated land monitoring, vigorously advancing the holistic “trinity” protection—safeguarding land quantity, preserving quality, and nurturing ecology. 2 Zhou et al. reported a case study in the hilly regions of southern China, where multi-source remote sensing data—including satellite imagery, UAV (unmanned aerial vehicle) imagery, and cadastral data—were integrated for cultivated land monitoring, achieving an accuracy exceeding 85%. 3 To specifically address the challenges of fragmented and steep terrains, our approach integrates satellite, UAV, and LiDAR (light detection and ranging) data within a spatial database framework tailored for highly fragmented and steeply sloped plots, enabling more automated and scalable analysis than standard multi-source monitoring. Traditional monitoring relies on ground surveys, which are inefficient in hilly areas, and conventional data management cannot effectively handle complex spatial objects, motivating advancements in spatial database research.4–6 Given these data-intensive demands, spatial databases provide a technological foundation to bridge large-scale remote sensing data acquisition and efficient information management.7–9 They support integration, querying, and analysis of multi-source geospatial datasets, enabling advanced applications in cultivated land monitoring.
The proven success of spatial databases in other sectors offers insights for designing effective solutions. Spatial databases have been applied in diverse domains, including tourism and healthcare, as well as agriculture and environmental monitoring. For instance, Li et al. utilized SQL Server to design a structured tourism resource database, 10 while Hu developed a MySQL-based scientific research information management system. 11 Guo et al. established a spatial database for monitoring building comfort and safety. 12 In geospatial applications, Yin et al. implemented a desert geospatial database using ArcGIS Geodatabase, 13 and He et al. combined ArcGIS, SQL Server, and .NET technology to establish a comprehensive mountain ecological resource database. 14 Similarly, Jin et al. created an archaeological site database based on the ArcGIS Geodatabase model, 15 Li et al. designed an agricultural production base database using ArcSDE, 16 and Li et al. built a traditional village cultural landscape database using the ArcGIS platform. 17 The technology also plays a crucial role in thematic agricultural and natural resource management: Zhao developed a cultivated land resource spatial database leveraging Oracle Spatial, 18 Wang designed a remote sensing geological spatial database, 19 Xu et al. implemented a hydrological ecology database, 20 and Liu et al. proposed a spatial database framework for large-scale cultural heritage protection. 21 Moreover, recent studies have highlighted the effective integration of SAR auxiliary data into GIS applications, which not only improves spatial coverage and monitoring accuracy but also further extends the applicability of spatial databases in land resource management.22,23 Collectively, these studies demonstrate the versatility and scalability of spatial database technologies in managing complex spatial datasets across diverse sectors.
Despite these advancements, existing systems for cultivated land monitoring in hilly regions remain fragmented and lack scalability. Prior studies have focused on flat agricultural areas, single-source data, or frameworks insufficiently tailored to the unique challenges of steep, fragmented terrains. These gaps underscore the need for a database-driven monitoring system capable of fully integrating multi-source remote sensing data for hilly landscapes.
The main contributions of this work are as follows: (1) highlighting limitations of existing approaches, particularly poor multi-source integration and low adaptability to complex terrains; (2) developing a spatial database framework integrating satellite imagery (Sentinel-1, Sentinel-2), UAV RGB imagery, LiDAR point clouds, and cadastral data for efficient storage, management, and automated analysis; and (3) validating the framework in Yanshan City, Jiangxi Province, demonstrating its feasibility and potential for supporting cultivated land monitoring and subsidence analysis.
The rest of this article is organized as follows. The second section introduces the methodology, including the technical framework, data preprocessing, SBAS-InSAR (Small Baseline Subset Interferometric Synthetic Aperture Radar) analysis, and spatial database design. The third section presents the experimental results, covering cropland classification accuracy, subsidence monitoring, and system visualization functions. The fourth section discusses the key findings in the context of existing studies. The fifth section concludes the paper and outlines future research directions.
Method
Technical route
This study proposes an integrated framework for monitoring cultivated land and assessing subsidence risk in hilly regions by combining space-air-ground remote sensing with a spatial database. Multi-source data acquired from October 2022 to May 2024 include Sentinel-2 Level-2A surface reflectance for land-cover classification and Sentinel-1A IW SLC data (VV polarization) imagery for surface deformation monitoring, with SAR processing supported by AUX_POEORB precise orbits and SRTM DEM for geometric and topographic correction.
UAV imagery from a DJI Phantom 4 and terrestrial LiDAR point clouds obtained from a FARO Focus 350 were used to derive indicators, including erosion rate, soil type, abandonment risk, and soil acidification. Sentinel-2 imagery was used to delineate cultivated land parcels, providing spatial masks for subsequent analysis. SBAS-InSAR results from Sentinel-1A were integrated into an object-relational spatial database (PostgreSQL/PostGIS), with cropland parcels as the primary spatial unit to support cross-scale queries and risk assessment. A complementary 3D visualization system developed with HTML, Cesium, and Apache ECharts enables multi-level interaction and decision support. The overall technical workflow of this framework is illustrated in Figure 1.

Comprehensive technical route for sustainable cropland management in Complex terrains.
Sentinel-2 data preprocessing and cropland extraction
As introduced in the section “Technical route”, 13 Sentinel-2 Level-2A surface reflectance images with less than 40% cloud cover were selected. These products already include atmospheric correction. During preprocessing, cloud and shadow pixels were masked using the Scene Classification Layer (SCL), which was resampled from 20 m to 10 m to match the spectral bands. For each image, a five-band composite was constructed using visible (Blue, Green, Red) and near-infrared (NIR) bands combined with normalized difference vegetation index (NDVI). Two additional vegetation indices, soil-adjusted vegetation index (SAVI) and enhanced vegetation Index (EVI), were calculated to enhance vegetation type discrimination. The seven features per image (Blue, Green, Red, NIR, NDVI, SAVI, EVI) were stacked across all 13 images to form a multi-temporal feature matrix for classification. Cropland extraction was performed using a supervised Random Forest classifier. Training and validation Regions of Interest (ROIs) were manually selected in Environment for Visualizing Images (ENVI) for seven land-cover classes: water, forest, bare land, cropland, buildings, sparse vegetation, and road, with 70 samples per class for training and 30 for testing.
SBAS-InSAR-based remote sensing analysis of cropland subsidence
Principle of SBAS-InSAR technology
SBAS-InSAR is a multi-temporal InSAR technique that estimates long-term surface deformation by constructing interferometric pairs under short temporal and spatial baselines. This approach enhances phase coherence and enables reconstruction of both average deformation rates and cumulative displacements through phase unwrapping and time-series inversion. In this study, SBAS-InSAR processing was conducted using SARscape 7.6 (integrated in ENVI).
Mathematical model and deformation inversion
In SBAS-InSAR, SAR images that satisfy predefined spatial and temporal baseline thresholds are grouped into multiple small baseline subsets to maintain phase coherence and reduce decorrelation.
Assuming that

where
After removing residual topographic phase, atmospheric delays, and noise, the displacement rate sequence can be shown in equation (2).

This leads to a linear system:

where A is a rank-deficient matrix formed by temporal intervals, v is the unknown deformation rate vector, and
Processing workflow and parameter settings
After image registration and interferogram generation, the SBAS-InSAR processing workflow included: topographic phase removal, orbit error correction, phase filtering and unwrapping, orbit refinement and re-flattening, time-series inversion, and atmospheric phase correction.
The topographic phase was removed using the SRTM DEM based on the EGM96 geoid to obtain ellipsoid heights. Precision Orbit Ephemeris (AUX_POEORB) data from european space Agency (ESA) was introduced to reduce orbit-induced phase ramps. Interferometric pairs were constructed under a temporal baseline of 120 days and a spatial baseline threshold of 2% of the maximum perpendicular baseline. Among the 20 Sentinel-1A scenes, the maximum perpendicular baseline was 312 m, corresponding to a 6.24 m spatial threshold, yielding 75 interferograms. All pairs used imagery acquired on 15 March 2023 as the common master image.
Goldstein filtering and Minimum Cost Flow unwrapping were applied, with a coherence threshold of 0.35. Low-coherence areas were masked to reduce noise. For orbit refinement and re-flattening, 10–25 ground control points (GCPs) were selected according to criteria such as absence of terrain/deformation fringes and location outside deformation zones.
Time-series inversion was carried out in two stages: first, the average deformation rate was estimated under a linear assumption, and second, the cumulative displacement was calculated. After obtaining the initial rates (_disp_first), custom atmospheric filtering was applied. High-pass and low-pass filters were used to estimate atmospheric delays, which were subtracted from displacements at each epoch. The remaining ramps were removed using orbit control points.
Conceptual architecture design for multi-source data integration
The conceptual structure provides the foundation for designing a spatial database for cropland monitoring in hilly areas. It organizes data from requirements analysis into entities, attributes, and relationships. Core entities were carefully selected based on their relevance to cultivated land monitoring: monitoring objects (e.g. cropland parcels), sensors (e.g. LiDAR, GNSS [Global Navigation Satellite System], UAV), and obstacle factors (e.g. erosion rate, soil type, abandonment risk, and soil acidification). obstacle factors represent environmental or anthropogenic conditions that may influence cropland stability and productivity. Attributes are simplified, with no sub-attributes or cross-entity links, ensuring clarity, efficient queries, and scalability. Example attributes include ID, location, and remarks for monitoring objects; sensor ID, installation details, and sampling frequency for sensors; 3D coordinates and reflectivity for LiDAR data; and type, severity, and recovery status for obstacle factors. The conceptual model was designed using Aspose Diagram, and Figure 2 presents the E-R diagram.

Global entity-relationship (E-R) model for hilly region cultivated land monitoring.
Application-oriented logical structure planning
The logical structure of the database was constructed based on the conceptual framework and adapted for the chosen database management system. The one-to-many relationship between monitoring objects and sensors is clearly represented: each monitoring object can correspond to multiple sensors. Primary keys (PK) are assigned to all entities with non-null constraints, and foreign keys (FK) are defined on the “many” side to maintain entity relationships. The monitoring object ID serves as a FK in sensor, point cloud, and obstacle factors, ensuring seamless data integration.
The database schema organizes multi-source data around cropland parcels as the primary unit. LiDAR-derived terrain indicators and UAV-based vegetation metrics are stored as structured attributes, while InSAR-derived deformation signals are linked to the same parcels. This logical structure ensures consistent integration across observation scales and supports systematic monitoring of cropland obstacles. To distinguish sensor performance, essential metadata such as sampling frequency, spatial resolution, and measurement range are also recorded. The resulting logical model is presented in Figure 3.

Global UML diagram for the hilly region cultivated land monitoring system.
Table of primary obstacles to cropland utilization
The table records key obstacle factors affecting cropland stability and sustainability in hilly regions, including erosion rate, soil type, abandonment risk, and soil acidification. Each obstacle is assigned a unique Obs_ID, and attributes such as location, discovery time, severity, and recovery status are systematically recorded. The logical structure of the table is presented in Table 1, providing a systematic framework to track and manage the primary challenges to cropland sustainability.
Obstacle factor table.

Importantly, the integration of UAV, LiDAR, and satellite data in this study goes beyond parallel storage. All data sources are organized under the cropland parcel as the primary spatial unit. Sentinel-2 imagery provides the parcel boundaries; SBAS-InSAR results from Sentinel-1 are intersected with these parcels to detect deformation; UAV imagery and terrestrial LiDAR point clouds are then spatially aligned with the same parcels to derive erosion rate, soil type, and abandonment risk. In this way, UAV- and LiDAR-derived indicators are directly linked to the deformation signals extracted from satellite radar. Within the spatial database, this linkage is explicitly implemented through foreign-key relationships, ensuring that each parcel acts as a hub connecting satellite-based monitoring with field-scale observations. Thus, the framework not only stores multi-source data, but also enables cross-scale analysis and risk assessment anchored to a unified spatial reference.
Table of data on LiDAR acquisition
The table stores the data collected from terrestrial laser scanning with the Faro Focus 350 system. The raw LiDAR data are stored in LAS format, retaining 3D geometry, RGB color, and reflection intensity, and can be compressed to LAZ for efficient storage and transmission. Preprocessing includes ground filtering and point classification to separate terrain, vegetation, and structural features, enabling direct application to cropland terrain modeling and obstacle monitoring.
The scanner provides a range of up to 350 meters, with a ranging accuracy of ±1 mm, a maximum sampling frequency of 976,000 points per second, and an angular resolution as fine as 0.009°. These specifications allow precise representation of cropland morphology and micro-topographic variations. Temporal attributes, such as acquisition time, are stored using standard timestamp types (YYYY-MM-DD hh:mm: ss), supporting multi-temporal organization and time-series analysis. Table 2 presents the logical structure, including a framework to manage LiDAR acquisition records, including Obs_ID, file format, preprocessing status, resolution, and acquisition time.
Sensor data table.

Spatial database management system
In the spatial database management system, a layered architecture is implemented to ensure clear data flow and efficient interaction. User requests are initiated through the web interface and transmitted to the controller and service layers for logic processing. The persistence layer manages interactions with the spatial database, which is built on PostgreSQL with PostGIS. Data are retrieved asynchronously through the fetch() method to access JSON files, enabling smooth visualization and analysis. The system also supports exporting query results into XLS, XLSX, CSV, and HTML formats, facilitating further analysis and integration with other applications.
The comprehensive process of cultivated land monitoring
The monitoring framework integrates multi-source observations to capture key dimensions of cultivated land conditions. Soil-related information, including soil type, and soil acidification risk, is inferred indirectly from remote sensing imagery. Crop growth is characterized by vegetation indices derived from UAV-based RGB imagery, such as plant height estimation, canopy cover, and spectral vegetation vigor indicators. Climatic influences are represented through auxiliary datasets such as rainfall and temperature records. Furthermore, land degradation dynamics, including erosion rate and abandonment risk, are evaluated by combining UAV imagery with high-resolution terrain models generated from terrestrial laser scanning.
Sensors’ deployment is limited to UAV-borne optical cameras and ground-based terrestrial laser scanners. UAV RGB imagery provides the primary data source for vegetation monitoring, land-use classification, and surface soil condition interpretation. The FARO Focus 350 terrestrial laser scanner contributes high-precision point cloud data, enabling detailed analysis of slope gradients and erosion-prone zones. In parallel, synthetic aperture radar (SAR) imagery from external platforms may be employed to detect land deformation and complement ground-based measurements. This integration ensures that monitoring results are consistent with available instrumentation while capturing the critical interactions between soil, crops, and terrain in hilly cropland regions.
Results
Cropland classification and accuracy assessment
The classification results were evaluated using a confusion matrix and Kappa coefficient in Python, yielding an overall accuracy of 81.43% and a Kappa of 0.7833 on the test set. Representative outputs are shown in Figure 4 (classification map), Figure 5 (confusion matrix), and Figure 6 (cropland classification overlay with remote sensing imagery for study area selection).
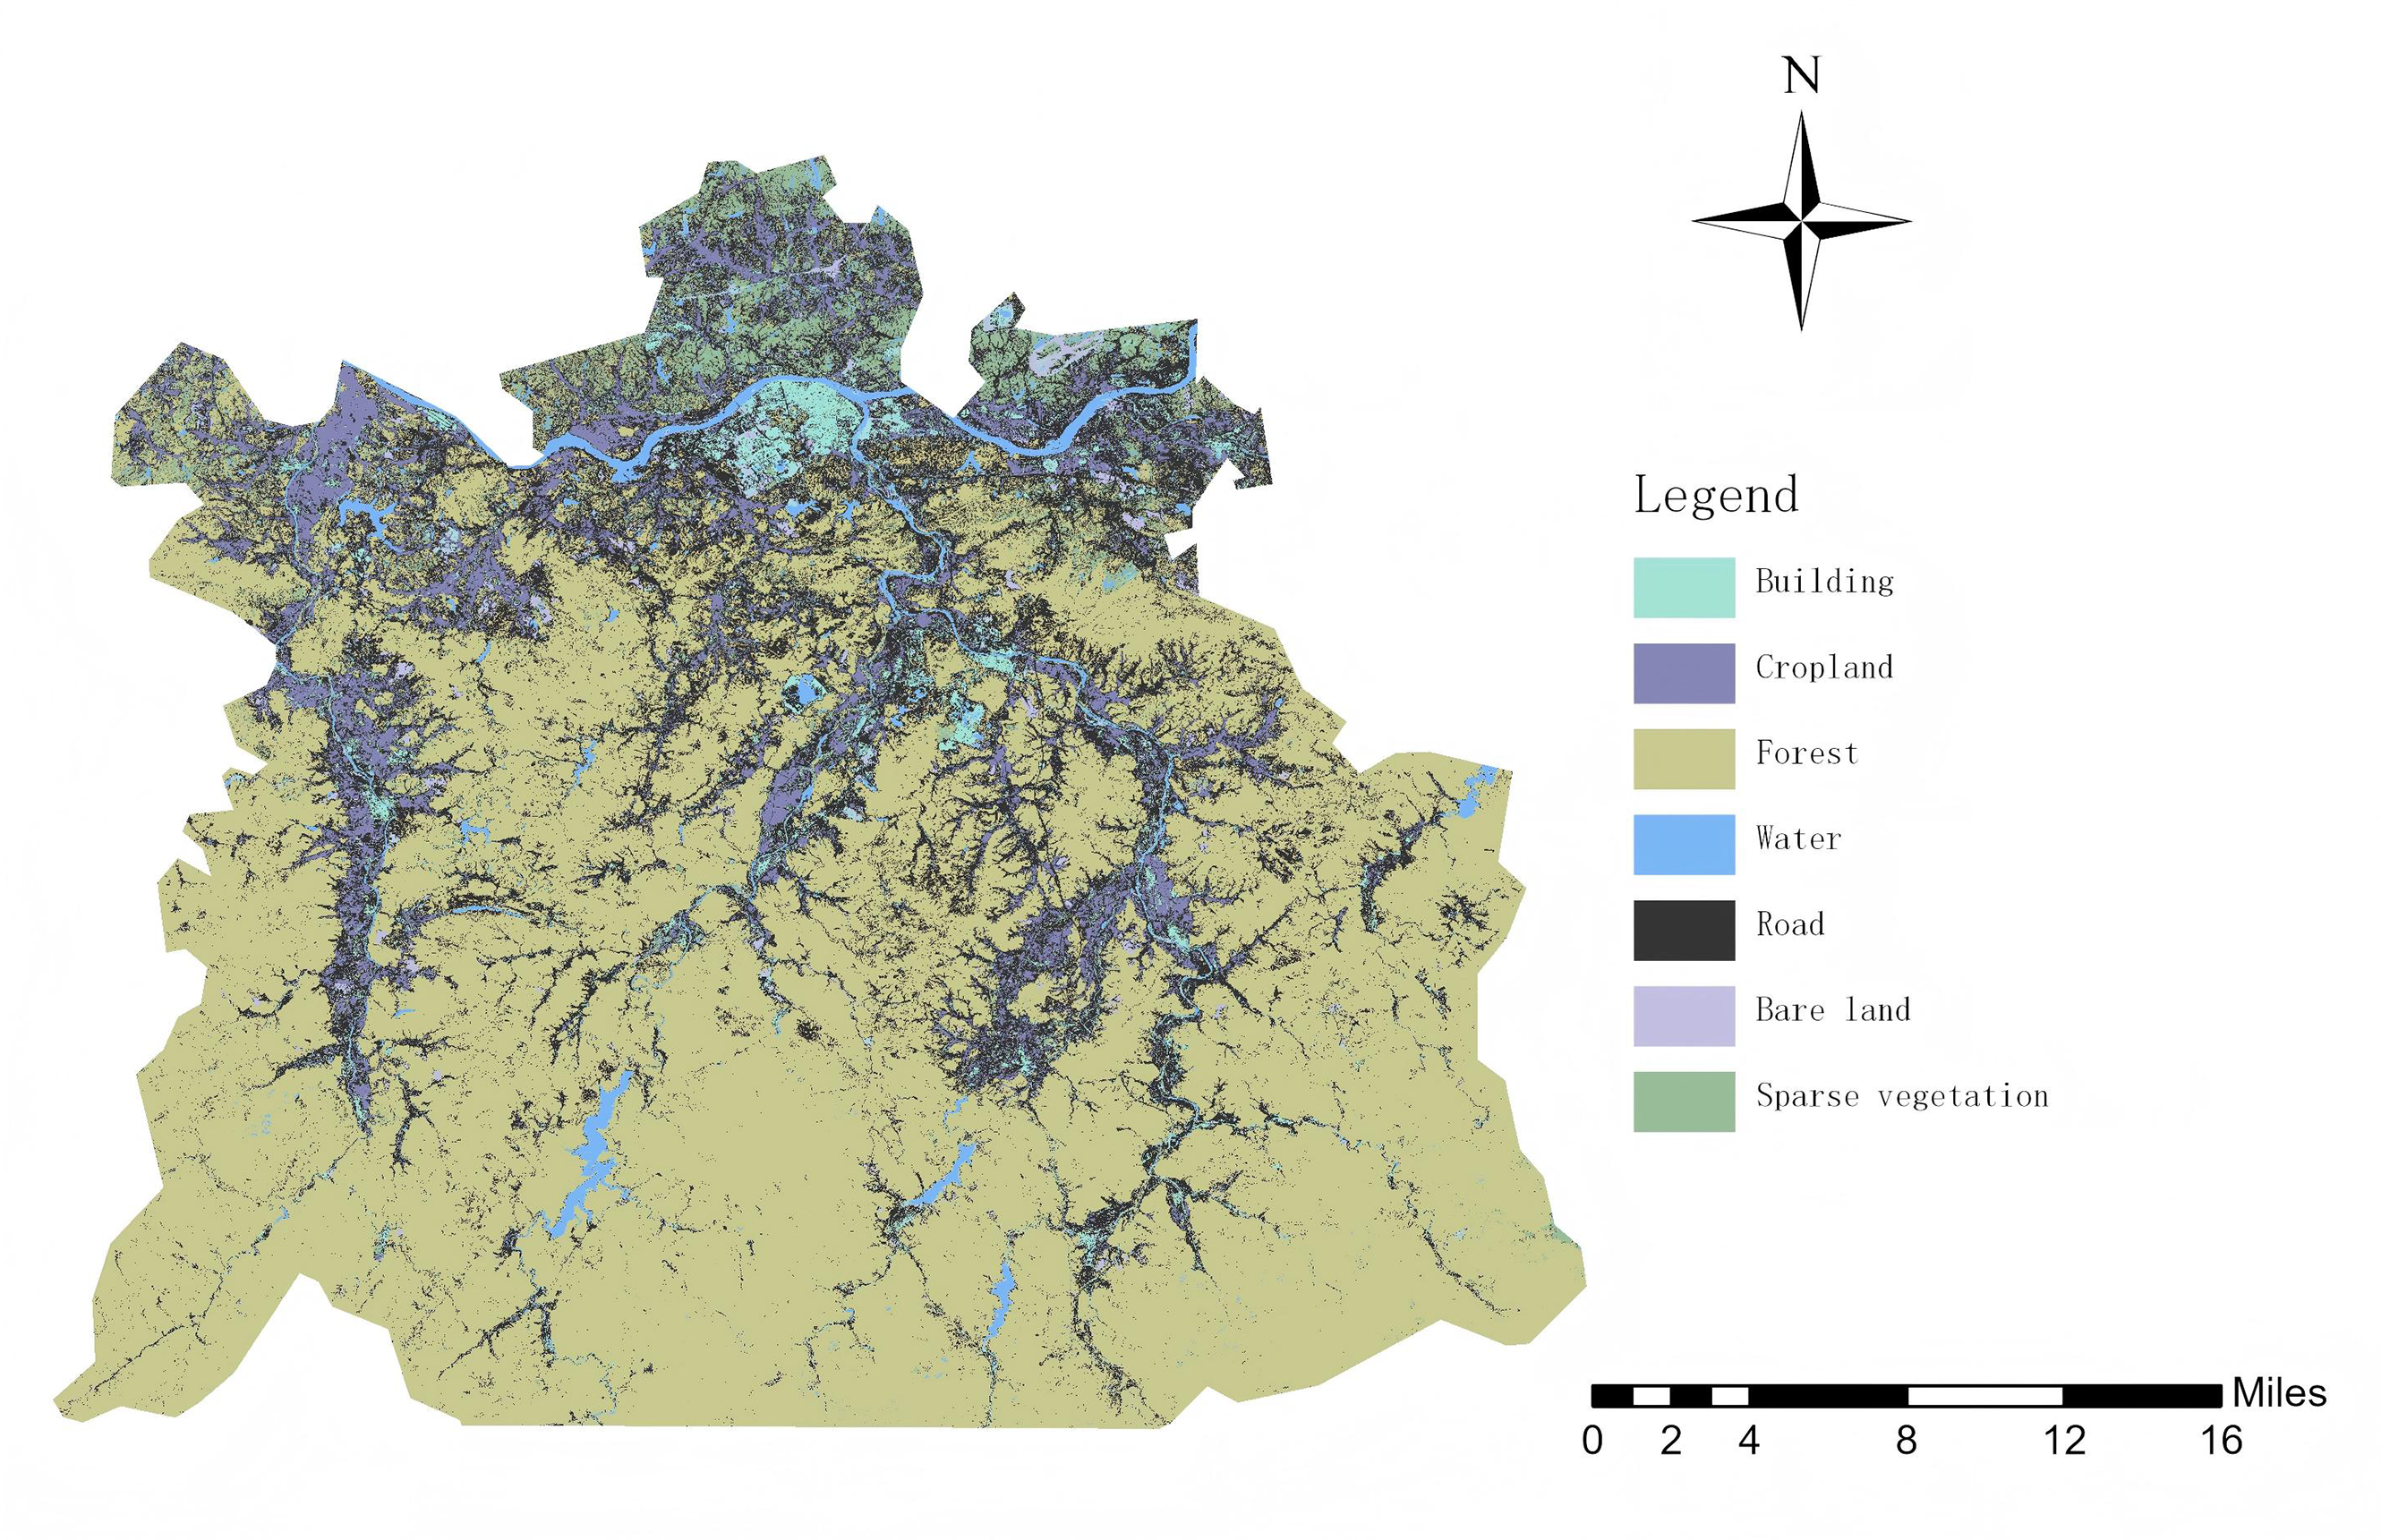
Supervised classification results derived from analysis of Sentinel-2 data.

Confusion matrix of the supervised classification.

Random forest cropland classification results and remote sensing imagery overlay for study area selection.
Cropland subsidence monitoring results using SBAS-InSAR
LOS deformation results were geocoded into WGS84 and served as core products for cropland subsidence monitoring. The results obtained by SBAS-InSAR as of 24 May 2024 are shown in Figure 7.
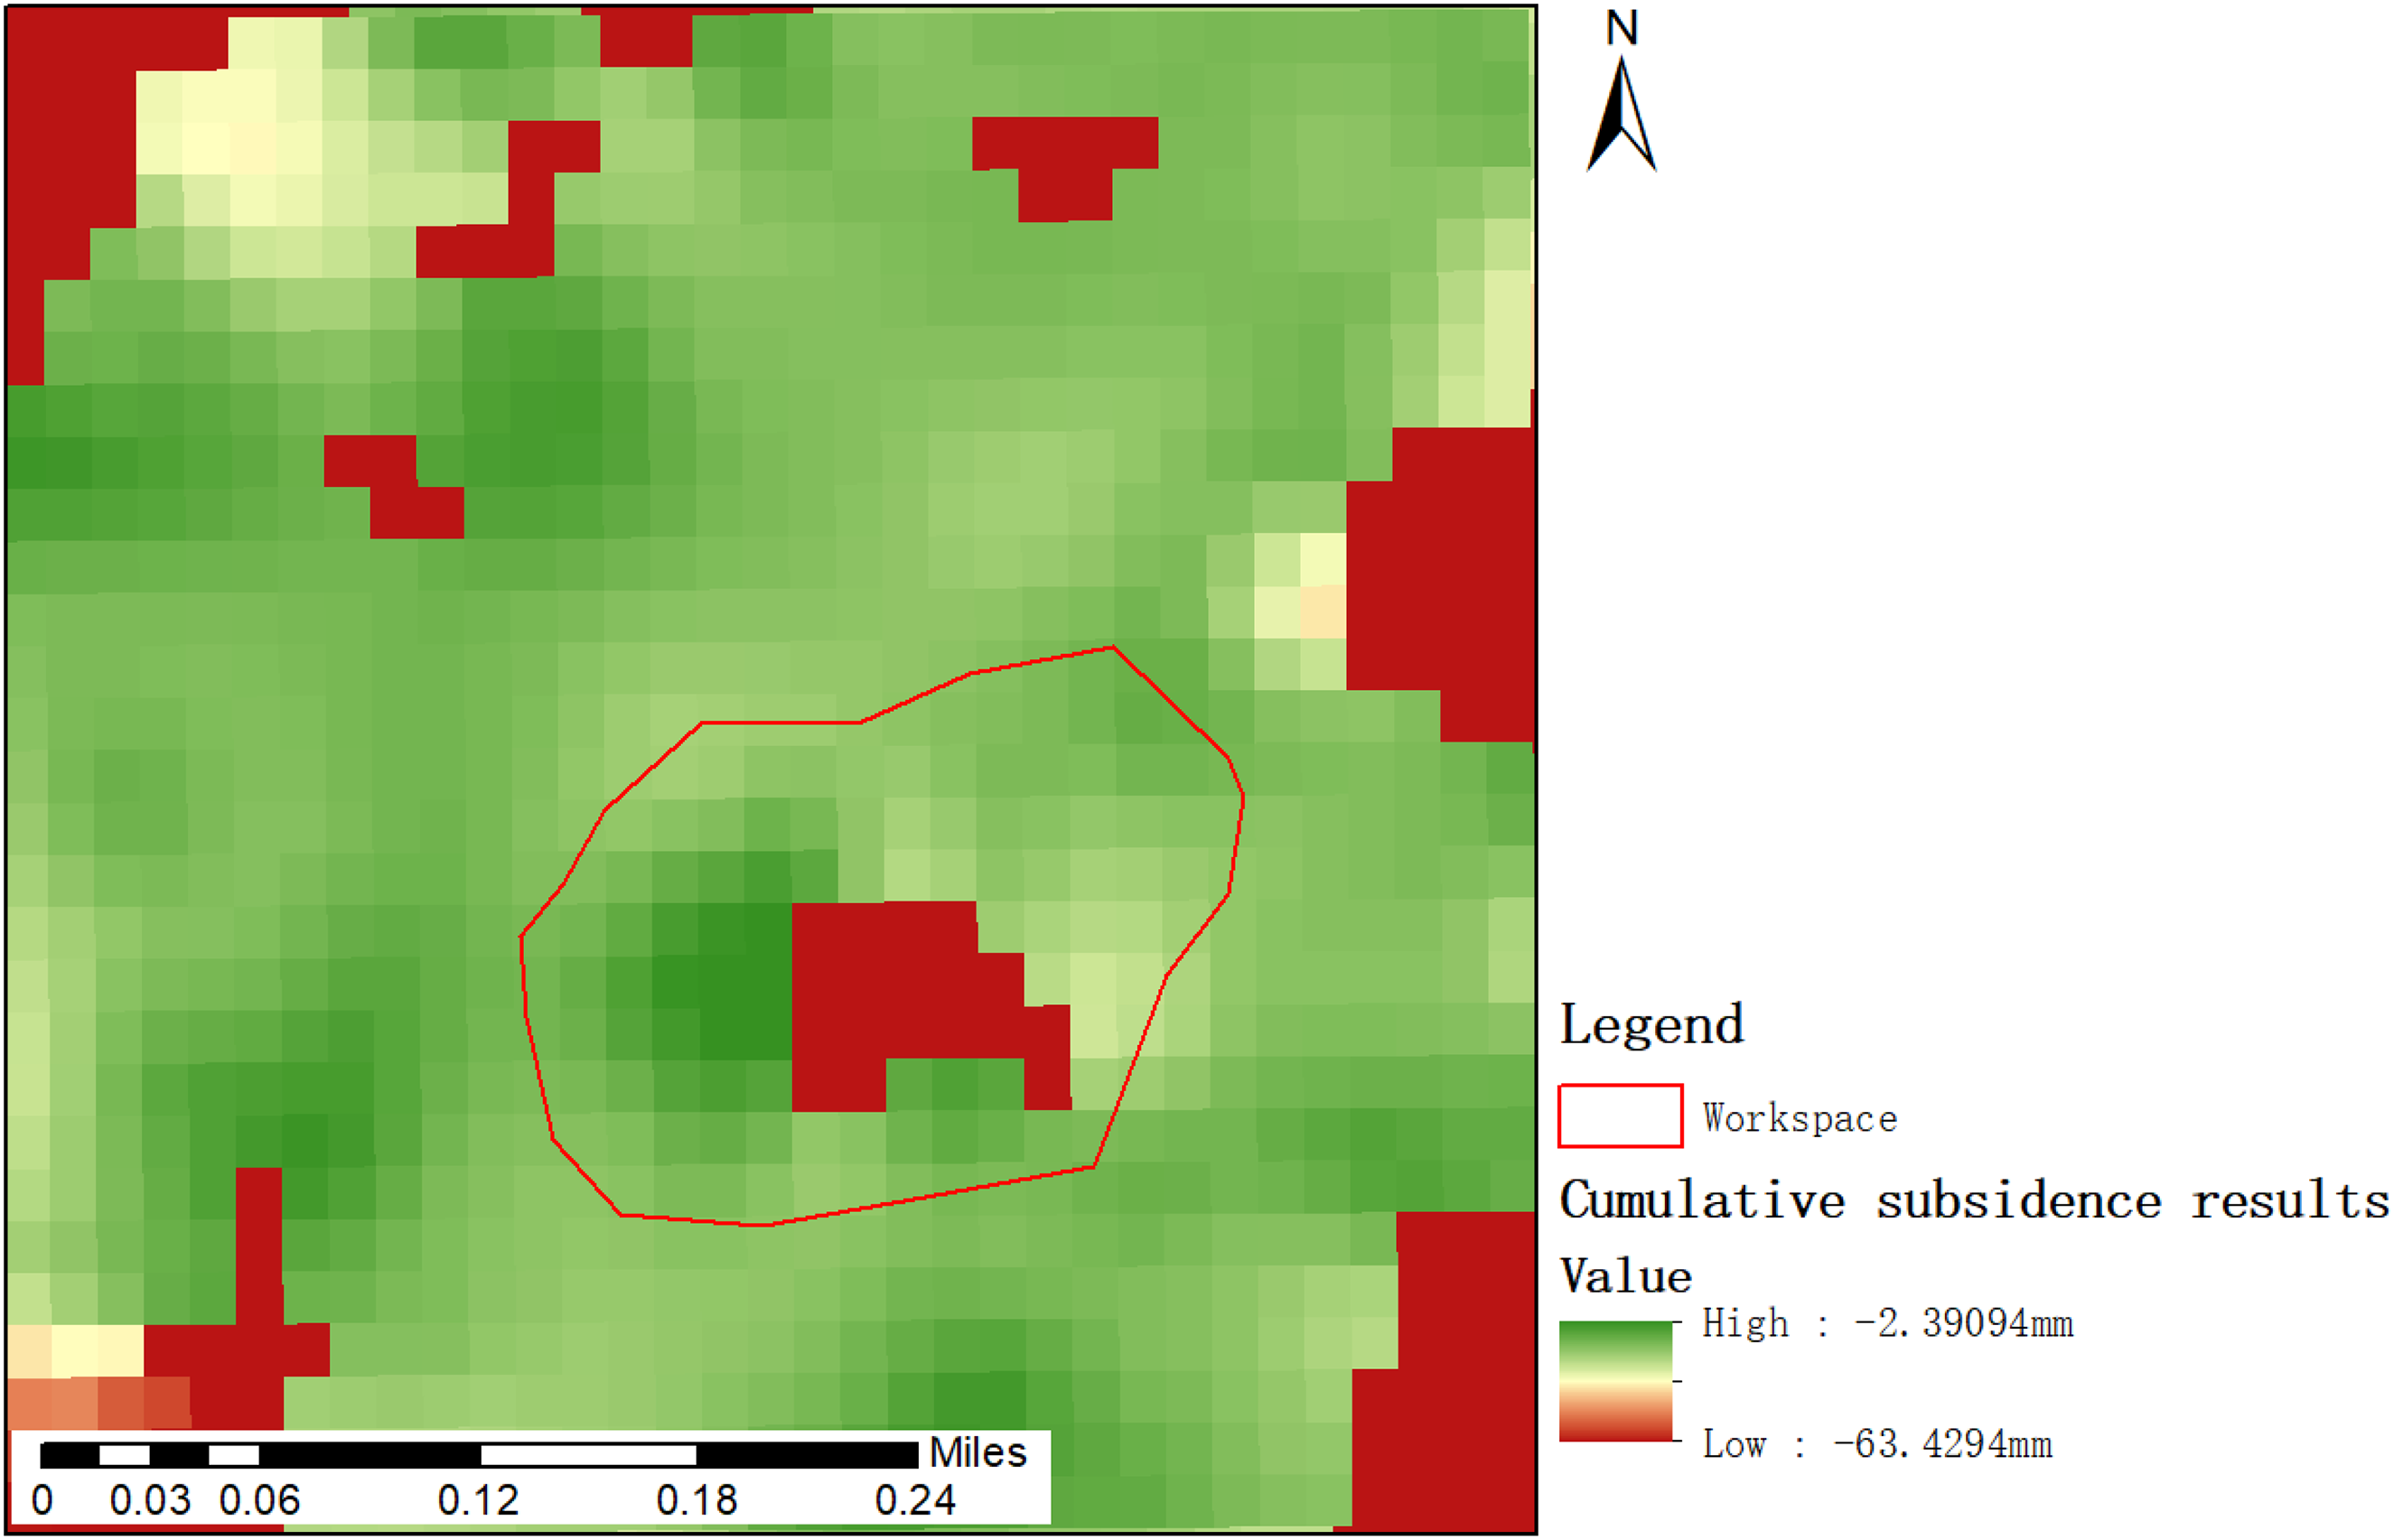
SBAS-InSAR deformation results for cultivated land monitoring in hilly regions.
Cropland condition visualization and analysis system
Data collected by dynamic and static acquisition instruments
In the domain of cultivated land, the comprehensive data gathered by dynamic and static instruments converges into two distinct categories: soil-related insights and environmental monitoring metrics. Notably, soil fundamental data, pollution status, environmental conditions, and other key parameters collectively illuminate the fertility and health status of the land. Additionally, the integration of crop growth trends, meteorological observations, disaster risk assessments, production potential evaluations, and resilience against natural hazards offers a holistic view of agricultural sustainability and resilience.
In addition, by harnessing visualization techniques to illuminate the intricate correlations, distributions, and trends among diverse sensor data (encompassing temperature, humidity, light intensity, and carbon dioxide levels), we empower stakeholders to intuitively discern data patterns and swiftly pinpoint anomalies that deviate from normative patterns. This approach fosters proactive fault detection, early warning mechanisms, and efficient handling of abnormal events within the monitoring system, thereby facilitating the timely identification of potential issues and the swift implementation of remedial measures.
Main constraints of cropland
The system integrates and manages key obstacle factor data affecting sustainable cropland use, including erosion rate, soil type, abandonment risk, and soil acidification. These data are stored in structured tables and visualized in 3D using HTML, CesiumJS, and Apache ECharts, enabling multi-dimensional and immersive data representation.
As shown in Figure 8, the Cropland Monitoring Visual Platform adopts a modular interface design that supports spatial analysis and interactive exploration of obstacle factors. The central map area provides geospatial visualization and spatial filtering, allowing users to dynamically examine the spatial distribution and evolution of factors by clicking or selecting specific regions. The left panel integrates dropdown menus and interactive charts (e.g. bar charts for erosion rate, line graphs for abandonment risk, horizontal bar charts for soil acidification), enabling dynamic filtering and sorting by factor type, location, and severity level.

Visualization of primary obstacles affecting cultivated land utilization in hilly regions.
The platform supports multi-indicator comparison and statistical summarization, allowing users to rapidly retrieve key metrics such as regional averages, extremes, and temporal trends, and to investigate inter-factor correlations through interactive queries. The right information panel displays detailed cases of typical obstacle zones, supporting drill-down analysis to individual plots for fine-grained assessment. All filtered results and visualizations can be exported in CSV, XLS, or HTML formats for reporting and cross-platform sharing.
Furthermore, the system leverages CesiumJS to render terrain and obstacle factors in 3D, enabling users to interactively explore the landscape through rotation and zooming, thereby gaining intuitive insights into how topography influences cropland degradation. This platform enhances data interpretability and provides visual decision support for cropland conservation policy and precision management.
Point cloud data conversion and management
The system segments the scene file into multiple hash files with different detail levels to enable efficient visualization of large point clouds and generate 3DTiles. The octree algorithm is applied for this segmentation. These hash files are converted into the PNTS tile format. An index file is created based on the octree spatial structure, geographic positions, rotation matrices, and geometric errors of the tiles. This results in a well-structured 3DTiles tileset.
Point cloud data are managed and organized through combined front-end and back-end technologies. Stored data are retrieved from spatial databases and displayed in detailed 3D visualizations. A color-mapping function differentiates point cloud attributes by color to improve user understanding. Various operations, such as rotation, scaling, and translation, allow flexible inspection of cropland structures and details. Measurement and labeling tools enable precise distance, angle, and area calculations on selected points, lines, or surfaces within the laser point cloud. Annotation functions allow users to document important information or issues for future reference and correction. Figure 9 presents the point cloud data visualization system.
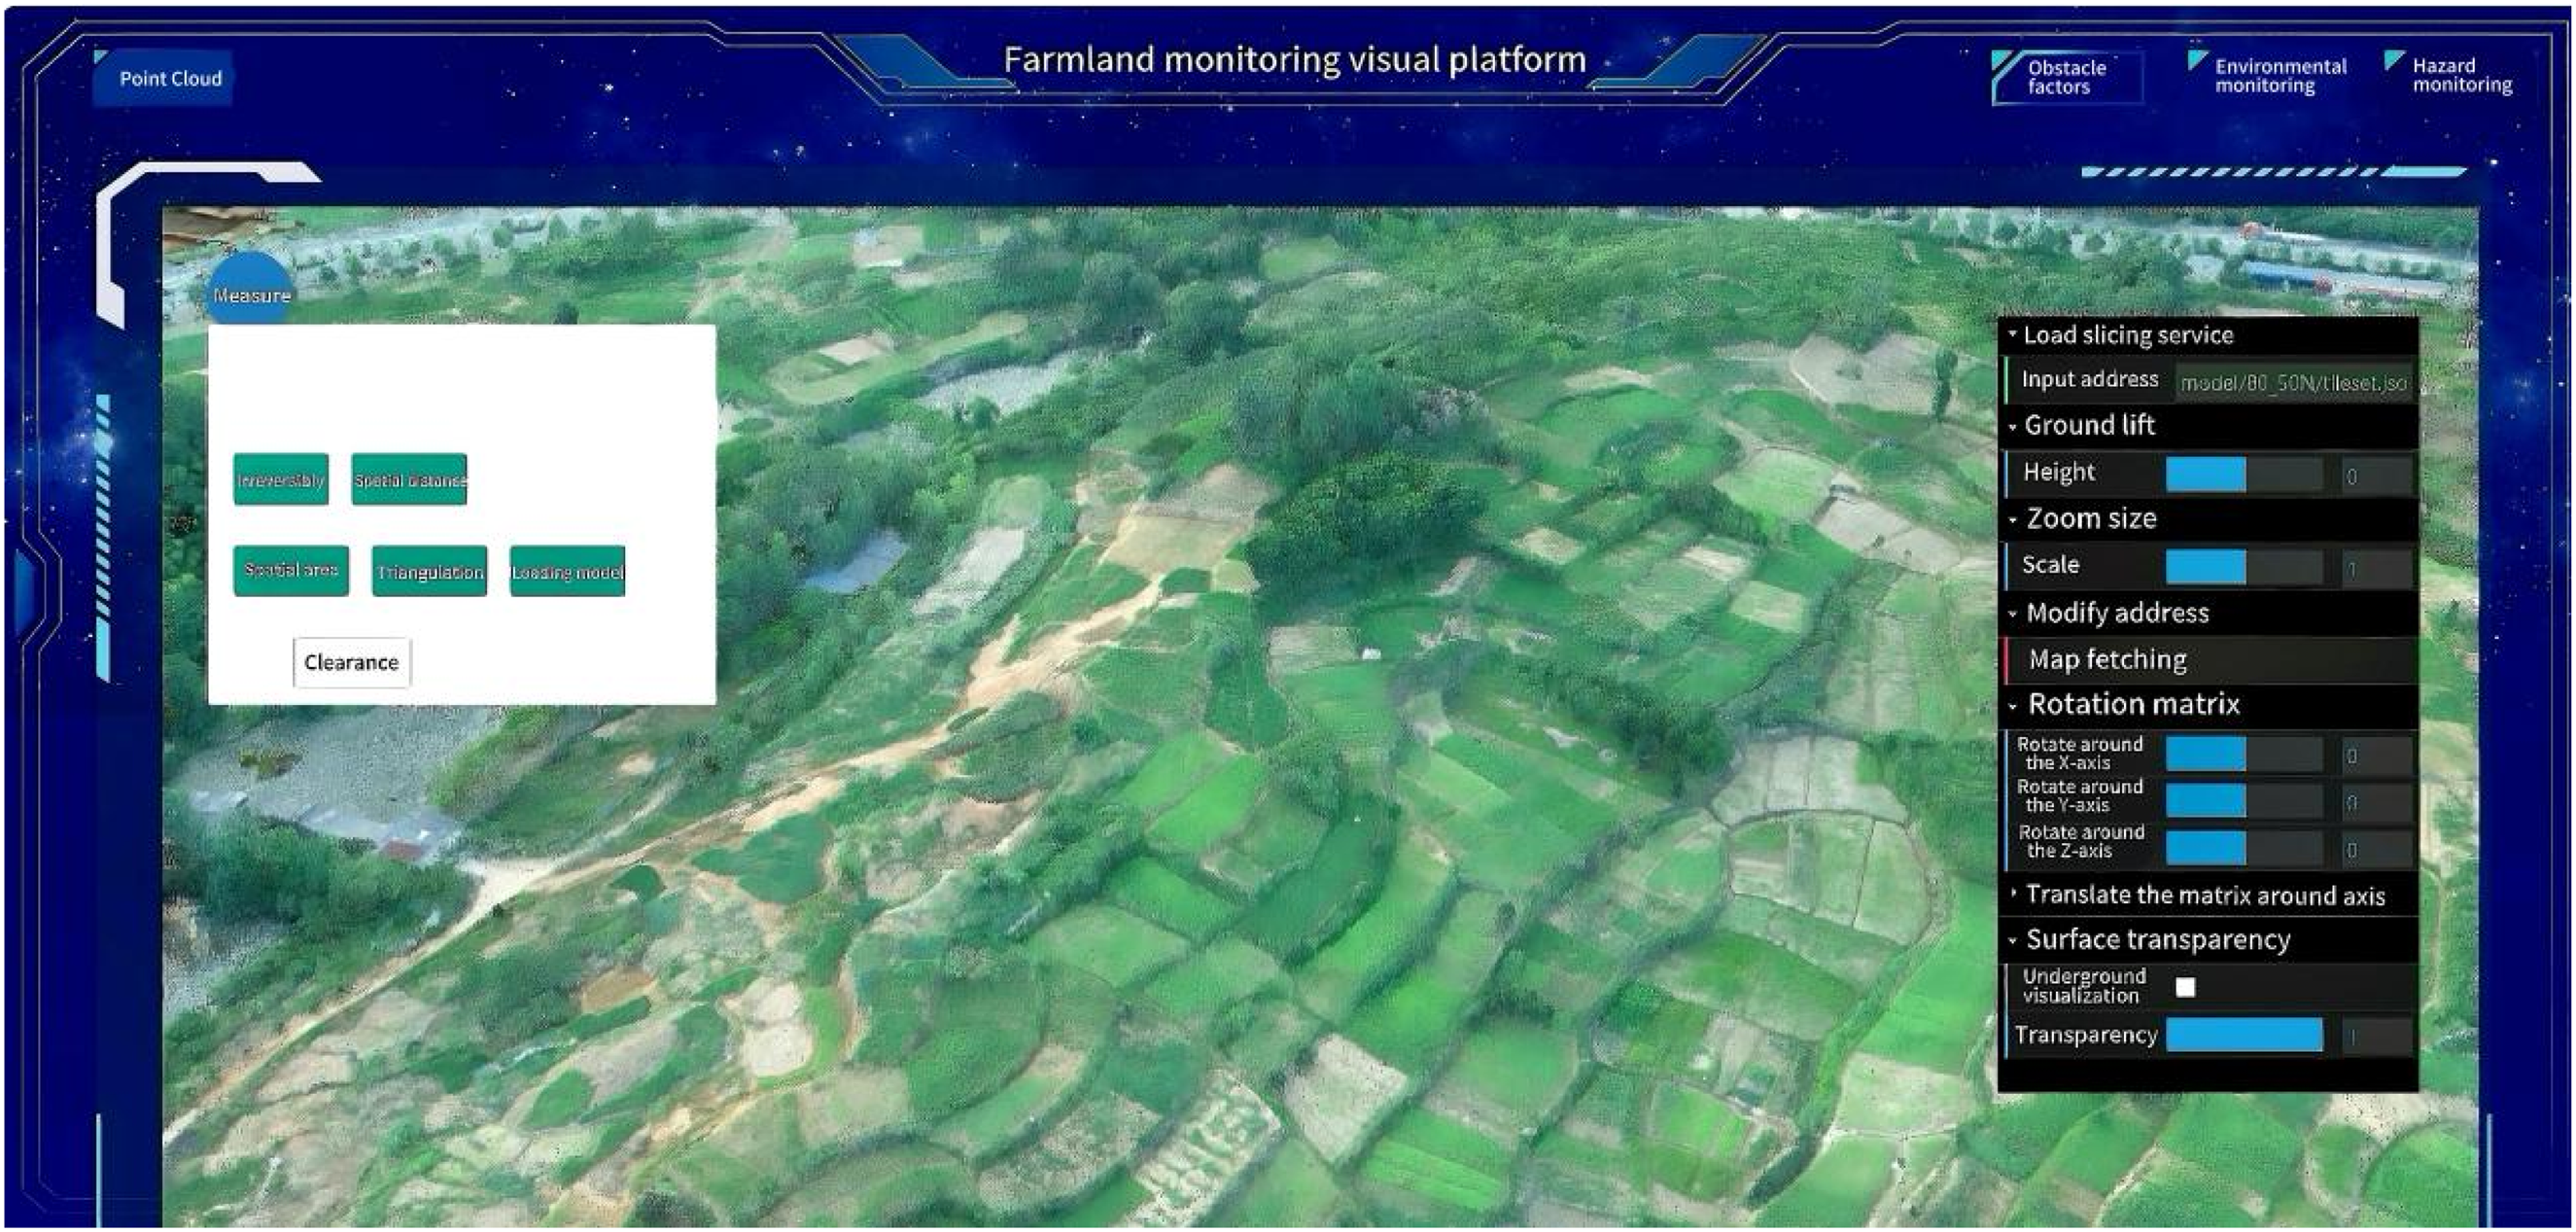
Point cloud data visualization for cultivated land monitoring in hilly regions.
Hilly cropland GNSS monitoring module
The GNSS monitoring module collects signals from multiple satellite navigation systems, with data updated at a frequency of 5–10 Hz. Multi-system positioning technology improves accuracy and stability in complex terrains such as hills and mountains. The receiver extracts key information, including satellite positions, timestamps, and signal strengths, which are stored in the integrated spatial database. Advanced positioning algorithms such as differential global positioning system and real-time kinematic process the multi-source GNSS data to reduce errors caused by atmospheric delays and multipath effects. Precision adjustments are made by comparing measurements from reference stations and mobile receivers, with baseline distances typically within 10–15 km. Using fast-static GNSS techniques, the positioning accuracy reaches approximately 3 mm + 0.5 ppm RMS horizontally and 5 mm + 0.5 ppm RMS vertically. This minimizes random errors and systematic noise, ensuring reliable monitoring data.
For cultivated land deformation analysis, time-series and wavelet analysis are applied. In this study, the Daubechies wavelet was used, implemented in MATLAB, to decompose the GNSS-derived displacement series. Noise and gross errors were filtered while retaining real deformation signals, enabling the identification of both long-term settlement trends and short-term fluctuations.
The module provides concise visualization functions based on the cultivated land spatial database. Users can observe horizontal displacement, vertical settlement, and related indicators through clear maps and charts. Statistical tools, spatial analysis, and trend forecasting assist users in detecting anomalies quickly and supporting timely decisions.
The integration of the GNSS monitoring module into the spatial database enhances accuracy and reliability, as verified in preliminary experiments using DJI Phantom 4 UAV photogrammetry and FARO Focus 350 terrestrial laser scanning as external references. This demonstrates the system's ability to support practical cropland monitoring and management needs. Figure 10 illustrates the GNSS detection module.

GNSS detection module for cultivated land deformation monitoring in hilly regions.
Discussion
Cropland monitoring has traditionally relied on diverse remote sensing datasets, including optical imagery, radar data, UAV-based high-resolution observations, and LiDAR point clouds. Existing studies have made important progress. For example, Savitha et al. used multi-temporal Sentinel-2 imagery combined with machine learning algorithms (support vector machine and Random Forest) to map cropland extents in a small agricultural watershed. 24 Felegari et al. integrated Sentinel-1 and Sentinel-2 data to improve crop type classification. 25 Xie et al. employed UAV imagery for fine-scale parcel-level mapping and dynamic monitoring. 26 Asadi et al. illustrated that combining multi-source satellite and UAV data with machine learning models can enhance the monitoring of crop conditions and growth dynamics. 27 While valuable, these studies mainly focus on data or algorithmic improvements rather than providing a unified framework for multi-source integration. In contrast, the space–air–ground integrated cropland monitoring database developed in this study takes parcels as the core unit, integrating UAV, LiDAR, and InSAR data to record obstacle factors and monitor land surface changes, offering greater integrative capacity and scalability than existing systems.
While these studies provide valuable insights, most existing approaches focus on either single-source data optimization or algorithmic improvement. They rarely establish a unified framework to systematically organize, integrate, and analyze multi-source datasets. This limitation affects scalability, cross-scale analysis, and long-term monitoring. In addition, factors such as surface deformation, land-use changes, and cropland obstacles are often treated separately, which restricts comprehensive farmland management.
In contrast, the space–air–ground integrated database developed in this study uses cropland parcels as the core organizing unit. By combining UAV imagery, LiDAR point clouds, and InSAR-derived deformation data, the system systematically records obstacle factors and monitors land surface changes at the parcel level. Compared with existing cropland monitoring systems, our approach provides a more comprehensive and flexible solution.
Overall, the integrated database framework represents both a methodological advancement and a practical system architecture. It demonstrates how multi-source, multi-scale farmland monitoring can move beyond fragmented approaches and offer stronger support for sustainable cropland management.
Conclusion
This study proposes and demonstrates a multi-source spatial database framework for cultivated land monitoring in hilly regions. The framework organizes UAV imagery, LiDAR point clouds, InSAR-derived deformation results, and obstacle factors into a parcel-centered database, enabling unified storage, management, and cross-scale analysis. Preliminary experiments confirm its feasibility and operational stability, showing its potential to support systematic farmland monitoring.
Future work will emphasize large-scale validation, incorporation of field survey data, and the integration of predictive and AI-assisted analysis modules to enhance reliability and scalability in practical applications.
Footnotes
Acknowledgements
We sincerely thank the members of our laboratory team at the International Joint Laboratory of Safety and Energy Conservation for Ancient Buildings, Ministry of Education, and the Jiangxi Institute of Natural Resources Mapping and Monitoring, for their support in data acquisition, technical assistance, and insightful discussions that contributed to this study.
Author contributions
Wang Zhenda and Teng Yue performed data collection and analysis; Huang Xinyi conducted data analysis and designed the spatial database; Huang Xinyi and Wang Ruoxin wrote the manuscript; Guo Ming and Wei Yaxuan conceptualized the study and designed the methodology; Chen Jiangjihong implemented the spatial database visualization framework; Huang Ming provided technical guidance and supported the data analysis workflow; Shi Yanru processed UAV imagery and assisted in accuracy assessment and database testing. All authors reviewed and approved the final manuscript.
Funding
The authors disclosed receipt of the following financial support for the research, authorship, and/or publication of this article: This work was supported by the National Natural Science Foundation of China under Grant No. 42171416.
Declaration of conflicting interests
The authors declared no potential conflicts of interest with respect to the research, authorship, and/or publication of this article.
Data availability statement
The results/data/figures in this manuscript have not been published elsewhere. The datasets used during the current study are available from the corresponding authors on reasonable request.