
Abstract
Introduction
The rapid pace of urbanization has significantly altered land-use patterns, 1 transforming landscapes and inducing structural changes. This transformation not only impacts land use and its functions but also triggers substantial modifications in surface morphology. In turn, these alterations affect material and energy flow within regional ecosystems, including climate, hydrology, and soil, leading to ecological and environmental challenges such as land quality deterioration, reduced vegetation diversity, and landscape homogenization. 2
China's commitment to ecological civilization has been elevated at the national level, with notable progression from the 18th Party Congress in 2012 to the 20th Party Congress in 2022. 3 The latter introduced the concept of “strengthening ecological environmental protection comprehensively, territorially, and process-wise, treating nature and the ecological environment with the same care as our own eyes.” Consequently, studying the impacts of land-use changes on the ecological environment has emerged as a pivotal avenue for understanding the intricate interplay between human activities, socioeconomic development, and ecological and environmental consequences.4,5
Research investigating the relationship between land use and its ecological and environmental effects began in the 1960s, with a focus on environmental quality assessment. 6 With the increasing maturity of GIS and remote sensing monitoring technologies, scholars worldwide have increasingly explored the ecological responses induced by land-use changes, addressing various subsystems, including changes in the water environment,7,8–11 atmospheric conditions,12,13 and soil quality. 14 These problems were explored and solved. In terms of research content, the investment model, 15 remote sensing eco-index model,16–18 modified remote sensing eco-index model,19–21 eco-environmental quality index model,22–24 and other mathematical modeling methods are primarily applied to qualitatively and quantitatively express the eco-environmental quality effects of land-use change.
Linhe District in Inner Mongolia is an ecologically sensitive region characterized by low forest cover, agricultural surface pollution, farmland salinization, and desertification. 2 In 2023, China clarified the development direction for Bayannur City, emphasized the importance of addressing these ecological challenges and underscored their significance for China's ecological security, national development, and sustainability. 4 Although Linhe District has been extensively explored in terms of land use, existing research lacks in-depth, long-term, and spatiotemporal dynamic analyses of land-use changes in Linhe District using Remote Sensing Ecological Index (RSEI). There is also insufficient in-depth research on how conversions between different land-use types affect ecological-environment-quality changes. This study utilized land-use and Landsat (30 m resolution) images from 2005, 2010, 2015, and 2020. 5 We assessed the ecological environment quality of Linhe District in response to land-use changes over the past 15 years by considering factors such as land-use transitions, greenness, humidity, dryness, and temperature. 6 Our objective was to provide accurate and timely insights into the current state and trends of ecological environment quality in the region. These findings offer valuable technical support for long-term, small- to medium-scale ecological environment quality assessments and inform policy formulation for enhanced ecological quality in the region's new development era. 7
Materials and methods
Study area overview
Linhe District, situated in the western part of the Inner Mongolia Autonomous Region, lies in the heart of the Hetao Plain. It is bounded by the Yellow River to the south and the Yinshan Mountains to the north. Linhe District shares its eastern border with Wuyuan County (Figure 1) and neighbors Hangjin Houqi to the west. Geographically, it spans between the longitudes of 107°6’ to 107°44’ east and the latitudes of 40°34’ to 44°17’ north. Located in the middle reaches of the Yellow River, Linhe District is a vital water conservation area and ecological functional zone. As the core of the Hetao Plain, it boasts abundant farmland, wetlands, and forests, making it a key ecological regulator. Additionally, the Yin Mountains, a natural barrier against northern sandstorms, further enhance Linhe District's significance. Overall, these factors make Linhe District a crucial node in China's northern ecological barrier.

Study area location.
The region experiences a mid-temperate semiarid continental monsoon climate with a uniform vegetation type. Urbanization, driven by population growth, land development, and extensive agricultural irrigation, predominantly from the Yellow River, has substantially influenced the ecological environment.
Data sources
We used eight Landsat image datasets from 2005, 2010, 2015, and 2020. These remote sensing images were preprocessed using ENVI5.3 software, including radiometric calibration, atmospheric correction, image mosaicing, and cropping. To minimize the impact of varying vegetation growth stages, we selected images captured during similar seasons, all falling within July and August, when vegetation cover was maximum and cloud cover was less than 5%.
Elevation data were acquired from the Geospatial Data Cloud Platform (http://www.gscloud.cn) at a spatial resolution of 30 × 30 m. Land-use type data for the study area in 2005, 2010, 2015, and 2020 were obtained from the Resource and Environment Science Data Centre of the Chinese Academy of Sciences (http://www.resdc.cn) at a spatial resolution of 1 × 1 km. Land-use data were categorized into six classes, including arable land (1), forest land (2), grassland (3), watershed (4), urban/rural, industrial, mining, residential land (5), and unused land (6), following China's multiperiod remote sensing data classification system for land use/land cover monitoring. The values in parentheses represent the first-level class numbers of land-use types. All spatial data were harmonized in terms of coordinate system and spatial resolution.
Research methodology
Land-use transfer matrix
The land-use transfer matrix is a two-dimensional matrix derived from the assessment of changes in land use within the same area over different periods. It provides insight into the conversion between different land types during specific periods, offering a comprehensive view of land-use transitions within the study area.
25
This method is rooted in quantitative system state and state transfer analyses.
26
The mathematical expression for the transfer matrix is as follows:
Remote sensing ecological index modeling
RSEI is a method grounded in remote sensing technology that utilizes indicators such as greenness, humidity, dryness, and temperature, all directly linked to the quality of the ecological environment. It offers an intuitive and rapid means of assessing the status of the ecological environment and serves as a natural factor-based standard for evaluating the quality of the ecological environment. The RSEI was initially proposed by Hanqiu in 2013. 27 In this study, we employed the RSEI to characterize the quality of the ecological environment in Linhe District.
Greenness indicators
The greenness index is commonly represented by the normalized difference vegetation index (NDVI). NDVI relies on the principle of characterizing vegetation cover by considering the high absorption and reflectance characteristics of green vegetation in the red and near-infrared spectral bands, respectively.28,29 The formula for the NDVI is as follows:

Humidity indicators
The moisture index (WET) is a moisture-related component obtained through tassel-cap transformation. It provides a more accurate reflection of surface soil and vegetation moisture in an area, making it a valuable tool for monitoring ecological environments.
30
The formula for calculated the moisture index is as follows:


Temperature indicators
In this study, we applied an atmospheric correction method
31
to retrieve land surface temperature (LST). This process involves selecting the thermal infrared bands of an image for radiometric calibration, resulting in the acquisition of the surface-specific emissivity and blackbody radiance brightness. We then employed Planck's function to calculate the final inverted LST, as expressed by the following equation:


TS can be obtained as a function of Planck's formula.

For TM,
For OLI,
Dryness indicators
Surface drying can cause significant harm to regional ecological environments, and the severity of surface drying corresponds to increased damage. Additionally, the development of regional building land can exert adverse effects on the ecological environment. To assess dryness, we calculated the dryness index (NDBSI) by combining the bare soil index (SI)
32
and building index (IBI).
33
A higher NDBSI value indicates greater dryness, whereas a lower value indicates the opposite, as represented by the following formula:

Among them,


Remote sensing ecological index
In this study, the RSEI was determined using principal component analysis for robust objectivity. Given the distinct physical meanings and scales of the four factors comprising the RSEI, it was essential to normalize each factor individually before combining them.
34
This was achieved using the following formula:

Next, the four normalized factors were subjected to principal component analysis (PCA). Bands with a cumulative feature contribution of 85% or more were selected and multiplied by the corresponding contribution of each principal component to construct the initial RSEI0. The formula used is as follows:

According to the PCA conducted in ArcGIS, the results of the PCA for four normalized ecological factors are obtained, as shown in Table 1. The first and second principal components, whose cumulative contribution rate exceeds 85%, are selected. These components are multiplied by their respective contribution rates, and a weighted average is calculated to construct RSEI. A higher RSEI value indicates better ecological quality in the study area.
Principal component analysis results for the four factors comprising the RSEI index in Linhe District, 2005–2020.

Results
Spatial and temporal characteristics of land-use change
Quantitative structural characterization
According to the results presented in Figure 2 and Table 2, the significant magnitude of land-use transitions that occurred in Linhe District from 2005 to 2020. Table 2 total area of land type changes amounted to 622.86 km2, characterized by a net increase in arable land, watersheds, and urban/rural/residential land use, along with a net decrease in forested land, grassland, and unutilized land use.

Chord diagram illustrating land-use type transfers by stage, 2005–2020.
Transfer matrix of land-use changes in Linhe District, 2005–2020 (Unit: km2, %).

Over different time intervals, the changes unfolded as follows. From 2005 to 2010, Linhe District experienced a total land-use change area of 631.55 km2, marked by a substantial net increase in arable land and a notable net decrease in grassland. The period from 2010 to 2015 was relatively stable, characterized by net transfers of arable land and unutilized land, along with a net increase in grassland and urban–rural and residential land. The period from 2015 to 2020 witnessed changes in an area of 626.77 km2, constituting 26.58% of the study area. These shifts primarily involved net transfers from arable and unused land, coupled with net increases in grassland and urban and rural residential land. The primary transfers from cultivated land were from grassland to urban and rural residential land, accounting for 40.71% and 45.49%, respectively. Unutilized land primarily transitioned to arable land, covering an area of 30.87 km2.
These results highlight that the rapid urbanization and industrialization in Linhe District over the past 15 years have been the primary drivers of the expansion of urban and rural residential land use. The increase in arable land is associated with national policies aimed at safeguarding arable land and providing agricultural subsidies. The reduction in unutilized land can be attributed to efforts to mitigate arable land salinization and desert management in the Ulaan Tuk Township.
Spatial distribution characterization
The spatial distribution changes of different land-use types in Linhe District from 2005 to 2020 are depicted in Figure 3. The notable observations include the following:
A decrease in arable land concentration in the southeast of Shuanghe Township. A decrease in woodland and grassland primarily in the southern region of Shuanghe Township. An increase in water was predominant in the southern part of Wolverine Hill Township and the southwestern section of Shuanghe Township. The expansion of urban and rural areas, along with an increase in land use for residential purposes, was observed primarily in the Chengguan, Shuguang, Bayi, and Ulantuk townships. This expansion reflects the expansion of the central urban area toward the southwest and northeast. The decrease in unused land was primarily distributed in the northeastern part of Shuanghe Township, Bayi Township, the southern region of Wolverine Mountain Township, and the central part of Ulantuk Township.

Spatial distribution of land-use type changes in Linhe District, 2005–2020.
In summary, over the past 15 years, Linhe District has experienced increases and decreases in various land-use types, often concentrated in specific areas. The expansion of urban and rural residential land as well as the reduction in arable land and grassland suggests the influence of urban development on the contraction of arable and grassy spaces. Additionally, the protection of watersheds has resulted in the utilization of arable and unused land.
Characterization of spatial and temporal variations in the RSEI
Table 3 presents the mean values of the RSEI in the Linhe District for 2005, 2010, 2015, and 2020 that were 0.5371, 0.6004, 0.5085, and 0.6897, respectively. In 2020, the RSEI exhibited a significant improvement of 0.1466 compared to that in 2005, representing a 27.29% increase. Notably, the mean values of the NDVI and WET exhibited an overall increasing trend, whereas those of the NDBSI and LST exhibited an overall decreasing trend over the study period. This trend indicates that the positive influence of greenness and humidity on the enhancement of ecological environment quality has progressively increased over the last 15 years, whereas the adverse impacts of dryness and temperature on ecological environment quality have weakened.
Changes in mean values of ecological factors and RSEI indicators in Linhe District, 2005–2020.
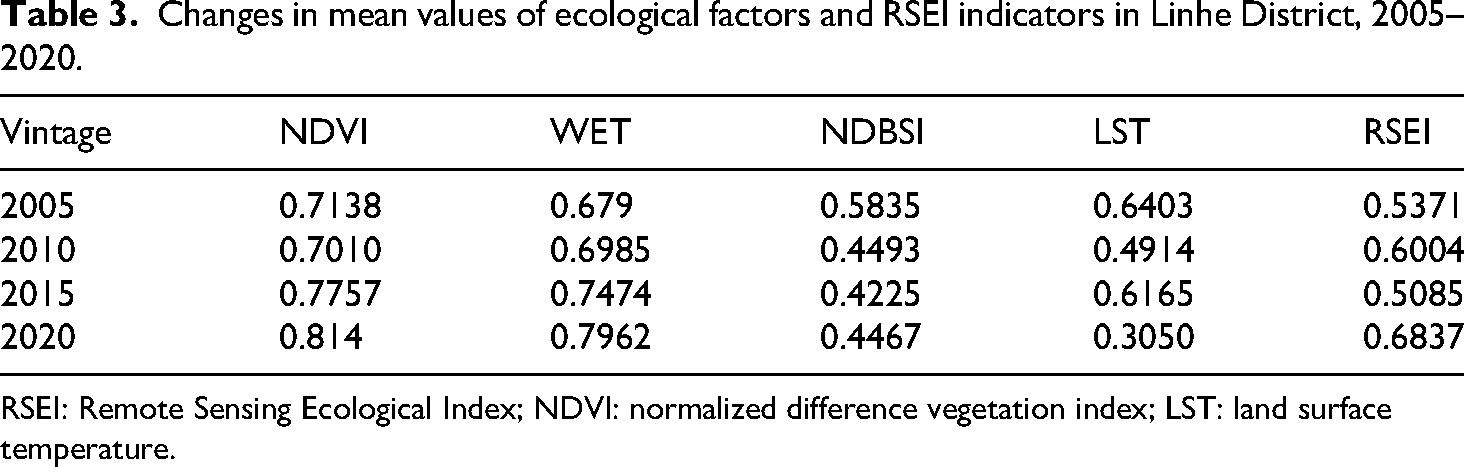
RSEI: Remote Sensing Ecological Index; NDVI: normalized difference vegetation index; LST: land surface temperature.
Characterization of spatial and temporal variations at different RSEI levels
To provide a comprehensive understanding of the ecological environment quality in Linhe District and delve deeper into the analysis of RSEI and its reflection of ecological environment quality, the RSEI values were categorized into five levels using the equal spacing method as outlined in the “Technical Specification for the Evaluation of Ecological Environment Condition.” 35 These levels included poor (0, 0.20), worse (0.2, 0.4), average (0.4, 0.6), good (0.6, 0.8), and excellent (0.8, 1). The respective areas for each level were calculated and the results are presented in Table 4.
Area changes in remote sensing ecological index levels in Linhe District, 2005–2020 (km²).

For the study period, there was a noticeable decrease in the area covered by the RSEI poor and poor grades, and their combined proportion was the smallest. The maximum proportion of poorer grades was observed in 2005, accounting for 21.85% of the total area. The area covered by the average grade initially increased, reaching a peak of 54.99% in 2015, but subsequently decreased to the lowest value of 18.46% by the end of the study period. Good grades exhibited a fluctuating pattern, with an initial increase to a maximum of 45.60% in 2010, followed by a decline to 35.75% in 2020. The excellent grade exhibited an initial decrease, followed by an increase from 3.90% in 2005 to a peak of 34.80% in 2020. These trends indicate an expanding range of excellent grades of ecological and environmental quality over the past 15 years.
The spatial distribution of the ecological environment quality is depicted in Figure 4, revealing that the areas classified as possessing poor and worse RSEI grades exhibited a pattern of contraction from north to south. These areas are primarily located in the central urban region of Linhe District, Bayi Township, and Ulantuk Town that are densely populated with strong economic activities, a high density of buildings, and a significant amount of unutilized land, contributing to poor ecological environment quality. The general RSEI grade in the study area from 2005 to 2015 was distributed across the entire territory, whereas it contracted to Shuanghe Town from 2015 to 2020. Over the course of 2005–2015, the general RSEI grade spanned the entire study area; however, during 2015–2020, its range decreased to Shuanghe Town.
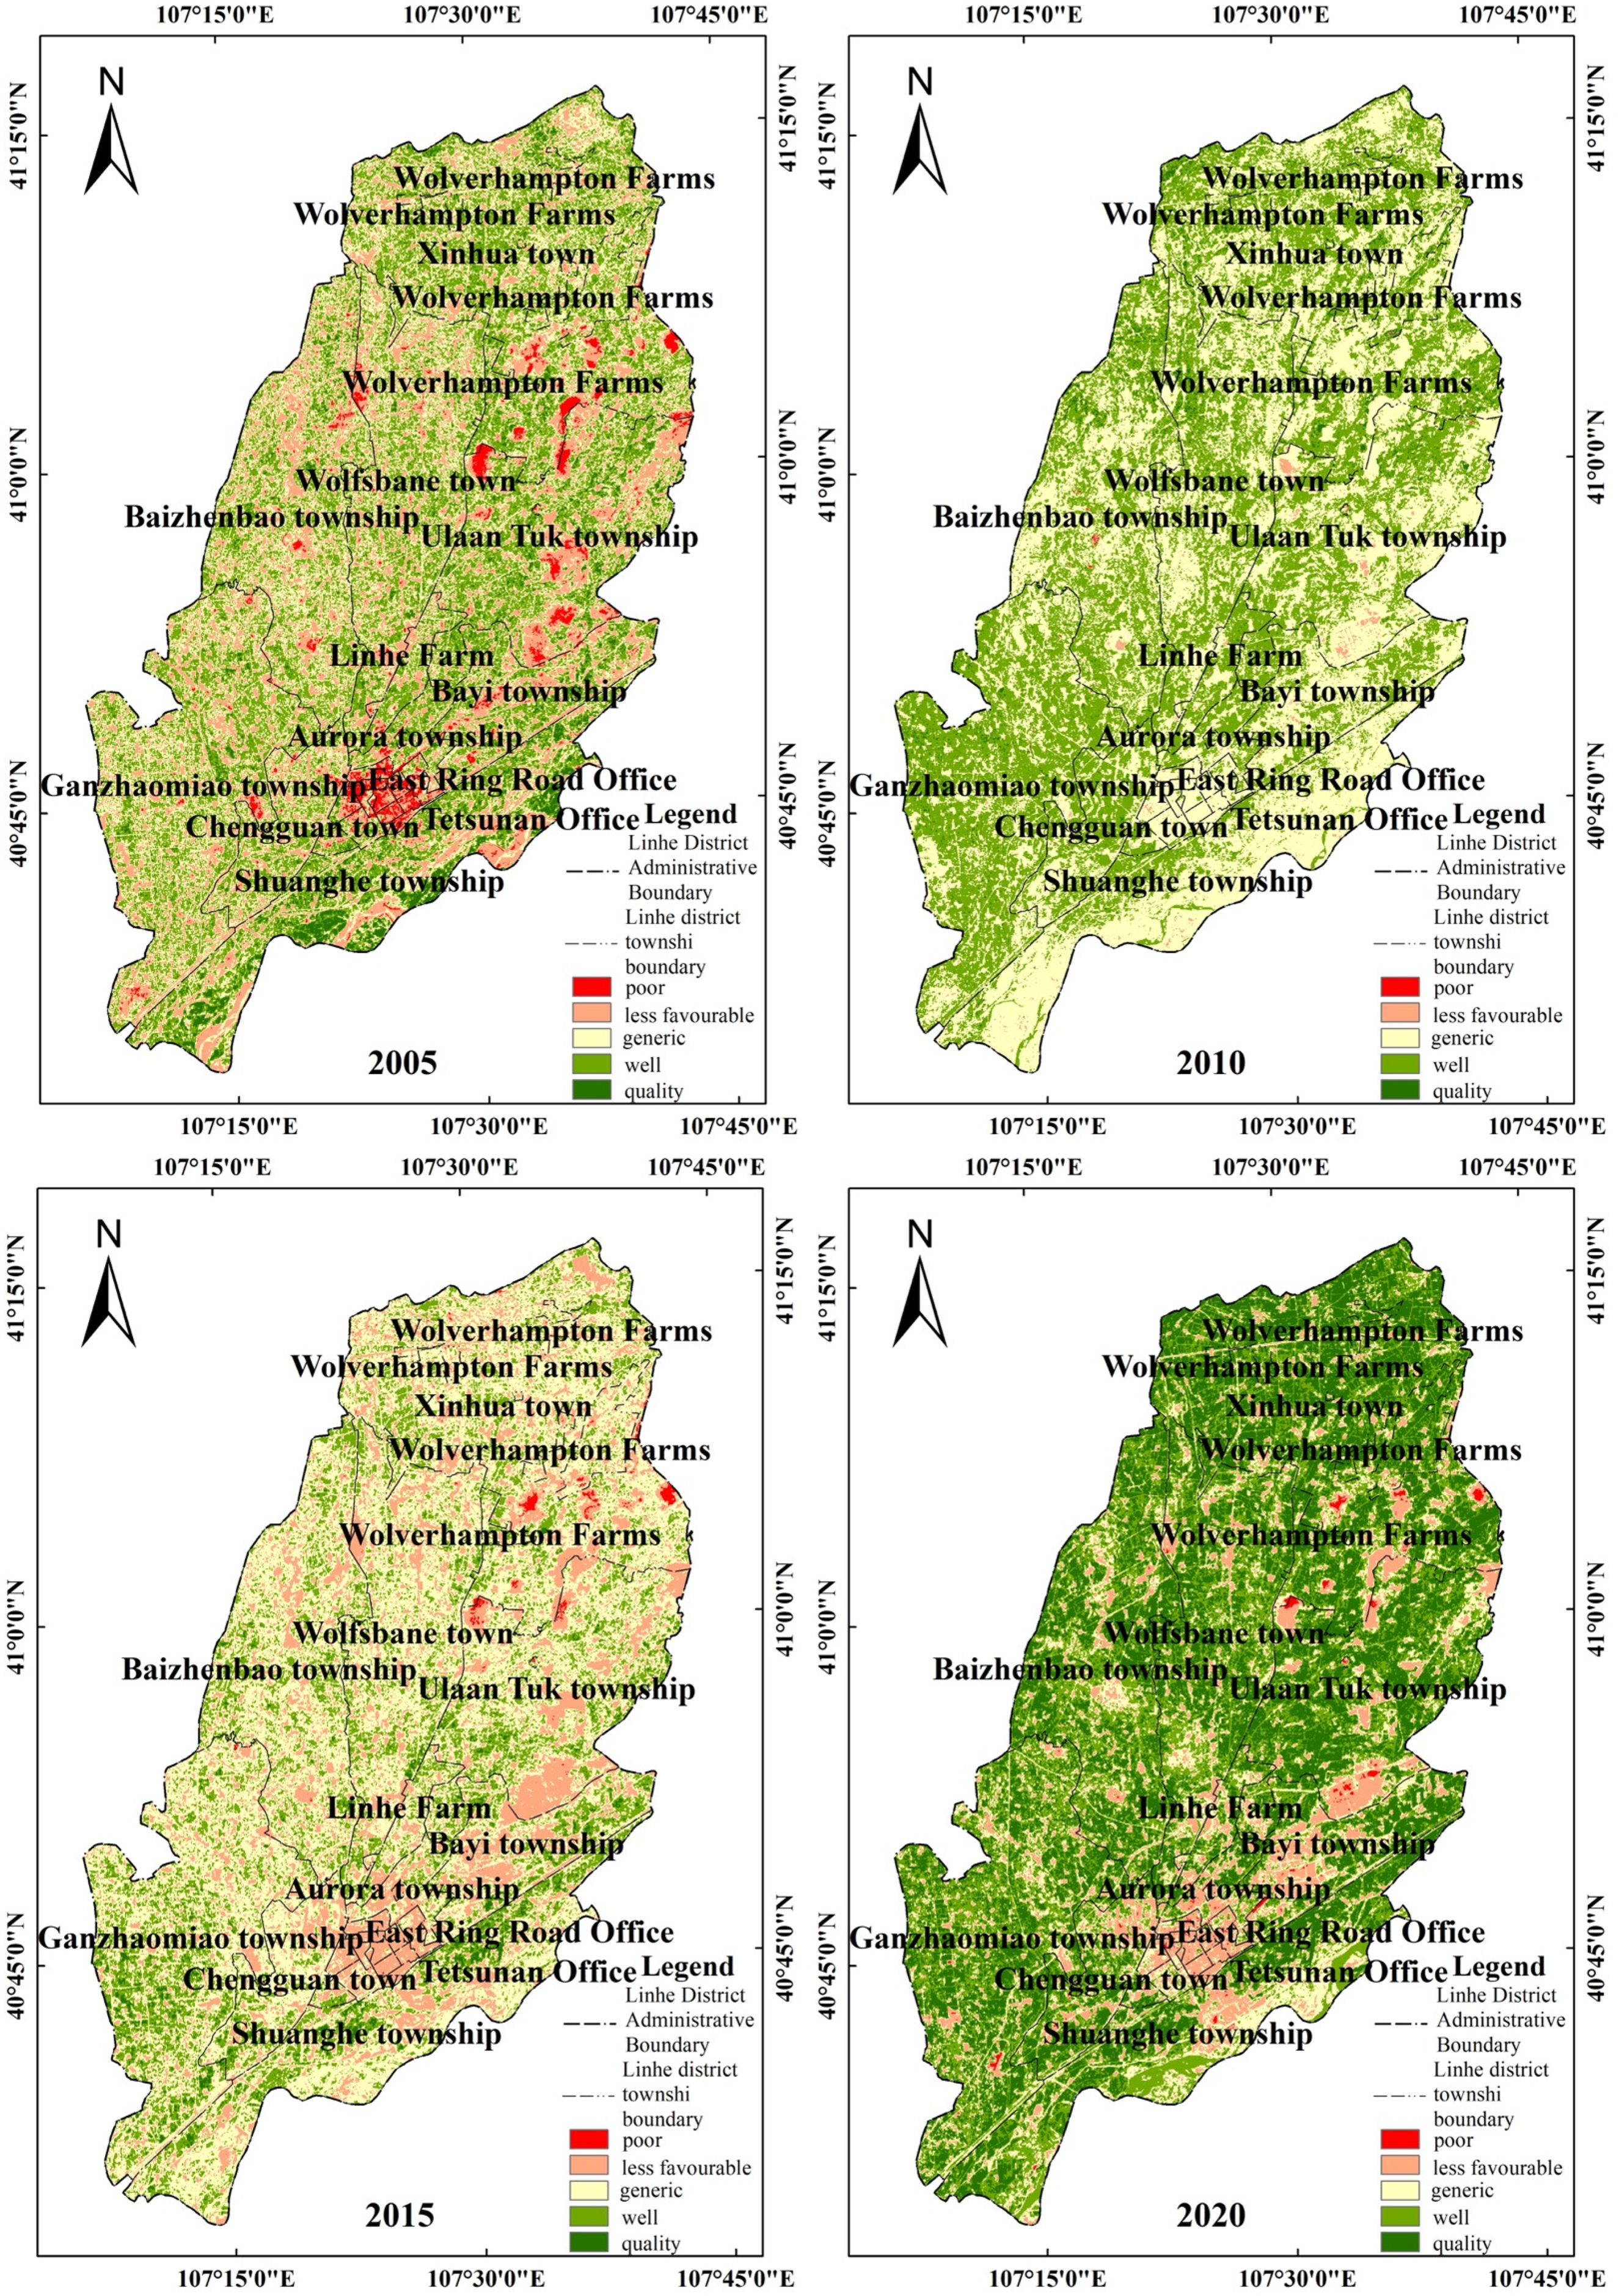
Changes in RSEI ratings for Linhe District, 2005–2020.
Detection of changes at different levels of the RSEI
To gain a deeper understanding of the spatial and temporal characteristics of ecological environment quality in the study area, we utilized the difference method to subtract the results of the four phases of the two adjacent RSEI index classifications. This allowed us to generate ecological environment quality change maps for the four change phases of Linhe District in 2005–2010, 2010–2015, and 2015–2020, and for the overall period of 2005–2020 (see Figure 5). We classified the changes in the ecological environment quality in Linhe District into three categories that included improvement, no change, and degradation. We further refined the improvement and degradation categories into four levels (I, II, III, and IV, and +I, +II, +III, and +IV, respectively). No changes were observed after 0. A larger positive difference value indicates a greater degree of improvement in the ecological environment quality, whereas a larger negative difference value signifies a greater degree of degradation in ecological environment quality. The results of the difference analysis are presented in Table 5 and Figure 5.

Difference in changes in ecosystem quality by stage in the study area, 2005–2020.
Changes in area and proportion of ecological environment quality status in different time periods in Linhe District (unit: km2, %)

From a quantitative perspective, changes in the ecological environment quality in Linhe District exhibited a mix of improvement and degradation trends from 2005 to 2020. Approximately 6.89% of the area experienced degraded ecological quality, whereas 28.14% experienced no significant changes in the ecological environment. In contrast, 64.96% of the area demonstrated a substantial improvement in ecological environment quality. Specifically, the three phases of 2005–2010, 2015–2020, and the overall period of 2005–2020 exhibited improvements in ecological environment quality, whereas 2010–2015 exhibited degradation in ecological environment quality, albeit with fewer areas experiencing a high degree of improvement.
Regarding spatial changes, the distribution of areas with improved and degraded ecological environment qualities over the past 15 years exhibited significant differences. The improved areas were primarily concentrated in the vicinity of the Yellow River Basin, encompassing locations such as Shuanghe Township, Ganzhaomiao Township, Ulantuk Township, and Wolf Mountain Farm. Conversely, degraded areas were concentrated in the central urban area of Linhe District, southern Bayi Township, and southern Ulantuk Township.
Ecological quality response to land-use change
Analysis of remotely sensed ecological indices for different land-use types
Land is a multifunctional entity, and various land-use types possess distinct life, production, and ecological functions. Land-use types with strong ecological functions enhance the ecological environment, whereas those with strong production and life functions exert a relatively weaker impact on ecological environment improvement. Some land-use types can impede the enhancement of the ecological environment quality. Changes in land-use types not only alter surface cover but also affect ecological factors such as greenness, humidity, dryness, and surface temperature, ultimately leading to changes in ecological environment quality. 36 The land-use data for the four periods (2005, 2010, 2015, and 2020) were overlaid with the corresponding year's remote sensing eco-index raster data to obtain the RSEI values for the six different land-use types in different years. The results of this analysis are presented in Table 6 and Figure 6.

Changes in RSEI by land-use type in Linhe District, 2005–2020.
RSEI values for different land-use types in Linhe District, 2005–2020.

RSEI: Remote Sensing Ecological Index.
According to Table 6 and Figure 6, the mean RSEI values for different land-use types followed the overall order: cropland > forest land > grassland > water > urban and rural residential land > unutilized land and 2020 > 2010 > 2005 > 2015.
In 2005, forestland exhibited the largest area, reaching its maximum value during the study period, and this resulted in a higher RSEI compared to that of other land types. The high humidity in the water area contributed to a high RSEI value, with an average of 0.5317 during the study period. The ecological environment quality of the water areas was second only to that of cultivated land, forestland, and grassland.
Furthermore, the ecological and environmental statuses of urban and rural residential land were slightly better than those of unutilized land.
Eco-environmental quality response to land-use change
To further understand the impact of land-use changes on ecological environment quality, we analyzed land-use transfer data and RSEI level data from 2005 to 2020 for the study area. We categorized the types of land-use transfers that accounted for a larger area in the ecological environment quality improvement and degradation areas, quantitatively reflecting the ecological contributions of these land-use types. 37
According to the results presented in Table 7, in the area of ecological environment improvement, the impact of transfer changes between different land-use types on ecological environment quality is complex. The conversion of grassland to arable land was the highest (34.54%) from 2005 to 2010. This was due to the observation that arable land became the primary land resource in the Linhe District, where crops such as maize, wheat, and sunflowers flourished during the remote sensing image collection period. The conversion of urban and rural residential land into arable land was the second-highest, with an ecological contribution of 22.97%. Linhe District, located in the crop cultivation belt at 40° north latitude, focuses on land improvement projects, centralizing and expanding arable land to promote high-efficiency agriculture.
Proportion of land-use change area in ecological environment quality improvement areas in Linhe District, 2005–2020 (unit: %).

The conversion of unused land to grassland contributed 7.06% of the ecological improvement. Unused land primarily consists of sandy, saline, and bare land with higher surface temperatures and dryness than grasslands with vegetation cover. Surface temperature and dryness were negatively correlated with RSEI, whereas the degree of vegetation cover was positively correlated with RSEI.
From 2010 to 2015, the conversion of arable land to watersheds was the most significant contributor to ecological improvement, accounting for 43.00% of the total area. From 2015 to 2020, the conversion of cultivated land to grassland and unutilized land to grassland exerted a more substantial positive influence on ecological environment quality, covering 41.36% and 21.71% of the total area, respectively.
Overall, the area in Linhe District where ecological environment quality improved from 2005 to 2020 was 64.96 km2, as shown in Table 8. The mutual conversion between cropland and grassland, urban–rural and residential land to cropland, and urban–rural and residential land to forest land had more significant impacts on ecological improvement, with area shares of 17.38%, 17.34%, 10.84%, 10.91%, 9.91%, and 9.91%, respectively. The improvement in ecological environment quality resulting from the conversion of urban and rural residential land to forest land has been attributed to land improvement and ecological restoration projects along the Yellow River corridor in Linhe District over the past 15 years. These initiatives increased vegetation cover and exerted a positive impact on the quality of the ecological environment.
Proportion of land-use change area in ecological environment degradation in Linhe District, 2005–2020 (unit: %).

Ecological response to land-use change in areas with degraded ecological quality
The ecological responses to land-use changes in areas experiencing degradation of ecological environment quality are summarized in Tables 5 and 8. The analysis revealed that in Linhe District from 2005 to 2020, the area suffering from ecological environment degradation amounted to 161.89 km2. The proportions of these areas were 29.11%, 22.57%, and 10.39%, respectively.
When examining the different periods from 2005 to 2010, the conversion of grassland to cropland and that of unused land to cropland accounted for 48.44% and 15.60%, respectively.
From 2015 to 2020, the conversion of arable land to grassland became the dominant factor in the degradation of ecological environment quality, representing 37.50% of the total area.
Discussion
The excellent RSEI grade exhibited an expanding trend from Shuanghe Town at the beginning of the study, covering the entire territory. This indicates a significant improvement in the ecological environment quality of the study area over the past 15 years, attributed to Linhe District's continuous efforts in land remediation, arable land salinization improvement, and the “Three Norths” project during the period of 2015–2020.
The ecological quality of the cultivated land in 2010, 2015, and 2020 years was better than that of the forestland and grassland. This was due to the observation that cultivated land was primarily dominated by crops such as wheat, corn, and sunflower, and the remote sensing imagery was collected in July–August during the peak growth period of crops. During this time, cultivated land exhibited sufficient irrigation, a larger canopy, and higher surface greenness and humidity than that of forestland and grassland. Moreover, surface greenness and moisture were higher than those of forestland and grassland, and the surface dryness and temperature were lower than those of forest and grassland. Additionally, the overall proportion of woodland and grassland in the study area was relatively small and sporadically distributed, contributing to the slightly better ecological status of arable land in July–August during the study period compared to that of woodland and grassland.
During the period of 2015–2020, the conversion of arable land to watersheds was the most significant contributor to ecological improvement. This was primarily due to the positive impact of increased moisture in the watershed on the ecological environment quality. From 2005 to 2020, Linhe District suffered from ecological environment degradation. Two key land-use changes significantly contributed to this degradation, including the conversion of cropland to grassland and the conversion of cropland and grassland to urban–rural and residential land.
During the period of 2015–2020, the conversion of grassland to cropland has resulted in slower improvement of the ecological environment. Grasslands and unused lands typically exhibit poor soil quality and fertility. After conversion to croplands, measures such as weed elimination, sufficient irrigation, organic fertilizer application, and soil tilling are necessary to improve the soil quality. Consequently, the quality of the ecological environment has deteriorated slightly.
From 2010 to 2015, the conversion of arable land to urban-rural and residential land, as well as grassland expansion due to urban and rural residential land growth, contributed to the degradation of ecological environment quality. Urbanization has led to the development of impermeable surfaces such as concrete and steel buildings, asphalt highways, and parking lots. These changes not only replaced the original natural ecosystem, increasing surface temperatures and causing surface drying, but also negatively impacted green spaces, vegetation, and water runoff.
From 2015 to 2020, the conversion of arable land to grassland became the dominant factor in the degradation of ecological environment quality. This degradation can be attributed to arable-land salinization that reduces soil quality and fertility, inhibits crop growth, diminishes vegetation cover, and accelerates ecological deterioration.
The conversion of arable land into urban–rural and residential land became the dominant factor in the degradation of ecological environment quality due to industrialization driving an increase in impervious surfaces in urban and rural areas, industrial and mining zones, and residential areas. These impervious surfaces possess low specific heat capacities that result in increased LSTs. Compared to vegetated land, impervious surfaces experience higher temperature increases when absorbing equal amounts of solar radiation. Additionally, the absence of vegetation and transpiration further increases surface temperatures, making it significantly warmer than other land types. Consequently, the expansion of urban and rural areas, industrial zones, mining areas, and residential land has had more pronounced negative impacts on the ecological environment.
The poor ecological environment quality of urban and rural residential land is attributed to the rapid promotion of urbanization and industrialization in Linhe District. This has led to the expansion of construction land, with the built-up area of Linhe District increasing from 29 km2 in 2005 to 99.44 km2 in 2020, marking a 3.43-fold increase over the past 15 years. The expansion of built-up areas has altered the urban subsurface, resulting in an increase in impermeable surfaces and other heat-storage bodies. These changes can absorb a significant amount of solar radiation and heat from the surroundings, and this, in turn, contributes to the “urban heat island” 38 effect. Studies indicate a negative correlation between the extent of constructed land and improvements in ecological environment quality. 39
In summary, the conversion of different land-use types can affect ecological environment quality, and this study's results align with some scholars’ research on landscape ecological risks and climate change caused by land-use/cover change on the Mongolian Plateau. 40
Limitations of the study
In terms of research methods, this study utilized four phases of Landsat satellite data from July to August to build a remote-sensing ecoindex. Greenness, humidity, dryness, and temperature are closely related and can directly reflect the summer ecological environment quality of the study area. However, selecting remote-sensing data across four seasons and more time phases is difficult. Therefore, the assessment of the annual ecological environment quality of the study area is somewhat generalized.
The article centers on ecological quality shifts from land-use changes, focusing solely on this aspect. Future research should incorporate analyses of socioeconomic impacts for a comprehensive, multiangled study.
Conclusions
Our findings demonstrate that land-use changes can lead to both positive and negative feedback loops in terms of ecological environment quality. Notably, the conversion of urban–rural and residential land into arable land and forest land exerted a significant positive impact on ecological environment quality. Conversely, the conversion of arable land and grassland into urban–rural and residential land exerted a more substantial negative impact. Consequently, it is crucial for the study area to implement prudent control measures for the expansion of urban–rural and residential land and other construction activities. Simultaneously, greater efforts should be directed toward the development of key ecological projects such as the “Three Norths” initiative to augment forest and grassland coverage. This multifaceted approach contributes to the establishment of a robust ecological security barrier in northern China.
Footnotes
Acknowledgments
I would first like to thank my supervisor, Yu-Feng Zhang, whose expertise was invaluable in formulating the research questions and methodology. Your insightful feedback pushed me to sharpen my thinking and brought my work to a higher level. I would particularly like to acknowledge my team members, Huyuan Liu, for his wonderful collaboration and patient support. We appreciate Kuan Li's feedback on the manuscript and his suggestion to incorporate remote sensing data for the research direction. Additionally, I would like to thank my parents for their wise counsel and sympathetic ear. You are always there for me. Meanwhile, I extend my deepest respect and gratitude to my parents. When I encountered research bottlenecks, you patiently listened to my confusion and offered advice and encouragement. When I was exhausted from pressure, your warm words revitalized me. Thank you for your years of care, giving me the courage to pursue my dreams. We would like to thank the anonymous reviewers for providing constructive suggestions.
Ethical considerations
Before participating in the study, all authors obtained informed consent. The authors were informed in detail about the purpose of the study, the procedures, the potential risks and benefits, and their right to withdraw from the study at any time.
Author contributions
Yuting Zhao: writing—review and editing, investigation, and formal analysis; Yufeng Zhang: methodology, review, and editing; and Huyuan Liu: software and data curation.
Funding
The authors disclosed receipt of the following financial support for the research, authorship, and/or publication of this article: Research Special Fund for Higher Education Institutions in Inner Mongolia Autonomous Region on “Strengthening the Construction of China's Northern Important Ecological Security Barrier” (Grant No. STAQZX202319); Natural Science Foundation Project of Inner Mongolia Autonomous Region (Grant No. 2024MS04013); and Inner Mongolia Education Department Teaching Reform Project on Graduate Course Ideological and Political Innovation Practice Research (Grant No. JGSZ2023013).
Declaration of conflicting interests
The authors declared no potential conflicts of interest with respect to the research, authorship, and/or publication of this article.
Data availability statement
Remote sensing image data and Digital Elevation Model elevation data can be downloaded at the website: http://www.gscloud.cn/. The land-use type data for the study area in the years 2005, 2010, 2015, and 2020 can be downloaded from the website: ![]() .
.