
Abstract
The solid waste generated by the waste sanitary ware (WSW) sector is of considerable magnitude on a global scale. Recycling ceramic waste is an essential practice that ensures its proper disposal. Therefore, the objective of this research endeavor was to investigate the effects of replacing sand with WSW on different characteristics of foamed concrete (FC), such as its thermal properties, transportability, freshness, and mechanical strengths. A range of replacement rates, ranging from 5% to 25%, was considered. The utilization of WSW replacements increases the initial and final setting times, along with the densities of the mixtures, according to the test results. Nevertheless, the slump of the fresh test decreases. Significant improvements were observed in the mechanical characteristics when the replacement ratio was established at 10%. Furthermore, the results of the scanning electron microscopy evaluation and pore distribution analysis indicated that the performance of FC containing up to 10% WSW was superior as a filler for pores. Also, the addition of WSW resulted in a decrease in sorptivity, porosity, and water absorption. Nevertheless, the thermal conductivity of FC was enhanced. Nevertheless, considering the comprehensive examination, the most optimal approach to manufacturing environmentally friendly FC may involve replacing 10% of WSW.
Keywords
Introduction
The increasing emphasis on environmental sustainability has spurred considerable interest in identifying alternative, eco-friendly materials across numerous industries, especially within the building sector. 1 The necessity to diminish dependence on raw materials and reduce waste has catalyzed study into the feasibility of recycled aggregates as viable substitutes in concrete manufacturing. The construction industry, as a significant consumer of natural resources, plays a crucial role in mitigating its environmental impact. 2 The integration of recycled elements, including granite and various industrial byproducts, diminishes the utilization of natural resources and bolsters the sustainability of construction materials. 3 A primary advantage of utilizing recycled aggregates in concrete is their capacity to enhance the mechanical and durability characteristics of the material. In recent decades, various research has examined the viability and efficacy of recycled aggregates in concrete. Recycled concrete aggregates, waste glass, and rubber have been examined for their capacity to substitute conventional aggregates in concrete formulations. 4 These materials have exhibited favorable outcomes, with enhancements in specific mechanical attributes including compressive strength and workability, as well as superior performance regarding thermal insulation, soundproofing, and impact resistance. 5 The durability potential of recycled aggregates is a crucial topic for investigation.
Durability is a critical determinant of concrete's long-term performance, particularly under severe environmental conditions. 6 Concrete constructions experience multiple forms of deterioration, such as chloride-induced corrosion, sulfate assault, and freeze-thaw cycles. 7 The durability of concrete is a crucial factor in material selection for its manufacturing, as it directly influences maintenance expenses and the lifespan of concrete structures. This article highlights the important findings of the study on the durability evaluation of bio-based self-compacting sand concrete incorporating recycled granite aggregate waste in relation to chloride and sulfate attacks. 8 The research underscores the capacity of recycled granite aggregate to improve concrete's resistance to chloride and sulfate assaults, which are prevalent causes of concrete deterioration. These findings are pertinent to our research, since we are examining the utilization of waste sanitary ware (WSW) as a fine aggregate in foamed concrete (FC). Similar to granite, sanitary ware is a resilient material that may demonstrate comparable advantageous features when recycled and integrated into concrete.
The integration of recycled aggregates into concrete formulations can enhance both the mechanical and durability characteristics of concrete while also advancing sustainability objectives in the building sector. 9 Substituting natural aggregates with recycled materials diminishes the demand for raw virgin materials, thereby conserving natural resources and mitigating the environmental impact of quarrying operations. Moreover, recycling industrial waste materials, including discarded sanitary gear, can diminish the volume of garbage directed to landfills, so enhancing environmental conservation.
FC is a cement mortar that consists of air bubbles, cement, water, and filler that were created by adding a foaming agent that excludes coarse material. The material possesses several benefits, including desirable compressive strength, airborne sound insulation, fire resistance, low weight, effective thermal insulation, high porosity, excellent fluidity, and reduced aggregate usage, all while being cost-effective. Practically, FC is extensively utilized in various applications such as lightweight construction blocks, roof insulation, floor insulation, bridge padding, insulated wall panels, partition blocks, road fill, walls, and panels in several nations.10-13 Additionally, there seems to be a significant shift regarding the exploration of alternative materials for concrete to achieve sustainable development in terms of social, economic, and environmental aspects. This is due to the irreversible implications of employing large amounts of natural resources in concrete production, as well as the negative environmental and social impacts that arise from the consumption of these resources. 14 To decrease the use of natural resources, one approach is to employ waste materials and industrial byproducts, such as ceramic waste, fly ash (FA), ground blast furnace, slag, and silica fume (SF), as replacements for aggregates or cement in cement-based composites. 15 Ceramic waste, such as those found in buildings and demolition, account for the biggest proportion (54%) of overall waste in this industry. In fact, building and demolition waste alone represents the largest percentage (36%) of global waste. It is important to note that ceramic wastes are nonbiodegradable. 16 Failure to utilize these resources may result in significant harm to the water and soil, as well as the occurrence of air pollution. These compounds are used as additives in filler, pozzolanic, or substitution applications within FC. Due to their high silica concentration, they actively participate in the pozzolanic reaction with calcium hydroxide. This, in turn, enhances the performance of concrete by producing additional compounds of calcium silicate hydrate gel. Additionally, these materials offer visible environmental advantages, such as reduced CO2 emissions, and are economically beneficial.17-19
Sanitary wares refer to a category of ceramic products specifically designed for use in bathrooms, including accessories, bathtubs, urinals, bidets, pedestals, sinks, toilets, etc. The production process involves the utilization of raw materials including feldspar, kaolin, and white clay, which can be either sodium- or potassium-based. These materials undergo combustion at temperatures ranging from 1250°C to 1290°C, resulting in the release of all chemically bonded water and the disruption of the crystalline structures of the component phases. The outcome entails the creation of an amorphous aluminosilicate phase and novel crystalline phases. 20 This type of clay has considerable variation in its chemical composition, but it consistently contains a significant amount of Al2O3, SiO2, and a little amount of alkalis and iron. Finely powdered calcined clays can serve as pozzolanic additives for cements. Based on statistics from the ceramics sector, the global production of sanitary wares has experienced a significant rise of 61.3%, rising from 216.6 to 349.3 million units within 2004–2014. This corresponds to an annual growth rate of 4.9%. 20 The discarded items, which are the outcome of faulty goods, account for around 7–8% of the whole production.
One method of managing WSWs is by using them in the manufacturing of building materials and construction. Medina et al. 21 conducted an analysis for WSW and confirmed the absence of any hazardous substances that might be used in cement formulations. Additionally, the impact of partial SW replacement on the hydration kinetics of cementitious pastes and their rheological characteristics was investigated. 22 In their study, Ferrara et al. 23 assessed the feasibility of using ceramic dust (CD) waste as a substitute for a portion of the cement and/or sand in paste and mortar. Reig et al. 24 examined the pozzolanic activity of WSW in Portland cement (PC) systems to explore their potential as novel binders via alkaline activation.
While numerous industrial byproducts and waste materials have been examined as substitutes for conventional aggregates in FC, the potential of WSW remains significantly underexplored. This study examines the neglected waste stream of discarded sanitary ware, which poses a considerable environmental issue due to its nonbiodegradable characteristics and buildup in landfills. This research introduces the utilization of WSW as a fine aggregate in FC, addressing two significant challenges which are waste management and the sustainability of the building sector. WSW possesses unique characteristics namely its composition, durability, and density that have not been well evaluated in relation to FC. This work addresses the knowledge gap by examining the effects of incorporating WSW on the characteristics of FC. This fosters the advancement of sustainable, economical building materials and endorses the fundamental principles of a circular economy. The findings of this study are anticipated to encourage additional research and development regarding the utilization of unconventional waste materials in construction, providing both environmental and economic advantages by decreasing the reliance on virgin materials and alleviating the disposal burden of sanitary waste.
In this study, the authors’ research examines the potential of using aggregates derived from WSW as a replacement for natural sand in FC. The fresh characteristics of mixes were assessed by the execution of a slump test. The evaluation also includes the measurement of density and time at various stages, including dry, demould, and wet conditions. The study examined the transport characteristics of FC, specifically focusing on sorptivity, water absorption, and porosity at different stages of curing. The study examined the mechanical characteristics of FC, particularly the flexural, splitting tensile, and compressive strengths, as well as their ultrasonic pulse velocity (UPV) at 7, 28, and 90- days. Additionally, the study focused on examining the thermal characteristics, modulus of elasticity, and drying shrinkage (including specific heat capacity, thermal diffusivity, and thermal conductivity) of FC. The characteristics of FC were investigated by analyzing the pore structure and morphology of specimens having different percentages (0%, 5%, 10%, 15%, 20%, and 25%) of WSW replacement by mass after 28 days. This analysis was conducted using mercury intrusion porosimetry (MIP) and scanning electron microscopy (SEM).
Material and methods
Raw materials
The essential components required to produce FC are a protein-based foaming agent, clean, potable water, fine sand, and cement.
Chemical compositions of OPC and WSW.

Note: WSW: waste sanitary ware; OPC: ordinary Portland cement.
OPC, fine sand and WSW physical properties.

Note: WSW: waste sanitary ware; OPC: ordinary Portland cement.

Grading curve for sand and WSW in line with ASTM C33-03.

Production flow chart for waste sanitary ware powder.
FC mix design
In this investigation, six mixtures were formulated by substituting fine river sand with WSW powder. The WSW powder was replaced in ratios of 5%, 10%, 15%, 20%, and 25% by the weight of fine river sand. To accomplish the study goals, FC mixtures are formulated with densities of 1300 kg/m3. Furthermore, the cement-to-sand ratio of 1:1.5 and the water-to-cement ratio in all mixtures are consistently maintained at 0.33. Table 3 displays the ratios of various mixtures. The mixtures were categorized as follows: The initials WSW denote waste sanitary ware, and the subsequent numbers indicate the content utilized in terms of weight percentage.
FC mix proportions.

Note: FC: foamed concrete; WSW: waste sanitary ware; OPC: ordinary Portland cement.
Preparation of FC
By regulating the quantity of foam in the mortar slurry, a consistent dry density of 1300 kg/m3 was achieved. The chosen water-to-cement ratio was 0.5%, and the chosen sand-to-cement ratio was 1.5:1. This study examines the varying substitution percentages of WSW in sand, primarily focusing on the percentages of 0%, 5%, 10%, 15%, 20%, and 25%. The FC mixing process is shown in Figure 3 and describe as follows:
The dry mixture consisting of ordinary PC (OPC), fine sand, and WSW was homogenized for a duration of 3 min. Subsequently, introduce the water into the mixed dry ingredients and proceed to blend for an additional duration of 3 min. Perform spreadability tests on the mortar slurry mixture to determine its workability. The stable foam was generated using the Portafoam TM-2 machine. The stable foam was generated using the Noraite PA-1 protein foaming agent. In the subsequent step, the foam was introduced into the cement slurry, as depicted in Figure 4. The mixture was then homogenized for a duration of 4 min until the absence of discernible foam within the mixer. The homogenous mixture of FC was subsequently introduced into steel molds. The specimens of FC underwent moisture curing until they reached the appropriate stage for testing.

Mixing process of FC. (a) mixing of OPC, WSW and sand. (b) spread ability test on mortar. (c) preparation of stable foam. (d) Adding foam into mortar. (e) Uniform FC mix. (f) FC in steel molds.
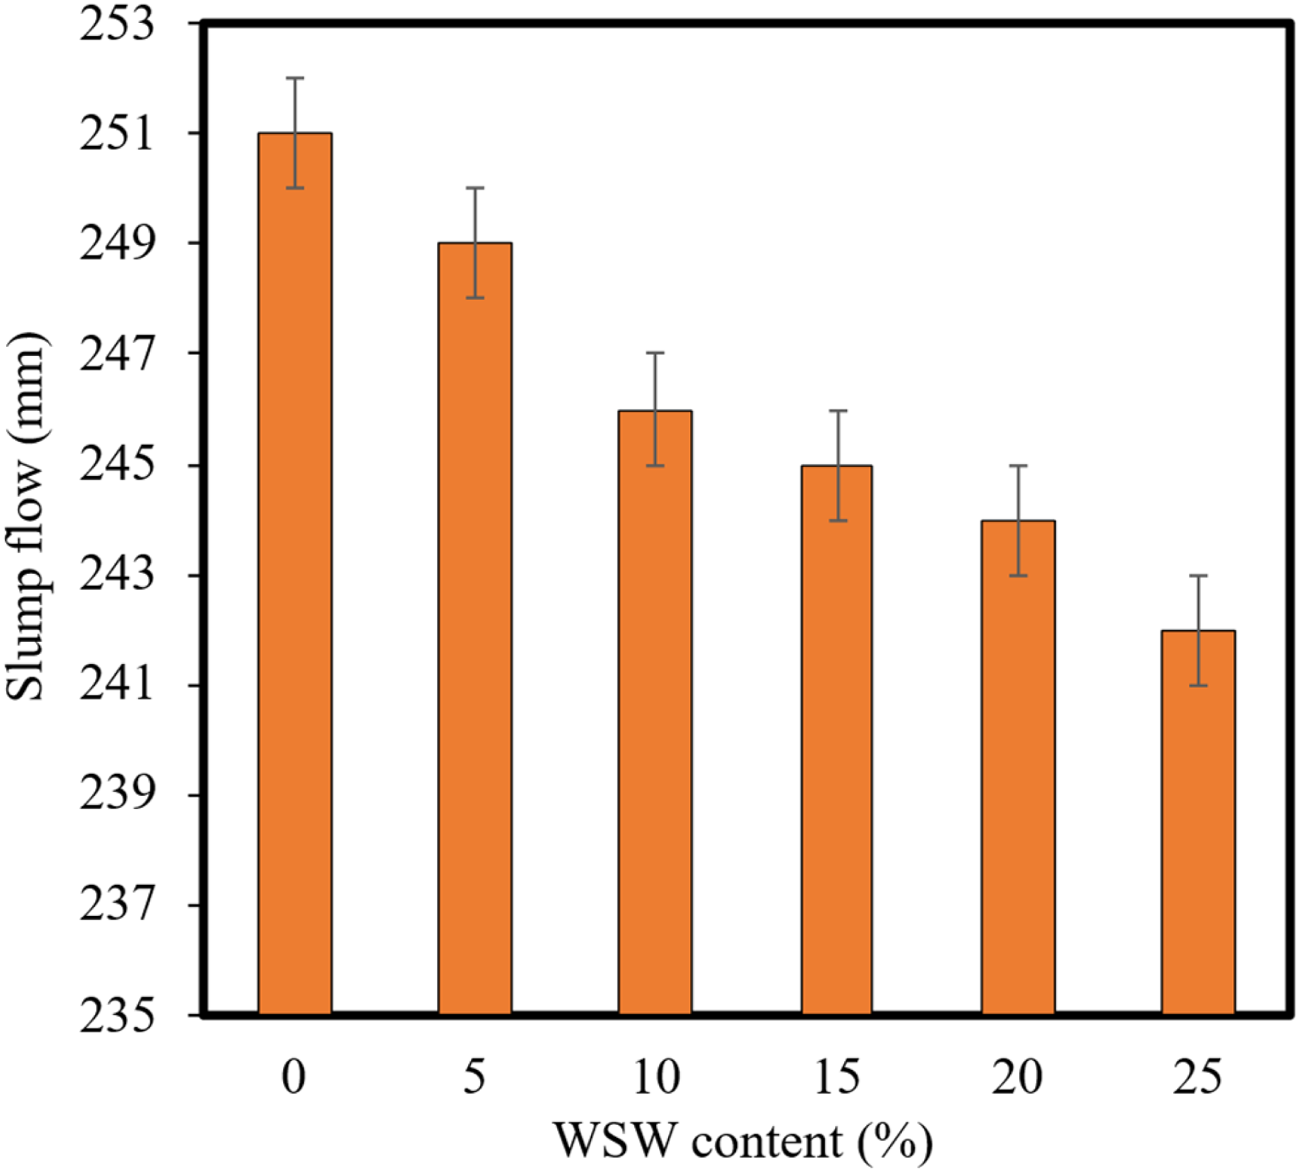
Slump flow of FC containing various proportions of WSW as sand replacement.
The use of WSW percentages, varying from 0% to 25%, as fine aggregate in FC was determined by several critical factors to ensure the study's validity and significance. This range facilitates a methodical examination of the material's influence on mechanical qualities, including compressive strength, workability, and density, alongside durability aspects like as water absorption and resistance to chlorine and sulfate corrosion. The 0% functions as a control, but the incremental increases up to 25% provide a thorough assessment of performance across varying replacement levels. A 25% substitution was selected to evaluate the practical limit for integrating WSW without jeopardizing the structural integrity of FC, embodying a viable and sustainable alternative for the building sector. From an environmental perspective, elevated replacement levels substantially diminish waste, utilizing considerable amounts of sanitary waste that would otherwise be disposed of in landfills, while preserving natural aggregates. This percentage range is consistent with prior studies examining similar waste materials, thereby adhering to known study methodologies.
Experimental setup
Fresh state characteristics
Flow table test
An analysis was carried out to investigate the impact of varying WSW content on the flow value of the mix, following the ASTM C 230-97 25 standard as shown in Figure 5(a). The flow value for every mix was calculated by averaging the diameters in two perpendicular directions, and it should fall within the range of 220–250 (for FC).

Tests conducted on fresh and hardened FC.
Consistency test
The consistency test was conducted according to the specifications provided in BS EN 196-3. 26 The test involved determining the times at which the final setting and initial setting occurred. The Vicat plunger, with dimensions of 50 mm in length and 10 mm in diameter, penetrated the mold's top to a depth ranging from 33 to 35 mm. Figure 5(b) shows the setup for the consistency test.
Transport properties
The transport characteristics of an FC are dictated by the permeability of fluids and ions through it. The LFC's durability is mostly dictated by these characteristics. Consequently, three distinct experiments were conducted, including the sorptivity test, the permeable porosity test, and the water absorption test.
Water absorption test
In order to examine the water absorption of all the mixtures, cylindrical samples of 100 mm in height and 50 mm in diameter were employed, according to the specifications outlined in ASTM C 642 (2013). 27
Permeable porosity
The test of permeable porosity was conducted according to the guidelines outlined in the ASTM C1202-17a 28 standard, using FC cylinders with a diameter of 50 mm and a height of 100 mm. The test was carried out at 7, 14, 28, and 90 days.
Sorptivity test
The sorptivity test was assessed using the ASTM-C 1403 29 standard at 7 and 28 days. The experiment utilized cylindrical specimens with a diameter of 100 mm and a height of 50 mm.
Mechanical properties
Compression test
100 × 100 × 100 mm FC cubes were manufactured using metal molds and subjected to compressive strength testing after 7, 14, 28, 56, and 180 days of wet curing, as shown in Figure 5(c). In addition, the mean values of three samples were documented. The experiment was carried out using a GOTECH-7001-M5 testing machine, following the guidelines of BS12390-3. 30 The test was performed at a consistent load rate of 0.5 N/mm2/s, with the equipment capable of handling loads up to 3000 KN.
Flexural test
FC prisms with dimensions of 100 × 100 × 500 mm were subjected to flexural strength testing according to the BS12390-5 31 standard. The tests were conducted at 7, 14, 28, 56, and 180 days of water curing employing the GoTech GT-7001-C10 machine. The mean of three test results for each sample was determined. The prisms were evaluated using a four-point bending experiment. Figure 5(d) shows the setup for the flexural test.
Split tensile test
Concrete cylinders of 100 × 200 mm were produced using metal molds and subjected to splitting tensile strength testing according to ASTM International C496, 32 as illustrated in Figure 5(e). The tests were conducted on 7, 14, 28, 56, and 180 days of wet curing, with a mean of three samples evaluated at each time point. The GoTech GT-7001-BS300 Universal Testing Machine was used for the testing.
Modulus of elasticity
The modulus of elasticity of the concrete was determined after 28 days using the ASTM C469 33 standard. Figure 5(f) displays the setup for the modulus of elasticity test. For each test, three cylinders with a diameter of 150 mm and a height of 300 mm were created, and the average of the results from the three samples was documented.
UPV test
The quality of the FC was evaluated by performing UPV measurements following the BS12504-4 34 as demonstrated in Figure 5(g). The outcomes were computed utilizing the mean readings acquired from three samples of prisms measuring 100 mm × 100 mm × 500 mm.
Drying shrinkage
By calculating the difference between the initial moist measurements and the measurements obtained after the drying procedure, the drying shrinkage of the rectangular FC samples was evaluated. The discrepancy was quantified as a proportion of dry length as well as determined using the guidelines of ASTM C878. 35 The dimensions of the prism utilized for this experiment were 75 mm × 75 mm × 290 mm, which includes both cap as well as rod nuts, as shown in Figure 5(h).
Thermal properties
The specific heat capacity, thermal diffusivity, and thermal conductivity of FC were determined by employing the test of the hot-guarded plate as well as following the ASTM protocol outlined within ASTM C 177-19. Thus, the measurements were conducted on FC specimens with dimensions of 25 mm × 25 mm × 12 mm. The test technique described was globally acknowledged for being the first reliable approach to quantifying the thermal transmission characteristics of uniform material insulation. In this investigation, the Hot Disc Thermal Constants Analyzer Model TPS 2500 was used to test the thermal conductivity of the FC, as shown in Figure 5(i). This analyzer is particularly developed for precise and dependable measurements of thermal characteristics.
Microstructural characteristics assessment
The evaluation of distribution and pore size in FC was conducted employing MIP. To examine the FC morphology with varying WSW concentrations, an SEM study was conducted at a magnification level of 120×. The dimensions of the developed specimen were 10 mm × 10 mm × 10 mm. The experiments were conducted on concrete samples that had been cured for a period of 28 days.
Results and discussion
Fresh state
Slump flow
The results of the flow table test carried out on freshly mixed materials are shown in Figure 4. The figure indicates that the highest and lowest flowability measurements were recorded for samples with 0% WSW, measuring 270 mm, and samples with 25% WSW, measuring 205 mm, respectively. The slump flow values for WSW5, WSW10, WSW15, and WSW20 decreased compared to WSW0, with reduction ratios of 0.79%, 1.99%, 2.39%, 2.78%, and 3.58%, respectively. These findings suggest that higher percentages of WSW sand result in decreased flowability in the mixtures. Several studies in the literature have demonstrated a decrease in the slump of concrete when WSA is used as a sand substitute. 36 This phenomenon may occur because of the agglomeration of WSW particles. Due to the reduced water absorption of fine WSW in comparison to fine river sand, mixes with larger quantities of these materials need greater overall water-to-cement ratios to achieve the same slump class. There is a strong probability that a significant cohesive force has formed between the water molecules present on the vitreous surfaces of those aggregates, hindering the smooth movement of particles. The cohesive force arises from the electrostatic attraction between the positively charged hydrogen atom and the strongly electronegative oxygen atom in an adjacent water molecule, which is known as a hydrogen bond. The water content is required to provide lubrication to the exposed surface of the aggregates. Consequently, an expansion in area results in a greater need for water; thus, the utilization of angular WSW fine aggregates results in a reduction in workability.
Setting time
An investigation was conducted into the initial and final setting times for all the various mixtures, revealing an obvious rise within the setting time according to Figure 6. The control mixture (WSW0) had an initial setting time of around 174 min, while WSW25 had an initial setting time of around 232 min. However, the final setting time for the control mix (WSW0) was 307 min, whereas the final setting time for WSW25 was around 375 min. Increasing replacement ratios led to longer setting times. The prolonged setting time could be attributed to a rise in the normal sand-water absorption ratio. The normal sand water absorption ratio was found to be 1.98%, but the WSW water absorption ratio was 1.8%. As the percentage of river sand replaced by WSW increased, the total water absorption in the mixture decreased, resulting in a slower hydration process, and longer setting periods. 37 Nevertheless, using WSW as a substitute for fine aggregate at several percentages ranging from 0 to 25% resulted in an increase in the initial setting durations. Specifically, compared to the control mix, the setting times increased by 6.32%, 13.79%, 21.83%, 28.73%, and 33.33%, respectively. The increment ratios in the final setting time for mixtures with WSW5, WSW10, WSW15, WSW20, and WSW25 are 4.23%, 9.77%, 13.68%, 17.58%, and 22.14%, respectively. The increase in final setting time is smaller than the increase in initial setting time. The variation in the percentage rise can be attributed to many causes. First and foremost, the WSW includes significant amounts of amorphous silica, which might have an impact on specific reactions as well as cause delays in the setting procedure. In addition, the bond between composite material and WSW particles could contribute to uniformity, leading to a longer overall setting time with a relatively lower increase compared to the initial setting time. Generally, the absorption of water decreased, and the interaction between FC and WSW led to longer setting times. However, the final setting time showed slightly less influence compared to the initial setting time. 38 Therefore, areas with elevated temperatures may recognize the feasibility of using WSW sand when extending the concrete casting time yields favorable outcomes.

Initial and final setting times of FC including various proportions of WSW as sand replacement.
Density
In this investigation, the oven-dried, demould, and wet densities of all mixes are assessed. Hardened and fresh unit weights are illustrated in Figure 7. The density of all mixtures typically falls within the range of 1299 kg/m3 to 1328 kg/m3 when completely dried in an oven after 28 days. During the wet and demould conditions, the densities of all mixtures varied between 1446 kg/m3 and 1482 kg/m3, and between 1347 kg/m3 and 1376 kg/m3, respectively. Based on the findings depicted in Figure 8, including WSW as a partial substitute for the sand leads to a modest increase in the density of FC mixes. The observed patterns deviated from the findings also reported by other researchers in earlier investigations on the utilization of WSW within concrete. 39 Greater density often suggests superior mechanical properties. The increase in density was mostly attributed to the increased specific gravity of sanitary ware (2.65) compared to river sand (2.55). Furthermore, this may be attributed to the reduced porosity of the concrete in the present study compared to prior research, which was achieved by the angular shape of the WSW grains. In contrast, the current study uses slightly angular particles. 40 Thus, this may be ascribed to the creation of a denser and more compact structure resulting from the inclusion of WSW. 41

Density of FC containing various proportions of WSW as sand replacement.
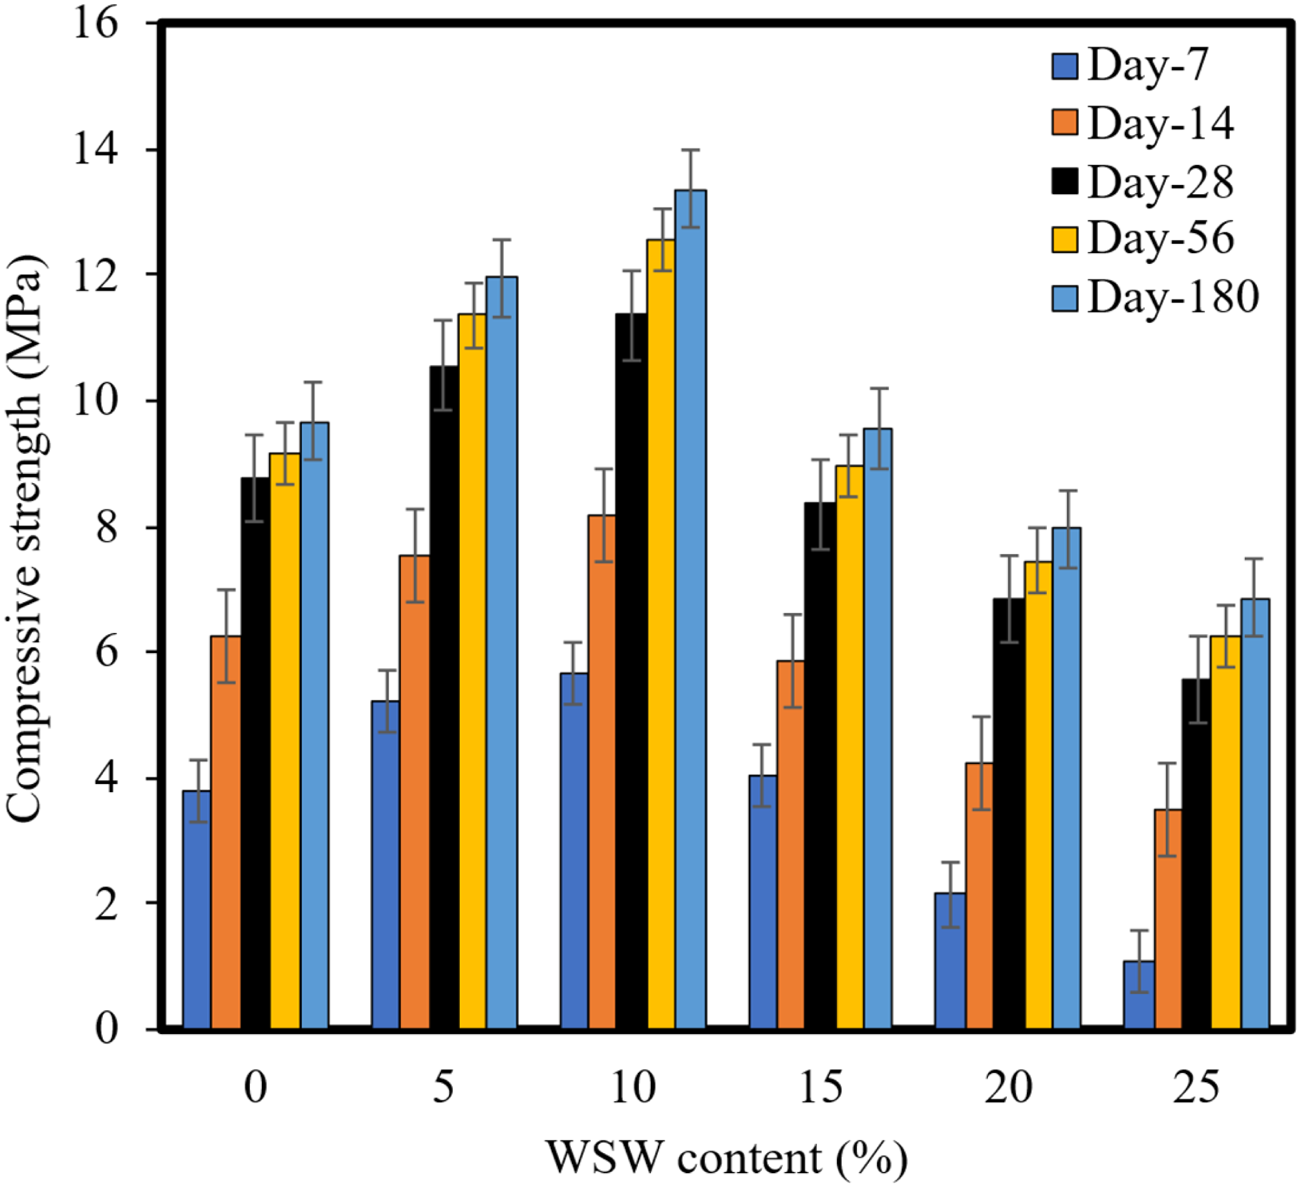
Compressive strength of FC containing various proportions of WSW as sand replacement.
Mechanical characteristics
Compressive strength
The FC compressive strength was examined at certain time intervals (days 7, 14, 28, 56, and 180) throughout the seal curing procedure. Figure 8 illustrates compressive strengths for various FC samples. The compressive strength of FC progressively increased with the duration of curing due to the process of hydration. Nevertheless, the findings indicate that there was an initial improvement in compressive strength when 10% of WSW was used as a substitution for sand, compared to the WSW0 mix, over all curing periods. However, as the WSW content increased, there was a decrease in strength. According to Figure 8, when the fine aggregate contains 0% WSW, increasing the WSW content from 0% to 10% resulted in a 50% increase in compressive strength values at the 7-day curing period, and increases of 32.25%, 29.54%, 36.95%, and 38.14% at the 14, 28, 56, and 180-day curing periods, respectively. Nevertheless, the rate of increase in compressive strength significantly decreased after seven days. The enhancement in mechanical strengths can be attributed to the pozzolanic function and the filler effect of WSW. The particles of WSW demonstrate a tendency to fill the regions of void within the FC system. As a result, there is a decline in calcium hydroxide and a simultaneous rise in the production of calcium silicate hydrate. 42 WSW particles tend to fill the void regions inside the FC system. As a result, there is a simultaneous rise in the synthesis of calcium silicate hydrate and a reduction in calcium hydroxide. The identical phenomena have also been detected by microstructure analysis (the microstructural assessment section). The addition of up to 10% WSW resulted in an enhancement of the pore structures, distribution, and particle packing of FC, leading to an increase in its compressive strength. 43 Furthermore, the observed 10% increase in WSW may be attributed to the WSW pore-filling phenomenon, which enhances the transition zone (TZ) characteristics encompassing the aggregates. Nevertheless, as the substitution level of WSW exceeds 10%, the ratios decline significantly at higher substitution percentages. Specifically, the ratios decrease from 4.83% to 43.54%, from 4.54% to 36.36%, from 2.21% to 31.52%, and from 1.03% to 28.86% after 14, 28, 56, and 90 days, respectively. The decrease in strength observed when WSW concentration exceeds 10% can be attributed to poor workability, resulting in the formation of voids. Another possible cause might be the irregular shape and perhaps greater air-void content of samples including WSW.
Flexural strength
Figure 9 demonstrates the progression of flexural strength throughout various curing periods (7, 14, 28, 56, and 180 days). The flexural strength exhibited a consistent and gradual rise as the curing age rose for all mixes. Furthermore, it is evident that the addition of WSW up to a maximum of 10% as a substitute for sand improves the flexural strength, but this improvement decreases as the amount of WSW used increases above that threshold. The addition of a 10% mixture results in a significant rise in flexural strength, with improvements of 51.64%, 30.26%, 30.66%, 35.87%, and 38.46% observed at 7, 14, 28, 56, and 180 days, respectively, as compared to the control. The 15% mixture's compressive strength subsequently decreased relative to the 10% mixture but remained greater than that of the control mixture. Nevertheless, the concrete mixture with 25% had the lowest flexural strength values of 0.27 MPa, 0.83 MPa, 1.34 MPa, 1.52 MPa, and 1.67 MPa at 7, 14, 28, 56, and 180 days, respectively. These values were lower than the compressive strength of the control mix, which decreased by 70%, 45.39%, 36.79%, 31.83%, and 28.63% at 7, 14, 28, 56, and 180 days, respectively.

Flexural strength of FC containing various proportions of WSW as sand replacement.
Flexural loading exhibits a distinct mechanism in comparison to compressive strength. Nevertheless, a comparable correlation was found between flexural strength and compressive strength. The decrease in flexural strength is similar to findings documented in existing literature, 44 whereas the enhancement in flexural strength resulting from the addition of up to 10% WSW processing can be attributed to the same factors discussed before (the compressive strength section). The improved flexural strength may also be a result of the heightened friction and connection among the FC elements, which is achieved through the incorporation of WSW. 45 An increase in the number of reaction products results from the acceleration of the cement hydration process. Moreover, the manufacturing of additional stiffening gel has the capability to improve the constraints related to WSW dispersion, hence boosting the FC flexural strength. It has been demonstrated that by enhancing the particle packing density, the incorporation of WSW into cement paste can significantly diminish the dimensions of bigger pores. Nevertheless, there was no obvious improvement in strength when the substitution ratios reached 20% and 25% because of the adverse impact caused by the rise in bubble decline and the decrease in strength obtained. Therefore, when access to natural river sand is limited, it is recommended to substitute 10% of the waste WSW in FC to achieve the greatest possible flexural strength. There was a significant relationship observed between compressive strength and flexural strength values, with a high coefficient of determination (R2 = 0.977), as illustrated at Figure 10. Furthermore, flexural strength varied between 23% and 24.5% of the compressive strength, providing additional evidence for the relationship between these two strength characteristics. 46

Correlation between flexural and compressive strengths of FC containing various proportions of WSW as sand replacement.
Splitting tensile strength
The splitting strength test findings of FC samples aged for 7, 14, 28, 90, and 180 days and having different amounts of WSW as a substitute for sand are displayed in Figure 11. The findings indicated a consistent rise in the splitting tensile strength with the progression of curing age, which mirrored the trend observed in the compressive and flexural strengths. The split tensile strength of FC mixtures at 7, 14, 28, 56, and 180 days ranged between 0.6–1.6, 0.86–1.95, 0.95–2.25, 0.68–1.56, 0.36–1.31, and 0.2–1.41 MPa, respectively. At all ages, the splitting tensile strength significantly increased with a progressive increase in the WSW concentration, as shown in Figure 11. The strength of the 10% WSW specimen reached its highest point, increasing by 58.33%, 32.03%, 32.41%, 36.60%, and 40.62% on days 7, 14, 28, 56, and 180, respectively, in comparison with the control sample. The observed phenomenon was ascribed to the strong cohesion between particles resulting from a reduction in the pores number as well as an enhancement within the FC structure. 47 The outcomes indicate a compressive strength range of 16.79%–18.18%, which aligns with the Narayanan and Ramamurthy results. It was proposed by these researchers that the tensile and flexural strengths of FC ought to fall within the range of 0.15 to 0.35 times its compressive strength. 48 Based on the data shown in Figure 12, a significant correlation was observed between splitting strength values and compressive strength values, with a high positive coefficient of determination (R2 = 0.98).

Split tensile strength of FC containing various proportions of WSW as replacement for sand.
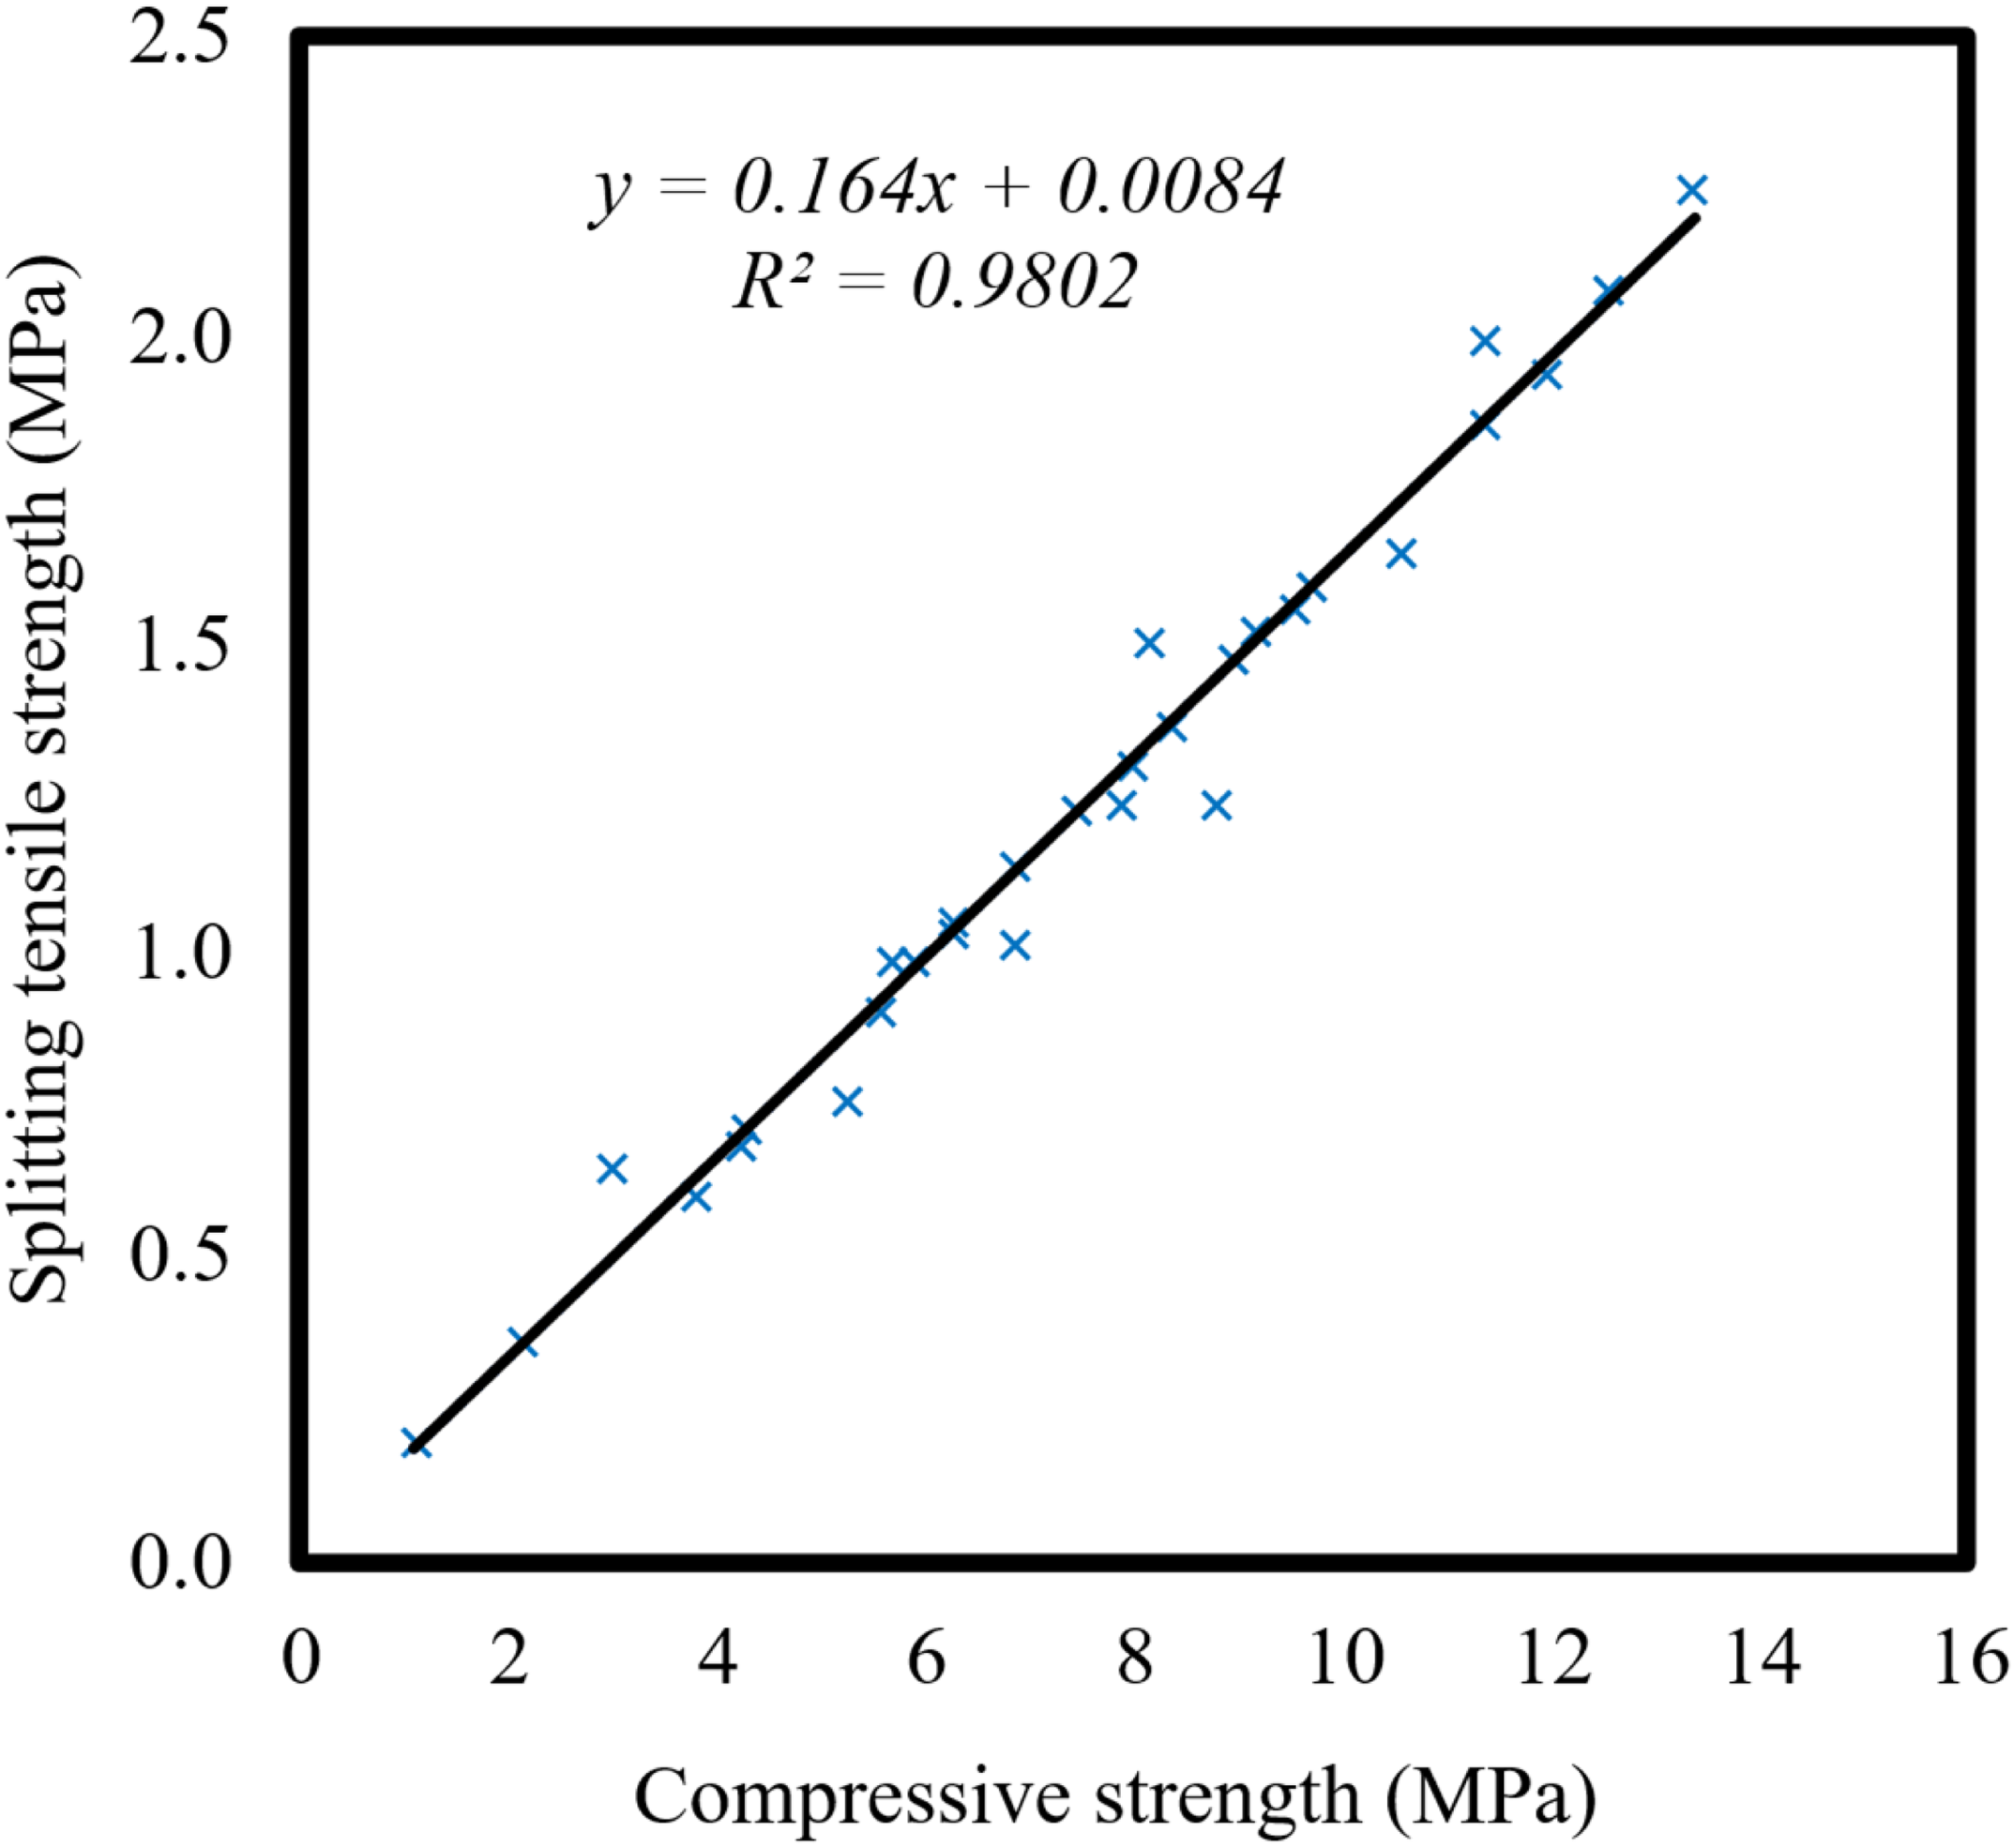
Correlation between split tensile and compressive strengths of FC containing various proportions of WSW as sand replacement.
Modulus of elasticity
This section provides a concise overview of the impact of WSW on the modulus of elasticity of cylindrical samples. Figure 13 displays the modulus of elasticity of concrete mixtures following a 28-day period. The elastic modulus is often associated with compressive strength and the accompanying compressive strain. The concrete mixture including 10% WSW exhibited the maximum modulus of elasticity, consistent with the previously reported strength findings. A 29.54% increase in the modulus of elasticity was observed when 10% of sand was substituted with WSW. One possible explanation is that the use of 10% of WSW enhances the brittle of FC. 43 Nevertheless, when the substitutions exceeded 10%, the elasticity modulus values were lower compared to the control concrete. The lowest modulus of elasticity was obtained for a 25% WSW specimen, showing a decrease of 36.68% compared to the modulus of elasticity of the reference sample. The drop in modulus of elasticity can be attributed to the high ductility of FC with WSW, perhaps resulting from alterations in pore sizes, quantities, and distribution.

Modulus of elasticity of FC containing various proportions of WSW as sand replacement.
Ultrasonic pulse velocity
The information obtained from UPV measurements regarding the rate of pulse transfer in concrete samples is significant. Obviously, the UPV and concrete porosity are only indirectly related. 49 It is evident from Figure 14 that the UPV rises progressively with curing age conservation within water for all concrete specimens, which demonstrates the enhanced quality of the FC as it gains density, strength, and wave velocities. The acquired outcomes demonstrated a rise in UPV with a 10% increase in the content of WSW. While the UPV of FC was significantly lower when 15% WSW was added to the mixture compared to 10% WSW, it remained higher than the UPV of the control mixture. To provide an example, the UPV of concrete mixtures incorporating 5%, 10%, and 15% WSW increased by (0.62% to 0.66%), (1.76% to 1.75%), and (0.51% to 0.58%) compared to the control mixture, between 28 and 180 curing days. However, the UPV of the 25% WSW specimen was found to be the lowest, decreasing by 0.27%, 0.5%, 0.4%, 0.46%, and 0.43% at 7, 14, 28, 56, and 180 days, respectively, in comparison to the UPV for the reference sample. The decrease in velocities observed when 20% and 25% WSW are added to the FC is a result of elevated pore content and defects. 50 The UPV test outcomes verified those of the test of compression, in which the mixture containing 10% WSW exhibited the highest compressive strength. This improvement was caused by the infill impact and pozzolanic reactivity of WSW, which contributed to the densification of the pore system. However, a significant substitution ratio is linked to an increase in the rate at which pores or bubbles collapse, resulting in the persistence of voids. 42 The observed phenomenon can be ascribed to the substantial absorption and inadequate workability of WSW. Figure 15 illustrates the correlation between the compressive strength of concrete and the UPV. This discovery implies that the UPV and compressive strength of the formulated concretes are highly correlated, as indicated by the coefficient of determination value of R2 (0.828).

UPV of FC containing various proportions of WSW as sand replacement.

Correlation between UPV and compressive strengths of FC containing various proportions of WSW as sand replacement.
Drying shrinkage
Drying shrinkage is a prevalent factor that causes cracks in FC, which can result in a decrease in durability values. 51 It is widely assumed that the explanation for this phenomenon is the reduced amount of solid material in comparison to regular concrete, which helps it handle the contracting stress caused by shrinkage. 52 Figure 16 illustrates the drying shrinkage of various mixtures during a curing period of 56 days. According to Figure 16, the amount of shrinkage grew as the age increased. However, the rate of shrinkage varied greatly according to the distribution of pore sizes and the surface area, which controlled the rate of shrinkage. On the 56th day, 10% of WSW exhibited the minimum drying shrinkage of 0.35 mm, while 0% of WSW specimens showed the maximum drying shrinkage of 0.74 mm. Furthermore, it is evident that on the 56th day of the curing process, the introduction of WSW in quantities ranging from 0 to 10% resulted in a significant reduction of around 52.70% in drying shrinkage values. The drying shrinkage measurements for mixtures including 15% to 25% WSW exhibited an increase when compared to mixtures containing 10% WSW. However, these values remained lower than the drying shrinkage of the control mixture. The reduced shrinkage observed with a 10% WSW can be due to its internal structure, which is defined by a strong interfacial zone and the presence of bubbles. 52 Furthermore, this led to the highest level of strength and the least amount of absorption in comparison to alternative mixes.

Drying shrinkage of FC containing various proportions of WSW as sand replacement.
Transport properties
Sorptivity
The liquid material penetration rate is denoted as sorptivity and is also associated with the effective porosity of the concrete mixture. Thus, it can also offer insights into the microstructural properties of FC. 53 The sorptivity test results of the various mixtures carried out on the seventh and 28th days of curing are presented in Figure 17. The highest and lowest sorptivity values recorded at 7 and 28 days (60 h) were 60 and 54 kg/100 cm2, and 51 and 46 kg/100 cm2, respectively, for 0% and 10% of WSW. The incorporation of WSW led to a substantial decrease in sorptivity of 25% for the combination containing 10% WSW after 7 days (60 h) and a maximum reduction in sorptivity of 25.92% after 28 days (50 h). With an increase in the WSW content of up to 10%, there was a notable drop in the sorptivity rate. This phenomenon might be attributed to the efficacy of WSW in occupying bigger pores and diminishing the interconnectedness of the pore network, as mentioned in references. 54 According to Figure 17, the sorptivity of the mixture containing 15% to 25% WSW rose compared to the mixture with 10% WSW. However, it was still lower than the sorptivity of the control mixture. This difference may be attributed to the larger porosity resulting from the increasing quantity of WSW, as will be explained in the apparent porosity section. The reduction ratios in this investigation are 20.37%, 11.11%, and 5.55% for the mixtures with WSW15, WSW20, and WSW25, respectively, at 28 days (50 h), compared to the control specimen (WSW0). Furthermore, it is evident that the sorptivity rate decreases in some mixtures with increased WSW concentration as the curing duration rises.

Sorptivity of FC containing various proportions of WSW as sand replacement; (a) 7 days, (b) 28 days.
Water absorption
Figure 18 displays the results of the test of the water absorption carried out on several mixtures (WSW0, WSW5, WSW10, WSW15, WSW20, and WSW25) after 7, 14, 28, and 90 days of curing. The water absorption characteristics of all the samples improved as the curing age increased. The reason for this finding was attributed to the process of cement hydration, which resulted in the filling of the pores in the FC matrix [96]. The performance of water absorption for WSW0, WSW5, WSW10, WSW15, WSW20, and WSW25 decreased by 5.66%, 7.93%, 6.82%, 6.70%, 7.48%, and 7.75%, respectively, during 7 and 90 days of curing. Furthermore, using WSW greatly enhanced the performance of the water absorption of FC, apart from WSW25. WSW10 had the best water absorption performance, with reductions of 12.68%, 12.76%, 13.98%, and 13.76% after 7, 14, 28, and 90 days of curing, respectively, compared to the reference sample. It is recommended to adhere to a 10% replacement ratio, considering the mechanical characteristics. Additionally, the absorption of water aligns with the findings of the mechanical characteristics. The primary reason for this improvement was the rise in the solid matrix and the decrease in the quantities, sizes, and connectivity of pores. 55 The results align with prior research on FC, indicate that when the solid matrix increases, the water absorption performance decreases due to a decrease in FC. 56

Water absorption of FC containing various proportions of WSW as sand replacement.
Apparent porosity
As shown in Figure 19, the porosity, which is a metric for FC permeability, was determined for different FC mixtures for ages 7, 14, 28, and 90 days. On the 28th day, the porosity varied from 29.91% to 33.94%. The porosity consistently reduced as the curing period increased, with average values of 2.19%, 4.24%, and 6.82% on days 14, 28, and 90, respectively, in comparison with the value on day 7. According to Figure 19, the porosity values at 28 days were the lowest (29.91%) for 10% WSW and the highest (33.94%) for 0% WSW. The porosity values at 90 days ranged from 29.13% for 10% WSW to 33.07% for 25% WSW. The addition of 10% of WSW to the sample resulted in the lowest porosity values, showing a drop of about 10.86%, 11.07%, 11.87%, and 11.88% at 7, 14, 28, and 90 days, respectively, compared to the control FC. The reduction in porosity of the FC microstructure might arise from the filler effect of fine-sized WSW. Furthermore, the interface TZ (ITZ) can be enhanced by the pozzolanic reaction and filling impact of waste steel wool particles in concrete. 57 In addition, the inclusion of WSW at concentrations ranging from 10% to 25% resulted in an increase of 11.94%, 12.26%, 13.17%, and 13.52% in the apparent porosity values at 7, 14, 28, and 90 days, respectively. This outcome suggests that the existence of more interconnected pores enhances the infiltration of water. A strong link was detected between water absorption and porosity, as illustrated in Figure 20.

Apparent porosity of FC containing various proportions of WSW as sand replacement.
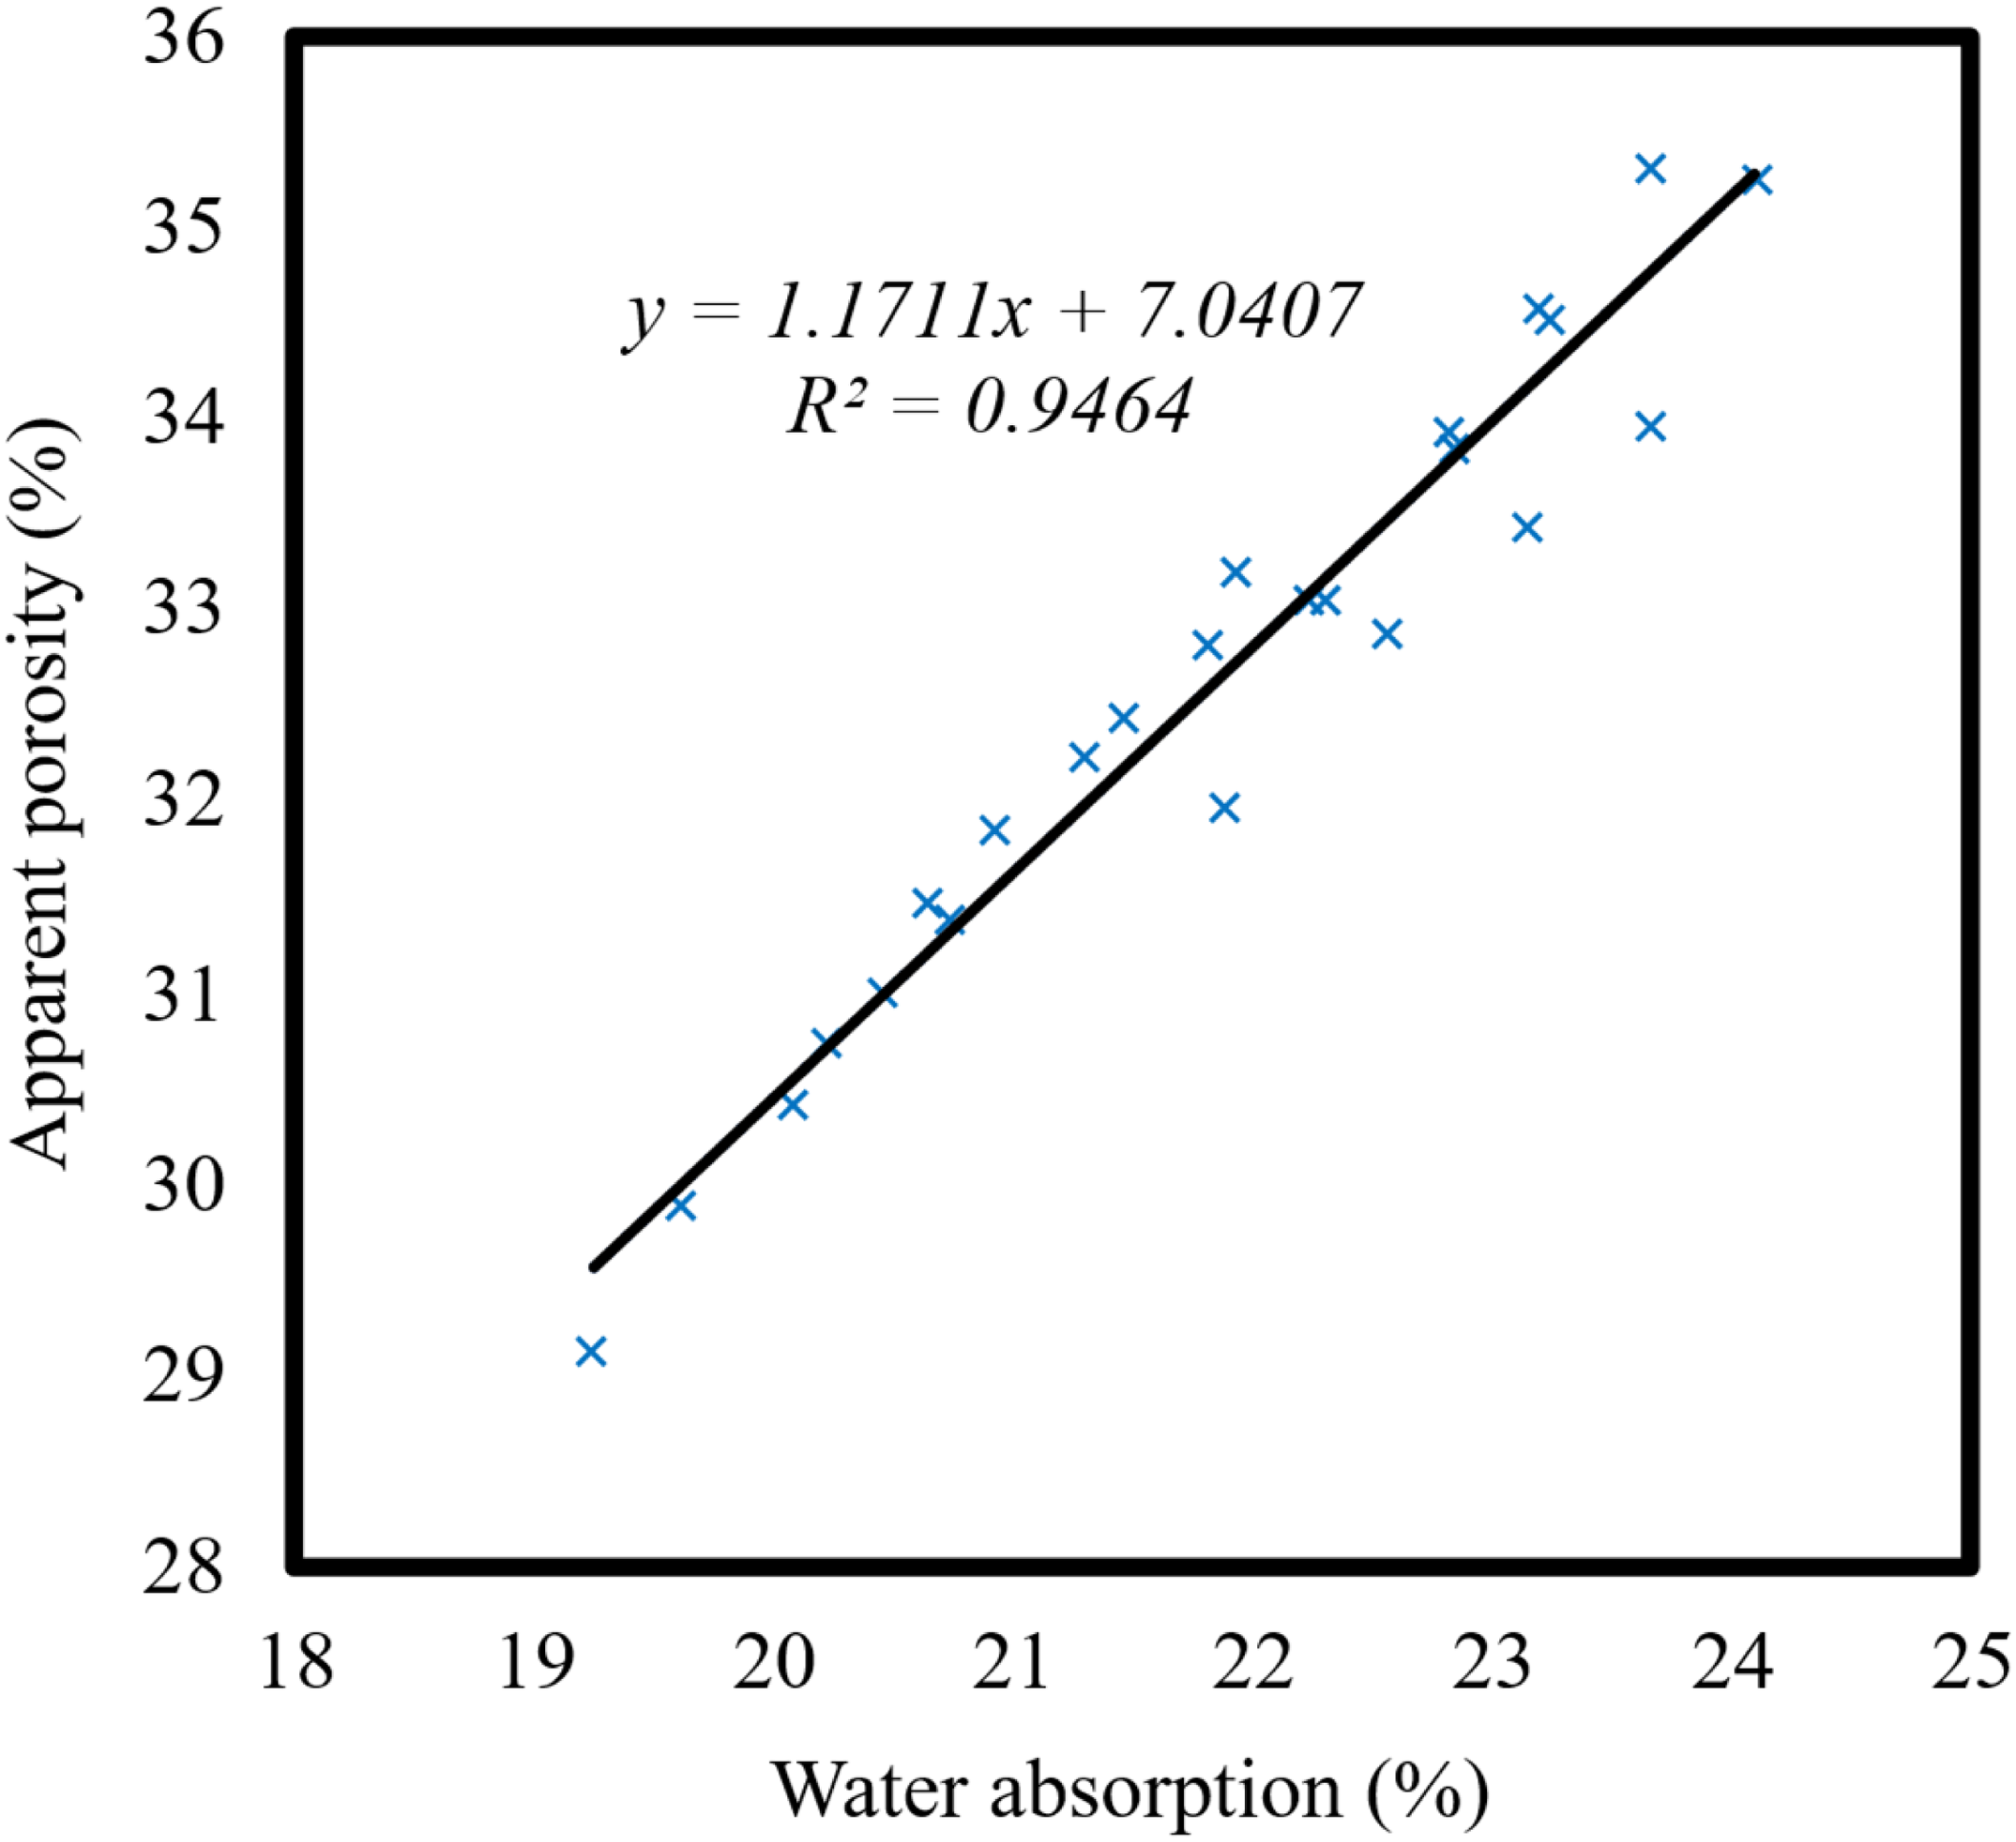
Correlation between water absorption and apparent porosity of FC containing various proportions of WSW as sand replacement.
Thermal properties
Thermal conductivity
Throughout construction operation, the thermal characteristics of concrete have a considerable influence on energy usage. Thermal conductivity is a significant characteristic that may be used to quantify the level of insulation provided by materials. The insulation characteristics of materials, particularly in FC, are primarily influenced by their porosity and bulk density, as widely recognized. 58 In general, a rise in porosity leads to an enhancement in the insulating characteristics of concrete. Due to its larger porosity, FC is widely recognized for its lower thermal conductivity compared to normal concrete. Figure 21 displays the outcomes of a thermal conductivity test performed on several mixtures following a 28-day curing period. The thermal conductivity of the control FC sample was marginally inferior to that of the specimens treated with WSW. The thermal conductivity increased by 3.92%, 6.10%, 4.57%, 1.08%, and 0.43% for the mixes containing 5%, 10%, 15%, 20%, and 25% WSW, respectively, compared to the control mix (0% WSW). The combination that included 10% WSW demonstrated the maximum thermal conductivity, which is consistent with the decreased porosity observed in mixtures containing 10% WSW. The incorporation of a substantial volume of WSW resulted in a rise in thermal conductivity, indicating a refinement of pore structures within the WSW specimens.

Thermal conductivity of FC containing various proportions of WSW as sand replacement.
Thermal diffusivity
Figure 22 illustrates the FC thermal diffusivity findings with various amounts of WSW. According to Figure 22, the mixture containing 10% of WSW had the maximum thermal diffusivity value of 0.678 W/m.k. This value was 3.66% greater than that of the reference specimen. This is consistent with the findings obtained in the apparent porosity and compressive strength sections. Nevertheless, the thermal diffusivity of the mixture with 15% to 20% WSW decreased compared to the mixture with 10% WSW, but it remained greater than the control mixes thermal diffusivity. According to Figure 22, the values of the FC mix thermal diffusivity after 28 days were 0.654, 0.669, 0.678, 0.669, 0.658, and 0.652 m2/s for WSW0, WSW5, WSW10, WSW15, WSW20, and WSW25, respectively. The results obtained are consistent with the observed trend of decreasing porosity up to 10% WSW, demonstrating that the thermal diffusivity rose as the FC's porosity decreased.59,60

Thermal diffusivity of FC containing various proportions of WSW as sand replacement.
Specific heat capacity
Specific heat is a characteristic that quantifies the ability of concrete to undergo temperature variations. Figure 23 demonstrates the variance in specific heat capacity of different concretes. It is evident that the specific heat capacity of all concretes, including WSW as fine aggregates, is lower than that of the reference concrete. 61 This occurrence can be attributed to the characteristics of the WSW employed in the substitution. Figure 23 indicates that the mixture with 0% WSW had the maximum specific heat capacity of 1188 J/kg K, while the mixture with 10% WSW had the lowest specific heat capacity of 1125 J/kg K. The thermal characteristics of the FC are significantly influenced by the continuity, distribution, and size of its pores. 62 The mix including waste steel wool resulted in a reduction of the specific heat capacity by 2.77%, 5.30%, 3.53%, 0.75%, and 0.42% for 5%, 10%, 15%, 20%, and 25% WSW substitution, respectively, when compared to the control sample. This outcome suggests that using WSW in the FC mixture resulted in a reduction in the specific heat of the material. This observed tendency can be attributed to the characteristics of the WSW and the alterations in pore properties.

Specific heat capacity of FC containing various proportions of WSW as sand replacement.
Microstructural assessment
SEM analysis
SEM images were acquired at a magnification of 120x for each sample after a curing period of 28 days and subsequently evaluated. Figure 24 displays images of the SEM of various samples. Figure 24(a) illustrates the typical hydration compound resulting from a 100% OPC combination, namely ettringite and C-S-H, Ca(OH)2. The presence of a significant pore space was identified because of the absence of extremely small particles, whereas the merging of pores was observed owing to the properties of the FC. Nevertheless, the addition of the WSW particles functioned as a very fine filler substance in the mixture, resulting in the formation of micro and small pores, as shown in Figure 24(b). Furthermore, by increasing the WSW concentration by 10%, the foam amount decreased, resulting in an increase in the solid matrix and a reduction in the overall surface area of artificial pores, as shown in Figure 24(c). In general, when the WSW concentration increases up to 10%, the pore width steadily decreases. WSW5 and WSW10 displayed notable reductions in pore sizes, increased pore spacing, elevated solid matrices, restricted connecting pores, and a limited number of pores with diameters less than 50 μm (Figure 24(b) and (c)). The enhanced bonding and dispersion could be attributed to the filler effect, pozzolanic characteristics, and the WSW, which facilitate the creation of extra hydration products and aid in the FC matrix densification. Moreover, the existence of WSW impacts the distribution of effective void sizes in the FC.

SEM analysis of FC containing various proportions of WSW as sand replacement. (a) WSW0. (b) WSW5. (c) WSW10. (d) WSW15. (e) WSW20. (f) WSW35.
On the other hand, WSW15, WSW20, and WSW25 exhibited a higher number of smaller pores, an increased presence of interconnected pores, and many pores with diameters less than 50 μm (Figure 24(d)–(f)). The results corroborated the porosity findings, indicating that WSW15, WSW20, and WSW25 exhibited greater porosity due to bigger numbers of interconnected pores, in contrast to WSW5 and WSW10.
In general, the inclusion of WSW up to 10% caused a decrease in the dimensions and quantity of voids, leading to a harmonious and improved arrangement of pores. The improvement in pore distribution and size is advantageous for improving the durability and mechanical characteristics of the FC. Furthermore, an analysis of the microstructure revealed that substituting sand with WSW up to 10% in FC led to a changed and enhanced internal composition. 63
Pore distribution
Figure 25 illustrates the pore diameter size distribution in FC. Utilization of WSW led to a progressive rise in the pores’ percentage, with diameters ranging from 50 to 100 μm. Observations of pores with dimensions ranging from 100 to 200 μm were recorded up to a concentration of 10% in the WSW. Among these concentrations, WSW10 exhibited the largest percentage of pores within this size range. For WSW contents of 5% and 10%, there was a larger proportion of pores with diameters greater than 400 μm. However, the percentage of pores with diameters greater than 800 μm was insignificant for WSW5 and WSW10, excluding WSW0, WSW15, WSW20, and WSW25. The percentage of pores with diameters greater than 800 μm was reduced by 5% and 10% with the addition of WSW; however, it rose with the addition of WSW15, WSW20, and WSW25. The average pore diameter was measured, and the findings are displayed in Figure 26. The mean pore diameter of WSW5 and WSW10 falls by 28.36% and 31.91%, respectively, compared to the control specimen (WSW0). However, the pore property of FC has significantly deteriorated due to the increased amount of extra WSW content. The average pore diameter of WSW15, WSW20, and WSW25 grew by 6%, 12.05%, and 13.47%, respectively, in comparison with WSW0. Figure 27 illustrates the distribution of pore volume in specimens that include WSW. Three categories of pores were gathered according to their pore ranges, which include huge pores, large capillary pores, and fine capillary pores. The proportion of different pore volumes was also computed. It is evident that most of the specimens had big pores as the dominant pore size range, with a significant percentage (10–25%) being occupied by large capillary pores. WSW10 has the lowest big pores percentage at 65%, whereas WSW5 has a slightly higher proportion at 72.14%. With an increase in the WSW content beyond 10%, there was a steady drop in the number of fine capillary pores, while the number of big pores and large capillary pores showed a considerable rise. The decrease in compressive strength of greater WSW content 64 can be attributed mostly to increased porosity and the enlargement of big capillary pores.
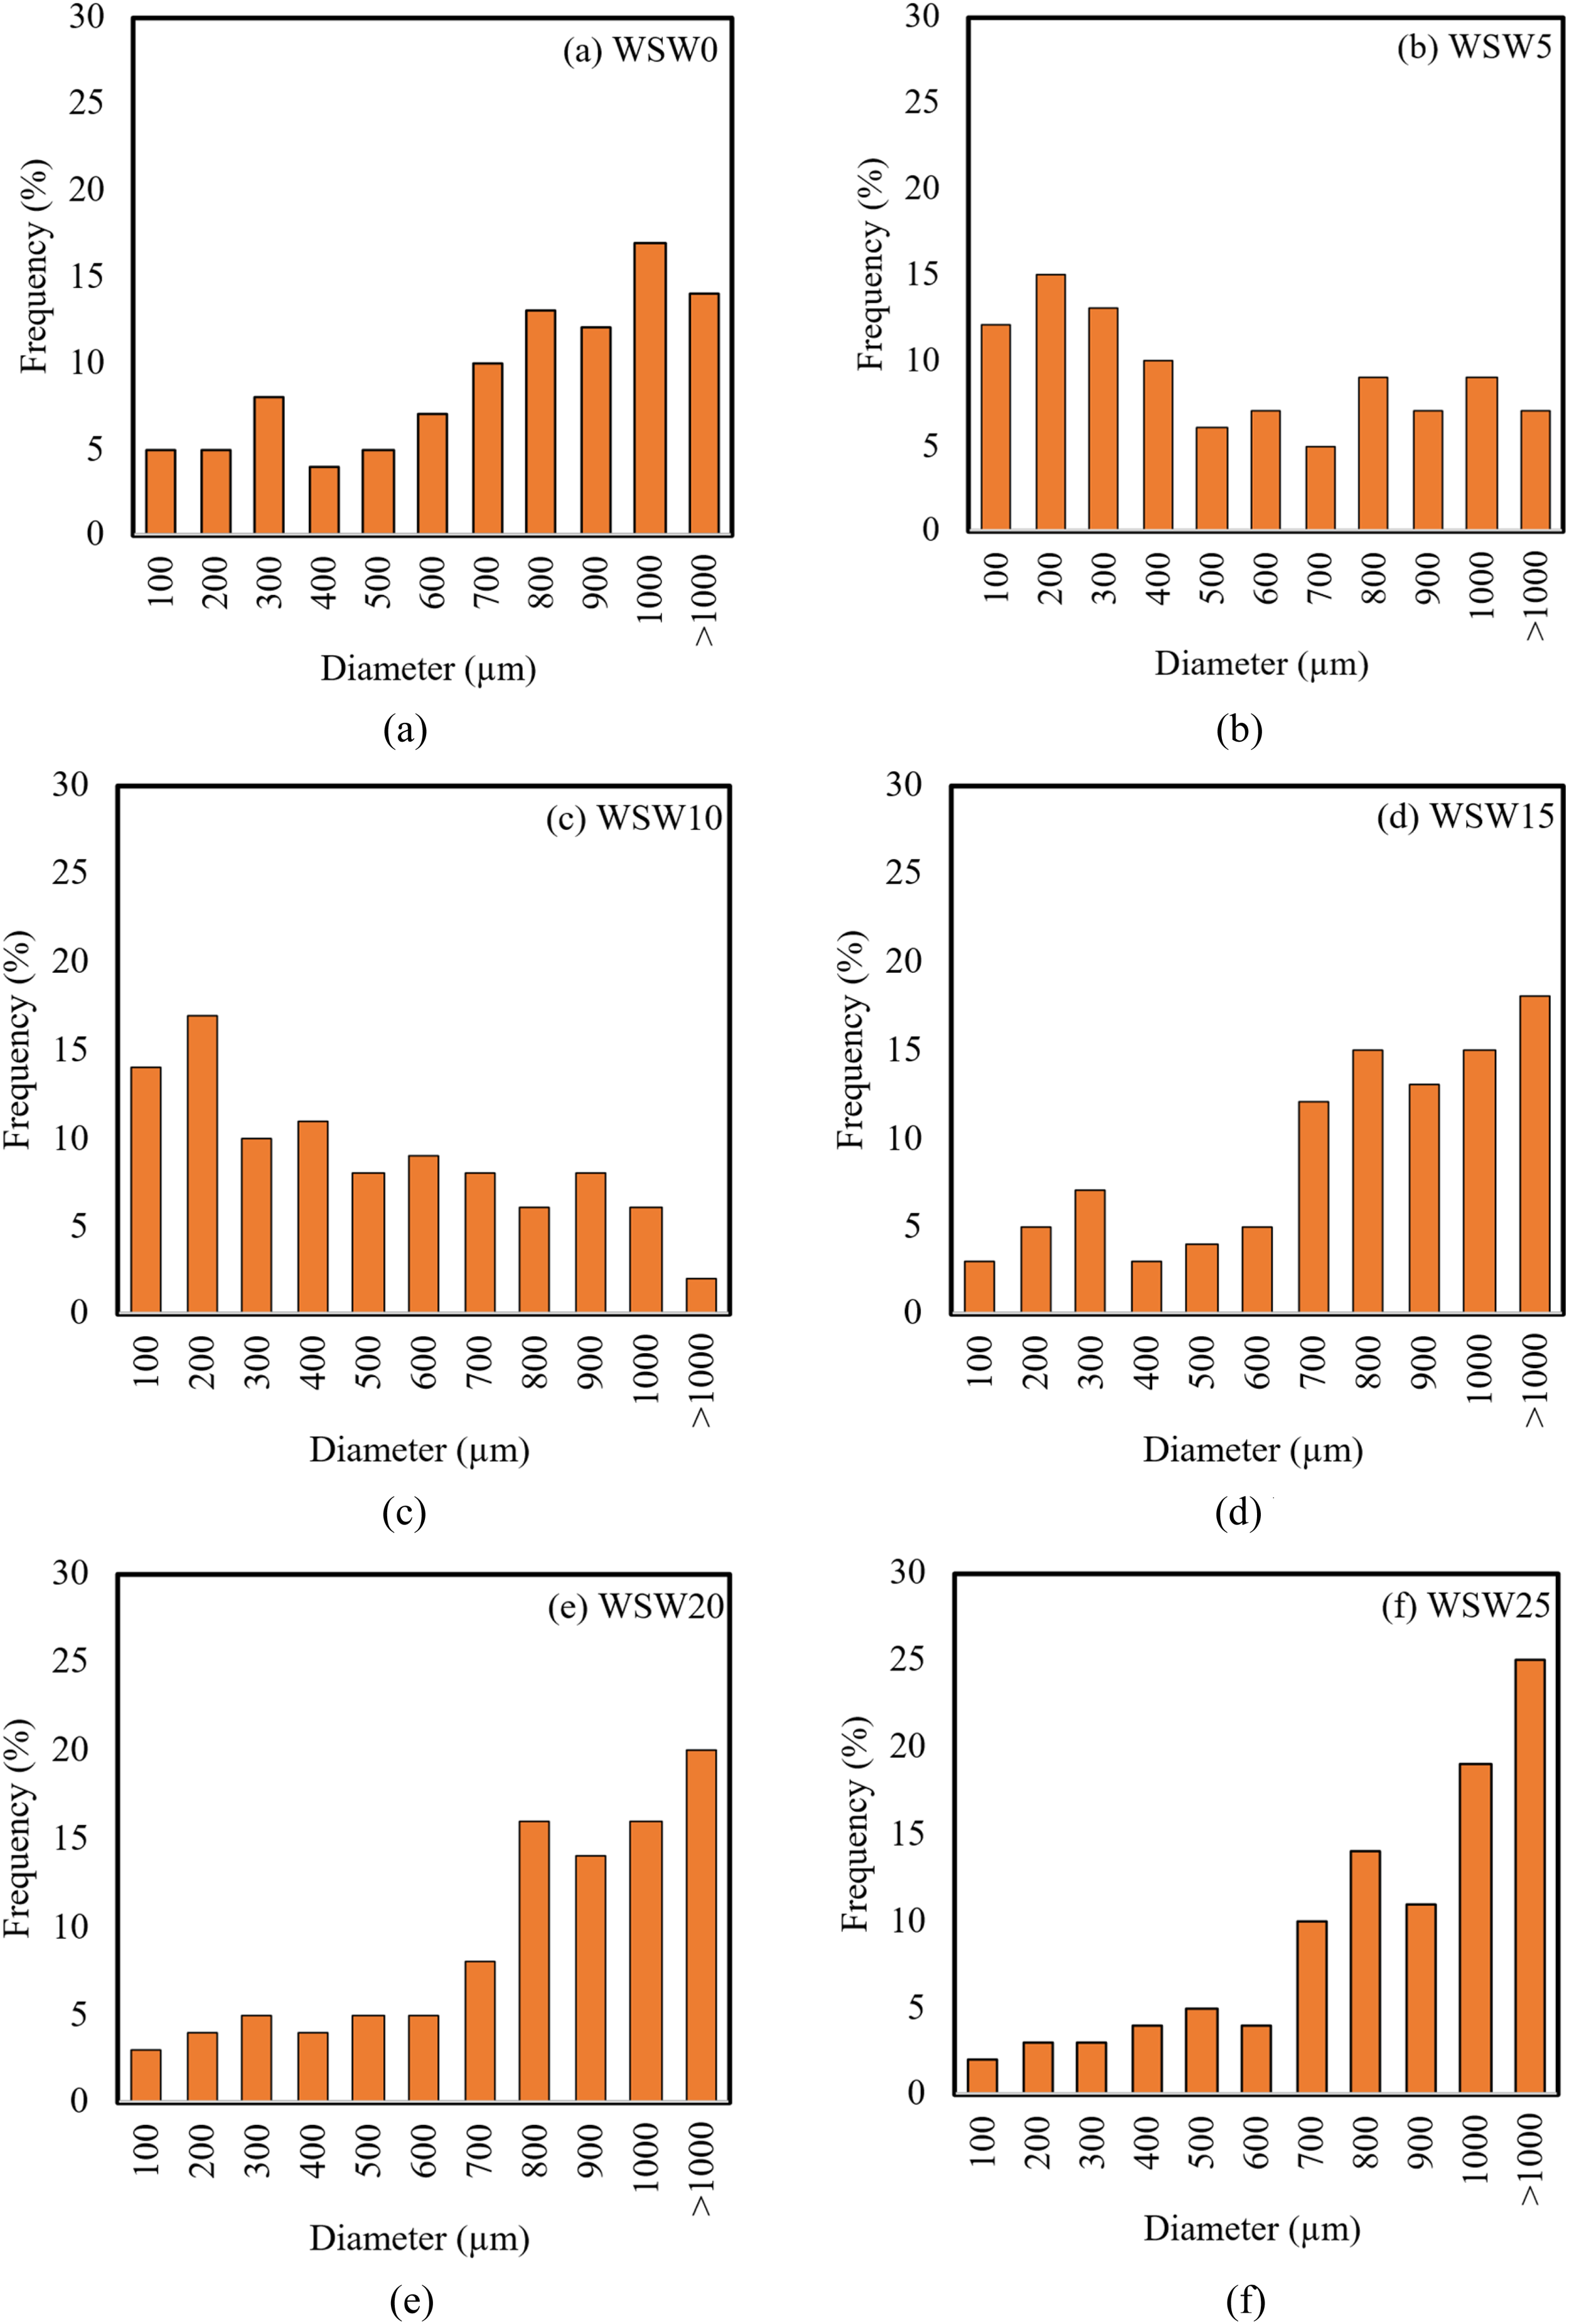
Pore distributions of FC containing various proportions of WSW as sand replacement. (a) WSW0. (b) WSW5. (c) WSW10. (d) WSW15. (e) WSW20. (f) WSW35.

Average pore diameter of FC containing various proportions of WSW as sand replacement.

Percentage distribution of fine capillary, large capillary, and large pores of FC containing various proportions of WSW as sand replacement.
The pozzolanic reaction mechanism of WSW is essential for enhancing the strength, durability, and sustainability of FC. When WSW, generally made of materials like porcelain, ceramics, and other vitrified substances, is utilized as a partial substitute for fine aggregates in FC, it might enhance the FC's performance due to its pozzolanic reactivity. 64 This is especially significant as FC frequently exhibits problems such as elevated porosity, inadequate strength, and restricted durability, particularly in harsh climatic conditions. WSW predominantly consists of silica (SiO₂), alumina (Al₂O₃), and trace quantities of other chemicals such as iron oxide (Fe₂O₃). These components, especially silica, can engage in pozzolanic reactions upon contact with calcium hydroxide (Ca(OH)₂), a byproduct generated during cement hydration. The pozzolanic process transpires when silica from WSW interacts with calcium hydroxide in the presence of moisture, resulting in the formation of calcium silicate hydrate (C-S-H) gel. The C-S-H gel serves as the principal binding phase in FC, contributing to the material's strength and cohesiveness inside the matrix. 55
In FC, when air voids are purposely incorporated for lightweight characteristics, the use of WSW not only facilitates the production of C-S-H gel but also improves the overall microstructure. The porous characteristics of FC can undermine its mechanical capabilities and durability, making this particularly significant. The creation of C-S-H occupies voids and fortifies the matrix, yielding a more cohesive and dense structure that improves the FC's resilience to water infiltration, chemical assault, and various environmental stresses. 62
In should be noted that the influence of WSW on the microstructure of FC is substantial. The pozzolanic reaction enhances the pore structure, resulting in a denser matrix that increases resistance to water absorption, chloride penetration, and various forms of chemical degradation. This is especially advantageous for FC, which is intrinsically more porous than conventional dense concrete, rendering it more susceptible to water and salt infiltration. Incorporating WSW diminishes the quantity of free calcium hydroxide in the system through the pozzolanic reaction, hence reducing porosity and enhancing the material's resistance to sulfate attack and alkali–silica reactions.
Nonetheless, as the replacement percentage exceeds 10%, the advantages of the pozzolanic reaction may be constrained. At elevated replacement levels, the quantity of unreacted silica and other nonreactive phases in WSW can become substantial, potentially leading to segregation, diminished workability, and inferior mechanical characteristics. Moreover, elevated substitution levels may lead to heightened porosity and diminished bond strength between the cement paste and aggregates, so impairing the overall efficacy of the pozzolanic reaction. 65 Consequently, it is essential to optimize the proportion of WSW utilized in FC to attain the intended enhancements in mechanical strength and durability, while avoiding adverse consequences.
From a sustainability standpoint, the use of WSW in FC mitigates the environmental effect of the construction sector through the recycling of waste materials, while simultaneously enhancing the environmental performance of FC. The pozzolanic reaction reduces the carbon footprint of FC by decreasing the reliance on conventional cement, which requires significant energy for production. Moreover, integrating WSW into FC enhances the circular economy by redirecting waste from landfills and utilizing it as a valuable resource in building. This method advances sustainability objectives by diminishing environmental pollutants and enhancing FC performance across diverse applications, including building insulation and structural components in demanding conditions.
Comparison of WSW-FC with other waste-based concrete
The integration of waste byproducts into concrete has emerged as a pivotal focus in sustainable construction. WSW-based FC demonstrates favorable outcomes in improving the strength, durability, and sustainability of concrete. It is essential to compare WSW with other frequently utilized waste-derived materials, including FA, CD, slag, rice husk ash (RHA), bottom ash (BA), and SF, to comprehensively assess the benefits and drawbacks of WSW in FC.
FA is a prevalent supplementary cementitious material produced by the combustion of coal in power generation facilities. 66 It is recognized for enhancing the workability, strength, and durability of concrete because to its tiny particle size and elevated reactivity. Compared to WSW, FA exhibits superior pozzolanic reactivity owing to its smaller particles and glassy silica content, hence enhancing sulfate the formation of calcium silicate hydrate (C-S-H) gel, which fortifies the FC matrix. 67 Both materials boost durability; however, FA has demonstrated superior resistance to and chloride assaults in FC, while WSW provides the advantage of incorporating construction waste. Nonetheless, FA possesses an environmental impact linked to coal burning, whereas WSW fosters a more sustainable circular economy through the recycling of construction waste.
CD, comparable to WSW, primarily comprises silica and alumina, rendering it a pozzolanic material capable of reacting with calcium hydroxide during cement hydration. 68 Both CD and WSW enhance the strength of FC by facilitating the production of C-S-H. Nonetheless, CD generally comprises finer particles, which can more effectively augment the pozzolanic process. 69 CD can adversely affect FC workability due to its fine, powdery consistency, but WSW, contingent on particle size, may enhance workability, particularly in FC. Additionally, similar to WSW, CD presents a means to recycle industrial waste, hence diminishing landfill accumulation and fostering sustainability within the construction sector.
Slag, particularly ground granulated blast furnace slag (GGBFS), is a byproduct of the iron and steel manufacturing process. 70 It is a highly reactive substance recognized for augmenting the mechanical strength and durability of FC. GGBFS has enhanced pozzolanic reactivity relative to WSW owing to its elevated glass content and finer particle dimensions. GGBFS markedly enhances durability against chemical assaults, including sulfate and chloride exposure, rendering it suitable for severe settings. 71 WSW-based FC enhances durability but may be less effective than slag under extreme conditions; yet, it presents a more sustainable alternative by utilizing waste materials from the construction industry, hence diminishing dependence on conventional cement production.
RHA is a highly reactive pozzolan derived from the combustion of rice husks and is abundant in silica. 72 RHA plays a crucial role in the early and long-term strength enhancement of FC and is extensively utilized in high-performance FC applications. 73 In comparison to WSW, RHA exhibits superior pozzolanic reactivity attributable to its tiny particle size and elevated silica concentration, resulting in enhanced strength and durability outcomes. Although WSW can enhance durability, its pozzolanic reactivity is often inferior to that of RHA. RHA's energy-intensive manufacturing process raises sustainability concerns, while WSW offers a more environmentally responsible alternative by recycling building waste.
BA, a byproduct of coal combustion, resembles FA in composition, predominantly including silica, alumina, and iron oxides. 74 Nevertheless, its reactivity is inferior to that of FA and WSW, constraining its efficacy in augmenting FC strength. The principal advantage of BA is its thermal insulation characteristics, rendering it appropriate for lightweight concrete applications. 75 In comparison to WSW, BA possesses a greater carbon content attributable to its coal combustion process, potentially undermining its sustainability. Although both materials mitigate landfill waste, WSW is more ecologically advantageous since it facilitates the recycling of construction debris, interpreting it a more sustainable option for FC manufacturing.
SF is a highly reactive pozzolan generated as a byproduct in the manufacturing of silicon and ferrosilicon alloys. 76 Its remarkable pozzolanic reactivity arises from its tiny particle size and elevated silica concentration, which substantially enhances the strength and durability of FC. 77 SF is more effective than WSW in improving the mechanical properties of FC, particularly in high-performance applications that demand superior endurance. WSW offers a more sustainable alternative by reusing construction waste materials instead of depending on the energy-intensive procedures linked to SF manufacture. Although SF significantly improves strength, WSW is a more environmentally sustainable alternative for construction.
In a nutshell, each waste-derived material offers distinct advantages and drawbacks when utilized in concrete manufacturing. While WSW presents considerable sustainability advantages via waste recycling, it may lack the mechanical strength and chemical resistance found in other commonly utilized materials such as FA or SF. WSW possesses the capability to enhance the durability and sustainability of FC, particularly in contexts where lightweight and recyclable materials are emphasized. Subsequent investigations should concentrate on enhancing the utilization of WSW with other waste-derived materials to optimize performance and environmental advantages, hence facilitating the wider adoption of sustainable construction techniques.
Conclusions
This study studied the effects of using sanitary ware powder (WSW) instead of sand in FC. Sand was substituted with 0%, 5%, 10%, 15%, 20%, and 25% WSW to create a variety of samples. These samples were tested for freshness, tensile strength, transportation, microstructure, pore structure, and thermal properties. The experimental results led to the following conclusions:
The test results indicate that the final and initial setting times and density characteristics of mixtures improve when WSW ash is used as a substitute. However, the slump drops. The inclusion of WSW into FC resulted in a significant enhancement in the mechanical characteristics. When the substitution ratio was 10%, the compressive strength rose by a maximum of 29.54%, the splitting strength rose by a maximum of 32.41%, and the flexural strength rose by 30.66% compared to the control mixture. This percentage was determined to be the optimal threshold for attaining the intended enhancements. The UPV exhibited a small improvement up to a 10% substitution ratio, but deteriorated at greater percentages. While introducing the use of WSW and reducing the amount of dry shrinkage at all stages of development, regardless of the proportion of replacement. The WSW-based FC demonstrates reduced water absorption, porosity, and sorptivity compared to the control specimen, with the most favorable outcomes observed for WSW10. The use of 10% WSW with FC results in a water absorption reduction of 12.68–13.76% compared to the control sample, lasting from 7 to 90 days. The diffusivity and conductivity tests showed an increase when WSW was added, mostly because the FC became less porous with a higher amount of WSW sand. However, substituting 10% of WSW can serve as an effective approach to producing environmentally friendly FC. The addition of up to 10% WSW to FC results in a considerable decrease in porosity and total pore volume, particularly in the content of pores with a diameter greater than 200 µm. However, there is an increase in the number of pores in the 100–200 µm range. This study recommends using up to 10% WSW in FC for optimal strength and durability. Future research should focus on long-term durability testing, cost-benefit analysis, field applications, recycling infrastructure, and exploring other waste materials to enhance concrete properties and promote sustainable construction.
Footnotes
Ethics
This work did not require ethical approval from a human subject or animal welfare committee.
Authors’ contributions
Md Azree Othuman Mydin—conceptualization, investigation, methodology, project administration, supervision, formal analysis, writing—original draft, and writing—review and editing; Nadhim Hamah Sor—methodology, formal analysis, writing—original draft, and writing—review and editing; Mohd Mustafa Al Bakri Abdullah—investigation, methodology, formal analysis, writing—original draft, and writing—review and editing; Haytham F. Isleem—methodology, formal analysis, writing—original draft, and writing—review and editing; Anmar Dulaimi—methodology, formal analysis, writing—original draft, and writing—review and editing; Paul O. Awoyera—methodology, supervision, writing—original draft, and writing—review and editing; Olaolu George Fadugba—methodology, writing—original draft, and writing—review and editing; and Taher A. Tawfik—methodology, writing—original draft, and writing—review and editing.
Funding
The authors thank the financial support received from the Ministry of Higher Education for this research work through the Fundamental Research Grant Scheme (FRGS/1/2022/TK01/USM/02/3).
Declaration of conflicting interests
The authors declared no potential conflicts of interest with respect to the research, authorship, and/or publication of this article.
Data accessibility
Data and code can be found here [97].
Declaration of AI use
We have not used AI-assisted technologies in creating this article.