
Abstract
This article addresses the challenges posed by the unique vapor–liquid physical properties of helium, specifically, focusing on the slosh of liquid helium caused by shaking during transportation. A three-dimensional model of a baffle structure is developed to prevent sloshing in the liquid helium portable tanks. Literature-based verification of simulation model via gas–liquid interface data shows <8.5% error, proving its effectiveness. The slosh characteristics are numerically compared, considering parameters such as phase interface area, internal temperature uniformity, and pressure variation at head. The results demonstrate that an optimal oscillation excitation amplitude of 5.57 m/s2 is identified. Investigating vapor–liquid phase, pressure, and velocity variations with/without baffles in liquid helium tanks. Additionally, the variation in liquid phase fraction with baffle is analyzed to assess their effectiveness in mitigating internal pressure impact during the storage and transportation. These insights hold significant implications for ensuring safe and efficient transportation of liquid helium on highways.
Keywords
Introduction
Helium is extensively utilized in aerospace, medical equipment, and semiconductor manufacturing. The cost-effectiveness of transporting liquid helium via portable tanks has been demonstrated. When the transportation reserves of a liquid helium portable tank reach 25,000 m3, which is 5.5 times 1 that of gas helium transportation, the production and storage mode involving liquid helium becomes widely adopted due to its efficiency. The power consumption for liquefying helium is approximately 20 times higher than that for air liquefaction. Thus, large capacity liquid helium storage tanks exhibit greater density for helium storage and lower daily evaporation rates compared to Dewar containers.
However, there exists a scenario in which the liquid contained within the tank experiences sloshing during transportation. This issue negatively impacts both stability and safety during transportation using liquid helium tank trucks. Base on the references, 1 baffle structure is used to restrain cryogenic liquid fluctuation. Liquid shaking is a typical free surface flow problem, in which the liquid filling rate, external excitation frequency and amplitude have an influence on the liquid shaking. Furthermore, research on the impact of internal obstructions within tanks on sloshing dynamic parameters has also been conducted. For instance, Kangda et al. 2 used numerical simulations to study how a central circular obstruction affects the sloshing frequency and mass of cylindrical tanks.
Existing studies mainly focus on the liquid hydrogen medium.3–8 Lv et al.'s study of thermodynamic behavior of LH2 tanks with baffles under sloshing conditions is crucial for enhancing the overall safety and performance of portable tanks, in which the intricate flow patterns and temperature distributions within the tank have been present to ensure its reliable operation. 4 Hou et al. have analyzed the evaporation and pressure changes during the storage and transportation of LH2 through a Computational Fluid Dynamics model, and proposed methods to optimize LH2 storage and transportation by adjusting baffles, amplitude, frequency, and storage pressure. 5 Liu et al. have studied the fluid thermal stratification phenomenon in nonisothermal liquid hydrogen storage tanks under sloshing excitation. By establishing a numerical model, the study has analyzed the impact of external heat leaks on the thermal performance of the fluid within the storage tank. 6 Wei and Zhang conducted a numerical study investigating the effects of sloshing conditions on the filling process of a liquid hydrogen storage tank, identifying critical sloshing amplitude and frequency thresholds that significantly impact the internal pressure curve during filling under normal and microgravity conditions. The potential flow theory is used in the two-dimensional (2D) nonlinear numerical model in liquid slosh analyses. 9 Based on the wave energy produced, the slosh process is calculated to increase the efficiency of harvester. 10 The liquid tank sloshing, characterized by strong nonlinearity and randomness. 11
Due to the unique physical properties of low-temperature liquid helium, particularly in terms of viscosity and latent heat, the dynamics of liquid helium sloshing diverge significantly from those of liquid hydrogen. The slosh influence on the transportation and storage is never researched. With lower viscosity, liquid helium's greater fluidity necessitates a nuanced understanding of its sloshing behavior, which is crucial for accurate predictions. Moreover, liquid helium's lower latent heat of vaporization suggests a distinct evaporation response during sloshing, influencing pressure buildup and temperature distribution within storage tanks. The research of liquid helium sloshing benefits for advancing cryogenic storage technologies and ensuring safer operations. These differences impact the variation laws and mechanisms governing liquid helium sloshing scenario. However, there are limited publications addressing the mechanism and application effects of the baffles suitable for handling liquid helium.
The numerical simulation is a useful method to analyze the performance in tanks.12,13 The technological advancements in computation hardware contributes to achieving fidelity in Finite Element Analysis models.14,15 These theories can effectively describe internal surging, rolling, or tilting movements. 16
Therefore, this article employs numerical simulation to analyze the fluctuation of liquid helium and investigate the inhibitory effect of a baffle in a shaking tank, aiming to provide theoretical support and practical guidance for the safe transportation of liquid helium portable tank. The sinusoidal oscillation excitation conditions are simulated to calculate the temperature uniform variation, vapor–liquid phase interface values and pressure fluctuations. Subsequently, an appropriate excitation is determined for effective storage and safe transportation. Furthermore, the excitation is used for comparing pressure distribution and liquid behavior with and without baffle structures. Finally, different accelerations ranging from 5 to 10 seconds are adopted to analyze liquid distribution and temperature variations. The slosh force, which is referred as maximum force in this study, serves as a reference value for assessing stability characteristics. 1
This study introduces several novel approaches in numerically investigating the slosh characteristics of liquid helium in portable tanks. Firstly, it uses the uniformity of the cross-sectional average temperature after model modeling as an index for comparison to evaluate the impact of internal temperature stratification, which can directly solve problems such as thermal flow caused by excessive internal temperature stratification in the tank. Meanwhile, it employs acceleration simulation method by applying various sinusoidal oscillatory excitation (SOE) conditions, accurately mimicking the acceleration and deceleration scenarios during transportation and identifying the optimal excitation amplitude. Secondly, property simulation by utilizing a property fitting equation approach is adopted in this article. Leveraging data from the Hepak software property package, it dynamically calculates liquid helium's physical properties, such as density and viscosity, through polynomial fitting techniques.
Theoretical analysis
Theoretical model
The three-dimensional (3D) theoretical model of liquid helium portable tank is depicted in Figure 1, illustrating two configurations: (a) without a baffle structure and (b) with a baffle structure. In this study, the impact of internal viscosity has been disregarded to facilitate the theoretical analysis of the 3D model.

A three-dimensional theoretical model of liquid helium portable tank (a) without a baffle structure and (b) with a baffle structure.
The theoretical model features a tank with a diameter of 2175 mm and a length of 11,130 mm. The baffle includes drilled cone surfaces at the top and bottom, with a round hole in the middle. The tank without baffle consists of two closed heads, devoid of any additional internal structures, shown in Figure 1(b). The inner diameter of the buffler is 2060 mm, the central hole diameter is 500 mm, the height of the middle plate is 1350 mm, the missing area of the wave guard is 0.385 m2, and the missing area of the middle circle of the wave guard is 0.196 m2.
In this paper, the FLUENT software is employed to analyze the internal situation during the shaking period for comprehensively investigating internal transient changes. A theoretical model incorporating Volume of Fluid (VOF) two-phase and Lee′s phase change model evaporation equations is developed, by importing liquid and gas phase density with user-defined function (UDF) according to the actual physical properties.
The VOF two-phase is shown in equations (1) to (3).
17


Lee equation is shown in equation (4).

When the liquid phase temperature is above the saturation temperature, the corresponding evaporation rate is

When the vapor phase temperature is below the saturation temperature, the condensation process occurs and the corresponding condensation rate is

Inside the tank, the tank volume is constant
18
and the volume change of liquid phase at different positions has the following relationship. Due to the short shaking time, the density is assumed to be constant during the process. Liquid phase volume fraction changes with time. The relationship between mass flow and liquid volume fraction at different locations is obtained. The internal shaking model is established, as shown in equations (7) to (13).


The quasi-static fluid dynamics method is employed to analyze the volumetric changes of the liquid phase at different positions, exhibiting the following relationship.
The liquid helium region and the gas helium region are separately patched, where the volume fractions of liquid phase are set to 1 and 0. The pressure gradient equation is defined individually for each region by patch. The initial temperature and pressure are specified as 4.2 K and 0.1013 MPa, correspondingly.
The heat flow density boundary is set at 0.15 W/m2, with a total heat leakage of 10 W. The wall boundaries are used as the only boundary conditions. The heat flow boundary condition is set to simulate the wall heat leakage situation. The initial condition is set by the initialization parameter, where the initial pressure of the contents is linear distribution by referring to the dielectric density at constant pressure. The pressure initialization setting of the gas phase and liquid phase is completed by function and area setting, respectively. The initial liquid level is set to 85.8% for simulating the wave suppression effect of the internal plate 19 with sufficient liquid level. The central XY section is set for liquid phase volume and wobble interface monitoring. Multiple horizontal XZ sections are set for temperature distribution monitoring. Multiple vertical YZ sections are set for speed distribution monitoring. Through the above section, the relationship of the gas-phase and liquid-phase helium variation with time in the tank is analyzed.
In transportation stage, liquid helium induces relative movement, and changes in the state of motion are primarily manifested through excitation. In order to meet braking requirements, such as those specified in standard,
4
the braking excitation

List of sinusoidal oscillation excitation conditions.

SOE: sinusoidal oscillatory excitation.
Based on this foundation, this study employs a combination of theoretical analysis and numerical simulations to establish a model for the transportation sloshing phenomenon in liquid helium portable tanks. The subsequent sections analyze the nonlinear transmission of internal liquid mass within the 3D storage tank under sinusoidal excitation.
Mean temperature calculation between layers
The schematic diagram in Figure 2 illustrates a 2D representation. For the analysis of the average temperature between layers, the XZ section has been selected. Considering the central symmetric axis of the theoretical model as the reference point 0 m, the Y-axis of the model encompasses five distinct section positions including −1, −0.5, 0, 0.5, and 1 m, respectively. These positions correspond to average temperatures denoted as T1, T2, T3, T4, and T5, respectively. The temperature gradient ratio for these distinct sections can be calculated by the following equation (15).

A two-dimensional schematic diagram.
Grid-independent calculation
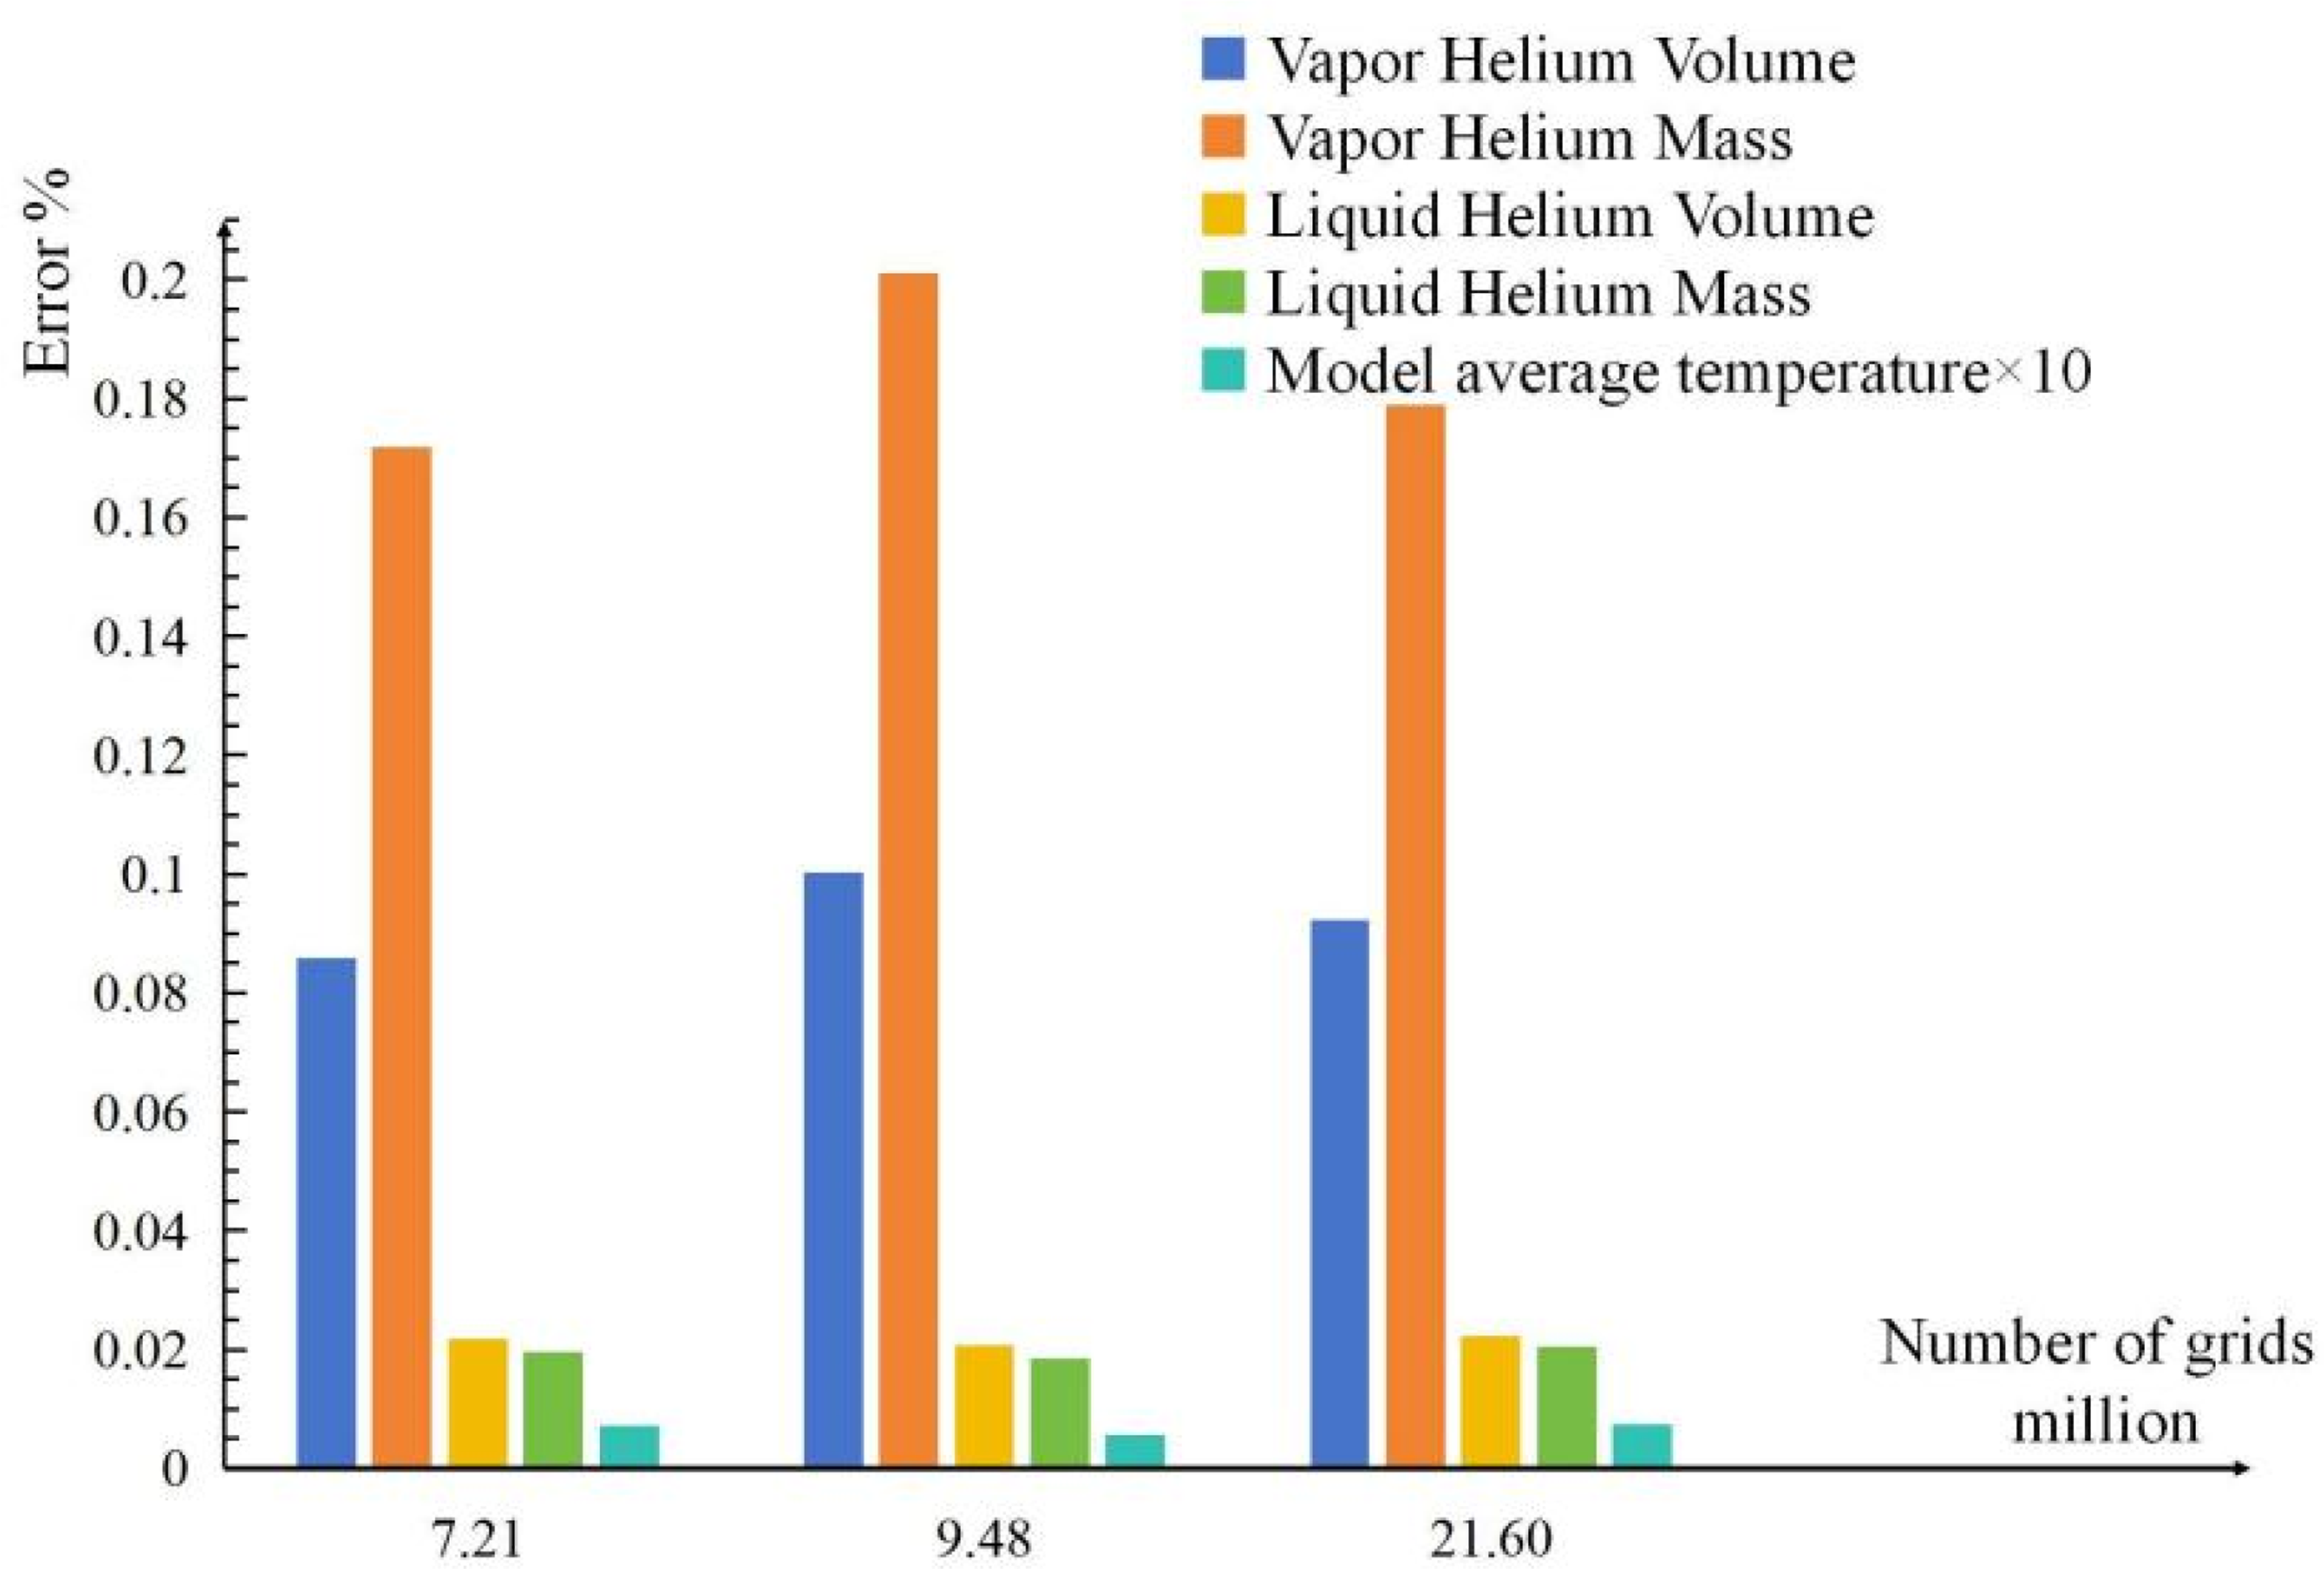
The regular hexahedral grid is employed as the primary grid structure, characterized by its high computational efficiency and accuracy. For the geometric model incorporating the baffle structure, grids numbering 7.21 million, 9.48 million, 21.6 million, and 42.52 million are generated. These models provided varying degrees of refinement within the domain. Upon comparing the computational outcomes across the different grid configurations, it became evident that as the grid density increased, the average temperature and gas–liquid mass volume errors diminished progressively. Models with a higher grid count exhibited superior accuracy in capturing intricate internal physical phenomena. Nonetheless, it should be noted that with the expansion of grid size, both computational time and resource utilization escalated, while the marginal improvement in accuracy diminished.
The error percentage is represented on the ordinate in Figure 3, which illustrates the validation of grid validity. This comprehensive comparison encompasses helium volume, helium mass, liquid helium volume, liquid helium mass, and mean gas temperature. The results reveal that internal errors are notably minimal, particularly when using a grid count of 7.21 million. Specifically, the average discrepancy between internal calculation outcomes is reduced from 0.1% to an impressive 0.086%. These refined outcomes more accurately reflect the physical properties during internal rest conditions. Furthermore, the optimized calculation results obtained from the 7.21 million grid configuration serve as a solid foundation for subsequent analyses. Based on the above grid generation experience, the number of grids generated by the geometric model without the baffle structure is 27.02 million.
Grid validity validation.
Therefore, after reviewing the literature, it was found that existing studies on water shaking are similar to this simulation. Thus, changes in the gas–liquid phase interface in the simulation data serve as one method to verify the model's effectiveness. The WebPlotDigitizer tool was used to obtain the liquid level ratio data from the literature. By comparing the shaking conditions with the liquid surface 20 described in the literature, coordinates were extracted with an error 0.2% compared to the original data. As shown in the Figure 4, it compares the position ratios of the gas–liquid phase interfaces. In Figure 4, it can be seen that the agreement is better on the right part, while there is some error on the left side, mainly due to differences in the structure and properties of the wave breakers. Therefore, by referring to the height difference of the liquid level on the right side section, it can be found that the error is less than 8.5%. This also demonstrates the effectiveness of the model from another perspective.

Comparison of model simulation results and experimental results extracted from literature.
The internal pressure variation was studied using experimental data. The analysis revealed the pressure variation law as shown in Figure 5. During the 55.6-hour test, the internal pressure variation trend was 0.357 Pa/s, which corresponds to approximately 0.03 MPa per day. Therefore, the pressure increase rate was relatively slow, and the pressure variation during the shaking period was small. Only the initial pressure, which was 100,000 Pa, was considered as the initial pressure.

Comparison of experiment data and numerical data.
LHe properties
During the numerical simulation, the thermophysical properties of liquid helium were determined using the Hepak software property package as the primary data source. Given the operational temperature range of interest, a three-order polynomial fitting technique was employed to derive temperature-dependent property correlations. The resulting polynomial coefficients, as summarized in Table 2, were subsequently implemented in the computational model through UDF routines to enable dynamic property calculations during simulation runs.
Helium property parameters.

Results and discussions
Simultaneous temperature distribution and simultaneous pressure with baffles under varying sinusoidal oscillation excitation conditions
During the shaking process, the internal medium exerts a significant influence on phase interface, internal temperature gradient and the head pressure. The k-ε model is often employed to simulate sloshing phenomena and two-phase flow problems. In these scenarios, turbulence significantly influences the behavior of the phase interface, the mixing process, and the transfer of momentum and energy. The sloshing of liquid within a container generates complex turbulent structures, and the k-ε model can be utilized to predict the energy dissipation, pressure fluctuations, and the forces exerted on the container walls caused by sloshing. As Table 3 shown, the setting parameters list is shown.
Setting parameters list.

As illustrated in Figure 6, under all SOE conditions, during the initial stage (0–3 s), the gas–liquid interface area exhibits a rapid increase over time. This occurs because external excitation disrupts the liquid's initial static state, inducing shaking and causing deformation and fragmentation of the liquid surface, which in turn increases the gas–liquid contact area. The more intense the shaking, the faster the rate of increase in the interface area. During the growth and change period (4–5 s), a larger shaking amplitude results in more fluid flow being obstructed by the breakwater plate, thereby reducing the interface area. Conversely, lower excitation allows the fluid to pass freely through the central hole of the breakwater plate without decreasing the interface area. At the peak and plateau stage (approximately 6 s), under different excitation conditions, the gas–liquid interface area reaches its respective peak or enters a fluctuating plateau phase. This indicates that the shaking has achieved a macroscopic dynamic equilibrium, with the fragmentation and recombination of the liquid surface reaching relative stability. Specifically, SOE 349 demonstrates more stable shaking, suggesting smaller fluctuations in the interface area or a quicker attainment of a relatively stable lower peak. In contrast, higher excitation leads to a higher peak in the interface area and more intense fluctuations. Regarding the influence of excitation amplitude, as the excitation amplitude of SOE increases, both the maximum value and the average fluctuation amplitude of the gas–liquid interface area also increase. Larger excitation inputs more energy into the system, resulting in more vigorous liquid shaking, higher wave peaks, deeper wave troughs, and more pronounced liquid surface fragmentation phenomena, all of which contribute to an increase in the gas–liquid interface area. In terms of stability, under lower excitation, the liquid surface predominantly exhibits relatively regular standing or traveling wave patterns with a smaller overall shaking amplitude, thus appearing “stable.” However, due to insufficient shaking intensity, internal mixing within the liquid may be inadequate. As the excitation amplitude increases, the shaking mode transitions from regular waves to more complex nonlinear waves, fragmented waves, or even chaotic states. This enhances mixing but may also introduce greater impact loads and instability.

The vapor–liquid phase interface area of the tank versus time under varying sinusoidal oscillation excitation conditions.
Figures 7 to 9 depict the sinusoidal oscillation excitation conditions in liquid helium portable tank, showcasing the instantaneous temperature variations T1 to T5. The simulation results demonstrate an intensified temperature stratification with increasing shaking excitation. Initially, the temperature stratification is relatively uniform, but gradually transitions to a more pronounced stratified state. This behavior can be attributed to two factors. Firstly, at lower excitations, the internal shaking amplitude is reduced. As a result, at the end of the shaking process, the temperature at the bottom remains below the tank's internal average temperature, indicating insufficient mixing. Secondly, excessive excitation causes violent liquid shaking within the tank, leading to a temperature at the bottom that exceeds the tank's internal average temperature. In turn, it contributes to an increase in the internal temperature difference.

Instantaneous temperature T1 to T5 under SOE 349 and SOE 453 condition in liquid helium portable tank. (a) SOE 349 and (b) SOE 453.

Instantaneous temperature T1 to T5 under SOE 505 and SOE 557 condition in liquid helium portable tank. (a) SOE 505 and (b) SOE 557.
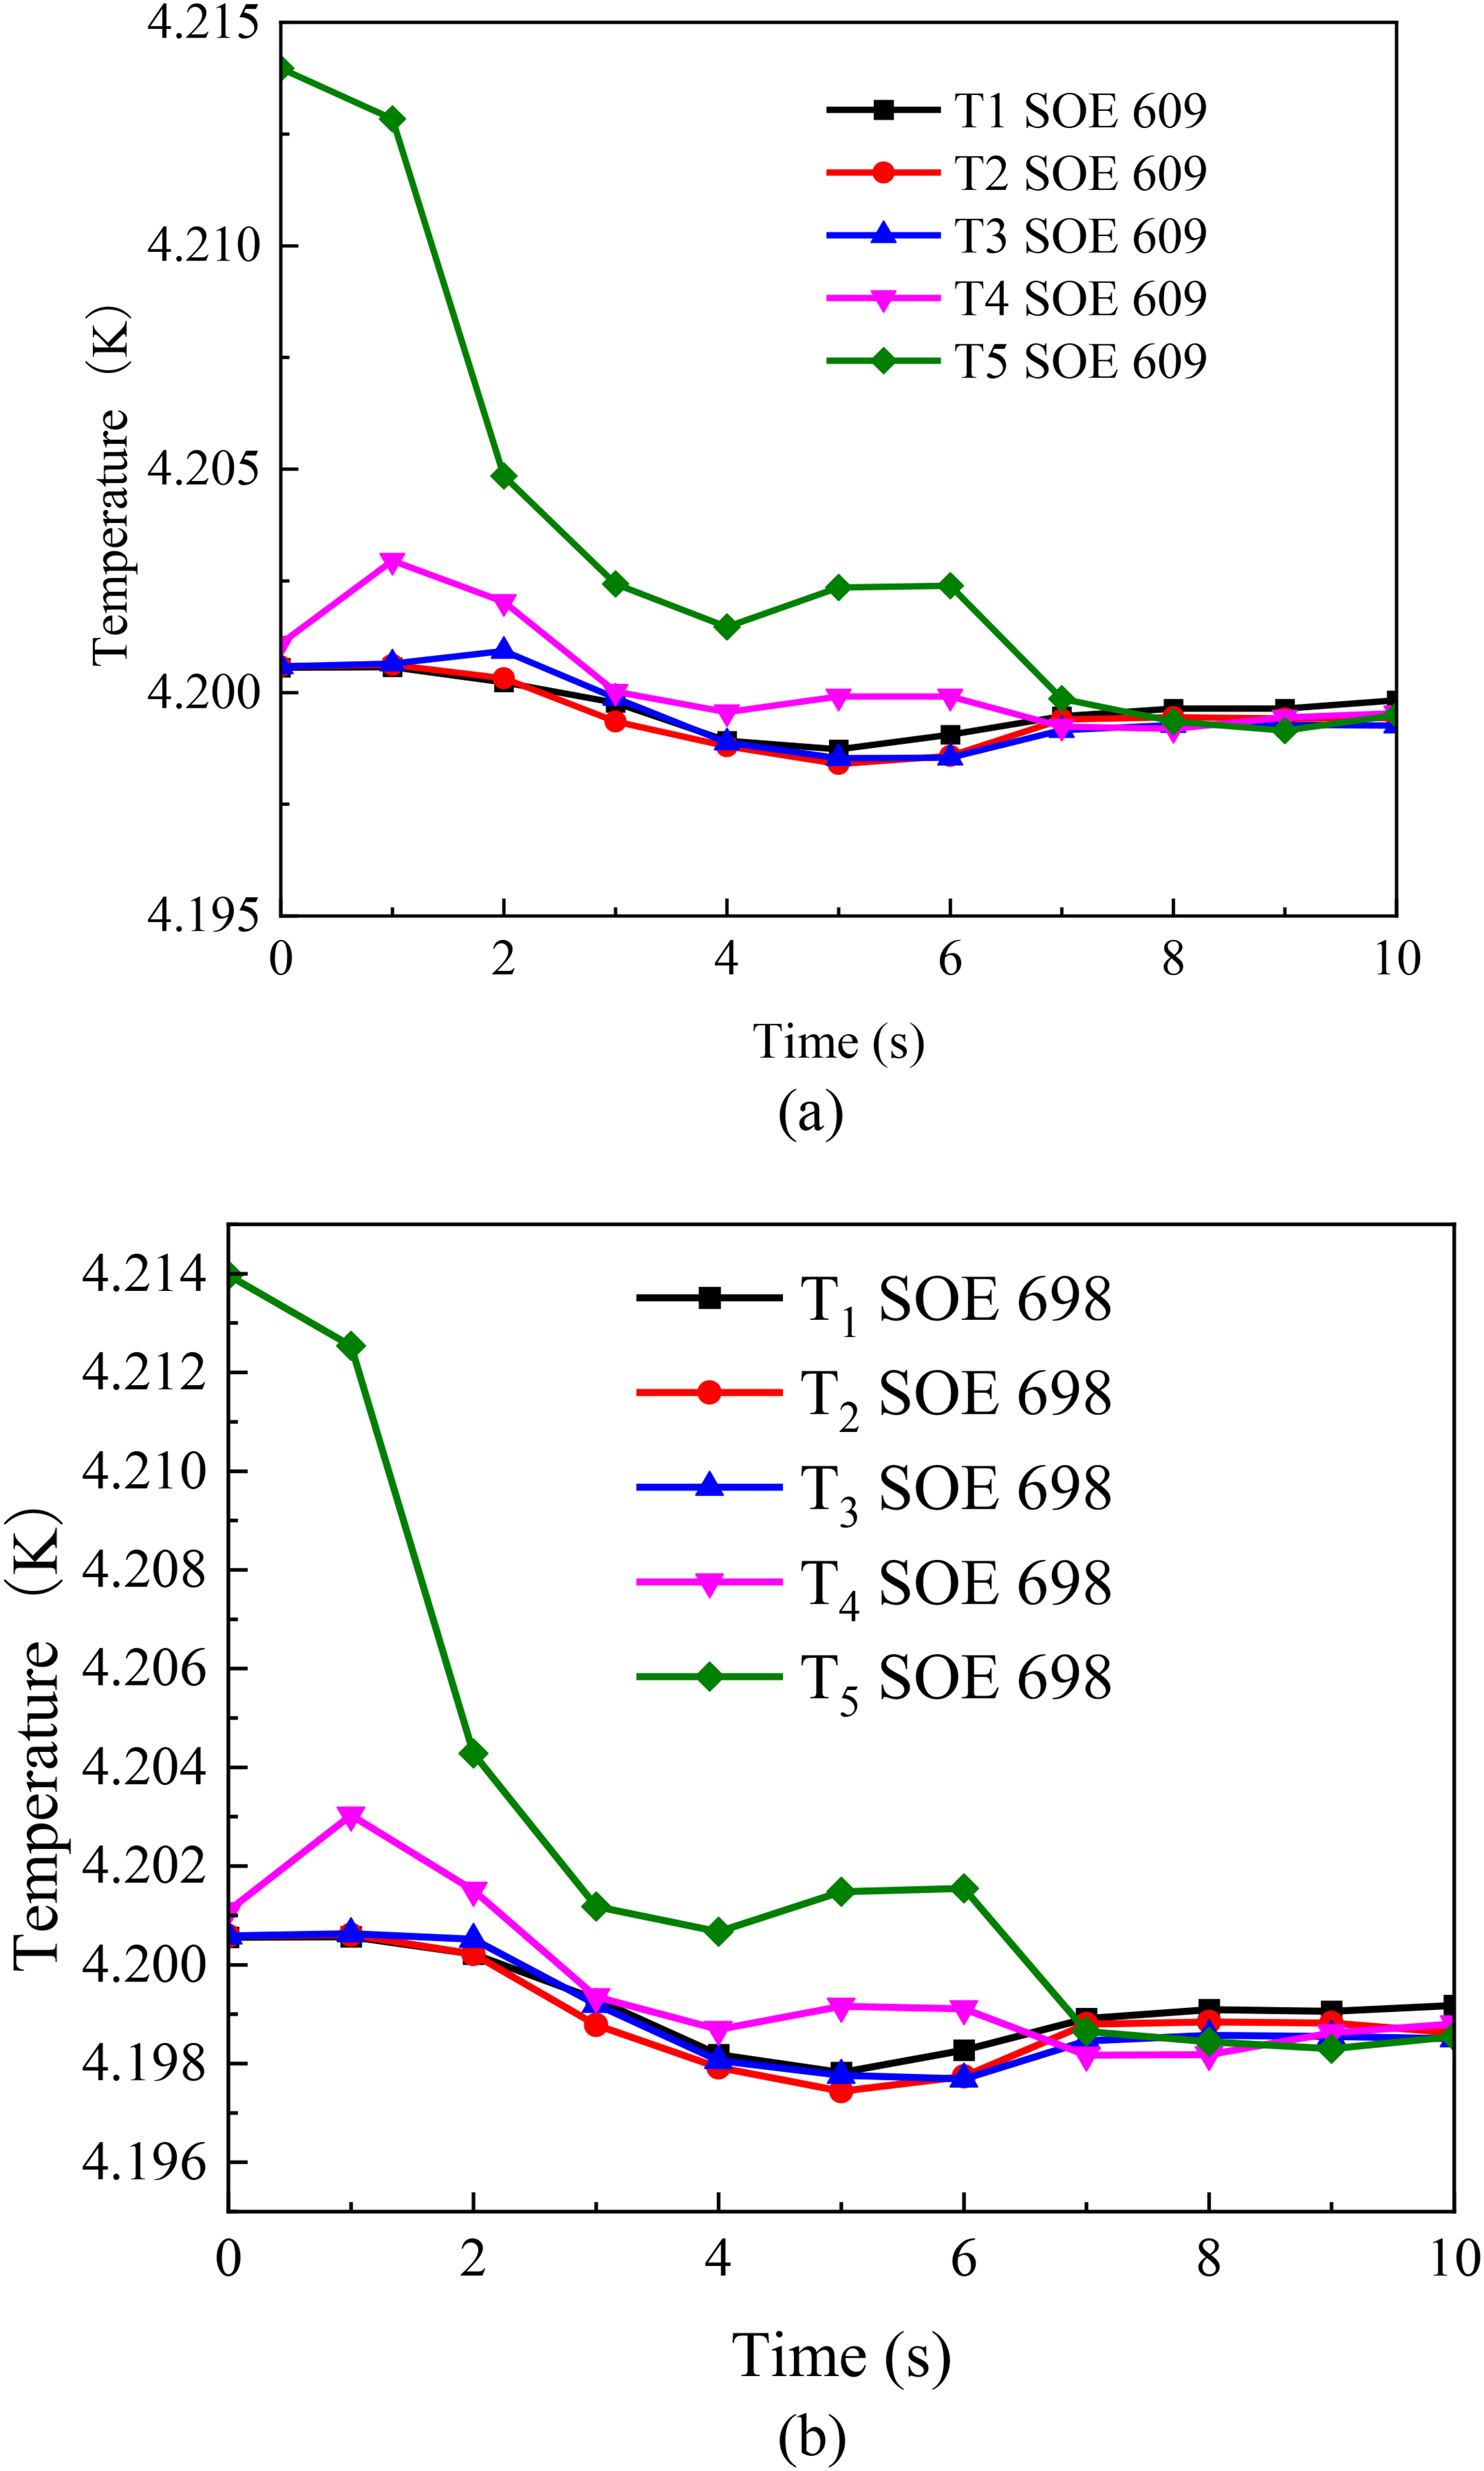
Instantaneous temperature T1 to T5 under SOE 609 and SOE 698 condition in liquid helium portable tank. (a) SOE 609 and (b) SOE 698.
The simultaneous pressure on the front and rear wall under SOE 349, SOE 557, and SOE 698 conditions in liquid helium portable tank is depicted in Figure 10. The pressure on the rear wall remains relatively stable over time, while the pressure on the front wall exhibits periodic fluctuations. As the amplitude of acceleration fluctuations progressively increases, distinct pressure ranges become evident. Specifically, in the case of SOE 349, the minimum pressure recorded is approximately 98,113.8 Pa, with a maximum pressure about 105,387 Pa. In contrast, for SOE 698, the minimum pressure is roughly 94,851.2 Pa, while the maximum pressure reaches approximately 107,994 Pa. The corresponding maximum force at the front and rear heads under different Sinusoidal oscillation Excitation conditions are presented in Table 4.

Simultaneous pressure of front and rear wall under SOE 349, SOE 557, and SOE 698 conditions in liquid helium portable tank.
The maximum force at the front and rear heads under different sinusoidal oscillation excitation conditions.

SOE: sinusoidal oscillatory excitation.
Volume fraction of vapor–liquid phase with and without baffles in liquid helium portable tank
During the shaking period, specific changes occur within the internal liquid, and pressure variations on both heads have significant implications for the safety of the liquid helium tank during transportation. Notably, excessive liquid helium levels pose a particular challenge. As the tank is transported, internal liquid shaking can lead to an uneven distribution of the liquid, potentially causing overflow on one side. Additionally, excessively high pressure at the front and rear heads can compromise the braking effectiveness during transport. To gain a detailed understanding of these internal liquid level changes, a thorough analysis of the simulation results is conducted.
The evolution of gas–liquid phase distribution with and without the baffle structures within the XY section of the tank is depicted in Figure 11. Figure 11 illustrates successive snapshots for when shaking begins until 10 seconds later. Initially, upon shaking initiation, a trough emerges at the plate, along with a surge like pattern in the central section of the liquid level. The maximum height difference at the plate reaches 0.182 m. Because of the elevated liquid level, the left compartment of the baffle rapidly fills, leading to a higher pressure on the rear head compared to the front, peaking at 0.103 MPa. However, as acceleration gradually diminishes, the tank transitions from acceleration to deceleration, causing the liquid to shift back towards the right side of the plate. The presence of the plate directs a portion of the fluid through its central area, resulting in a predominant gas phase space in this region. Consequently, the pressure at the front head exceeds that of the rear, with a maximum pressure of 0.106 MPa.
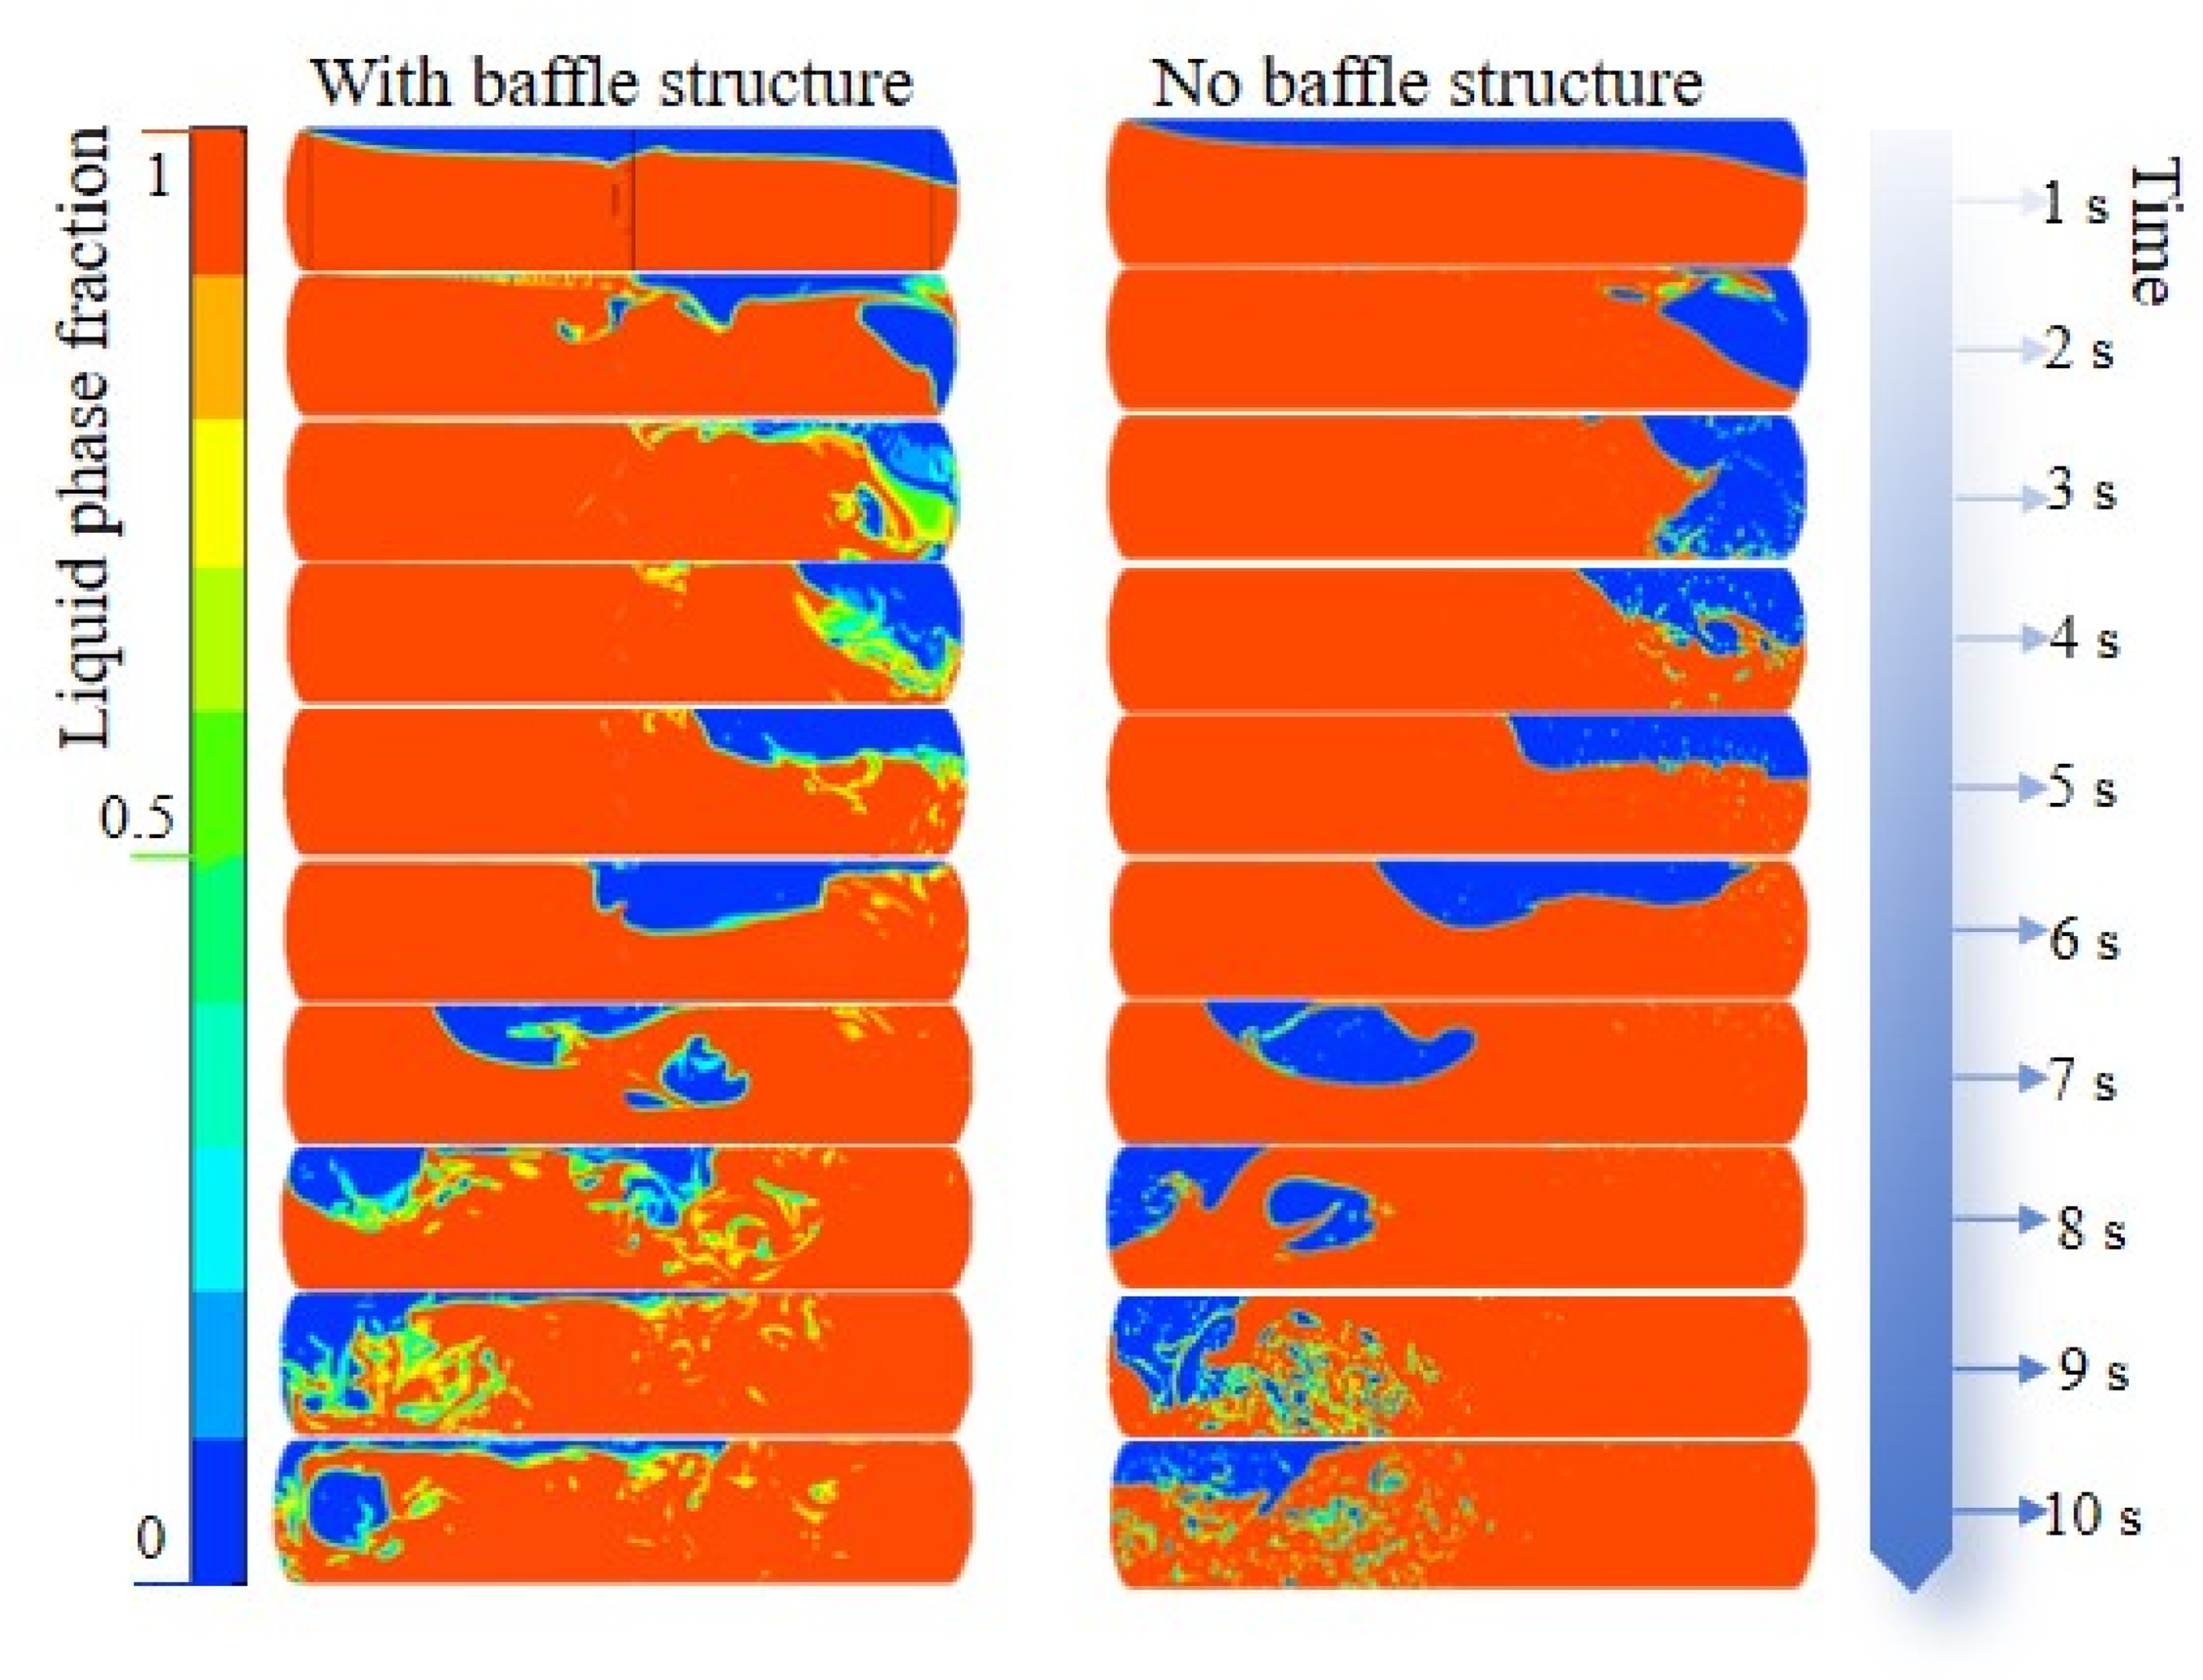
Gas–liquid phase distribution with and without the baffle structures in liquid helium portable tank.
Comparative study on the internal pressure, liquid change, and flow rate of the helium tank
The baffle structure serves as an efficient means to mitigate the liquid impact on the tank body. A comparison between tank with and without a baffle structure clearly demonstrates a significant reduction in current excitation during shaking. Figure 12 illustrates pressure changes of the front and rear heads with and without baffle structures. It is apparent that the pressure at the heads without baffle is higher than with baffle after the initial shaking. During this period, the internal liquid rapidly accumulates towards the tank's tail due to the absence of a baffle to impede its flow.
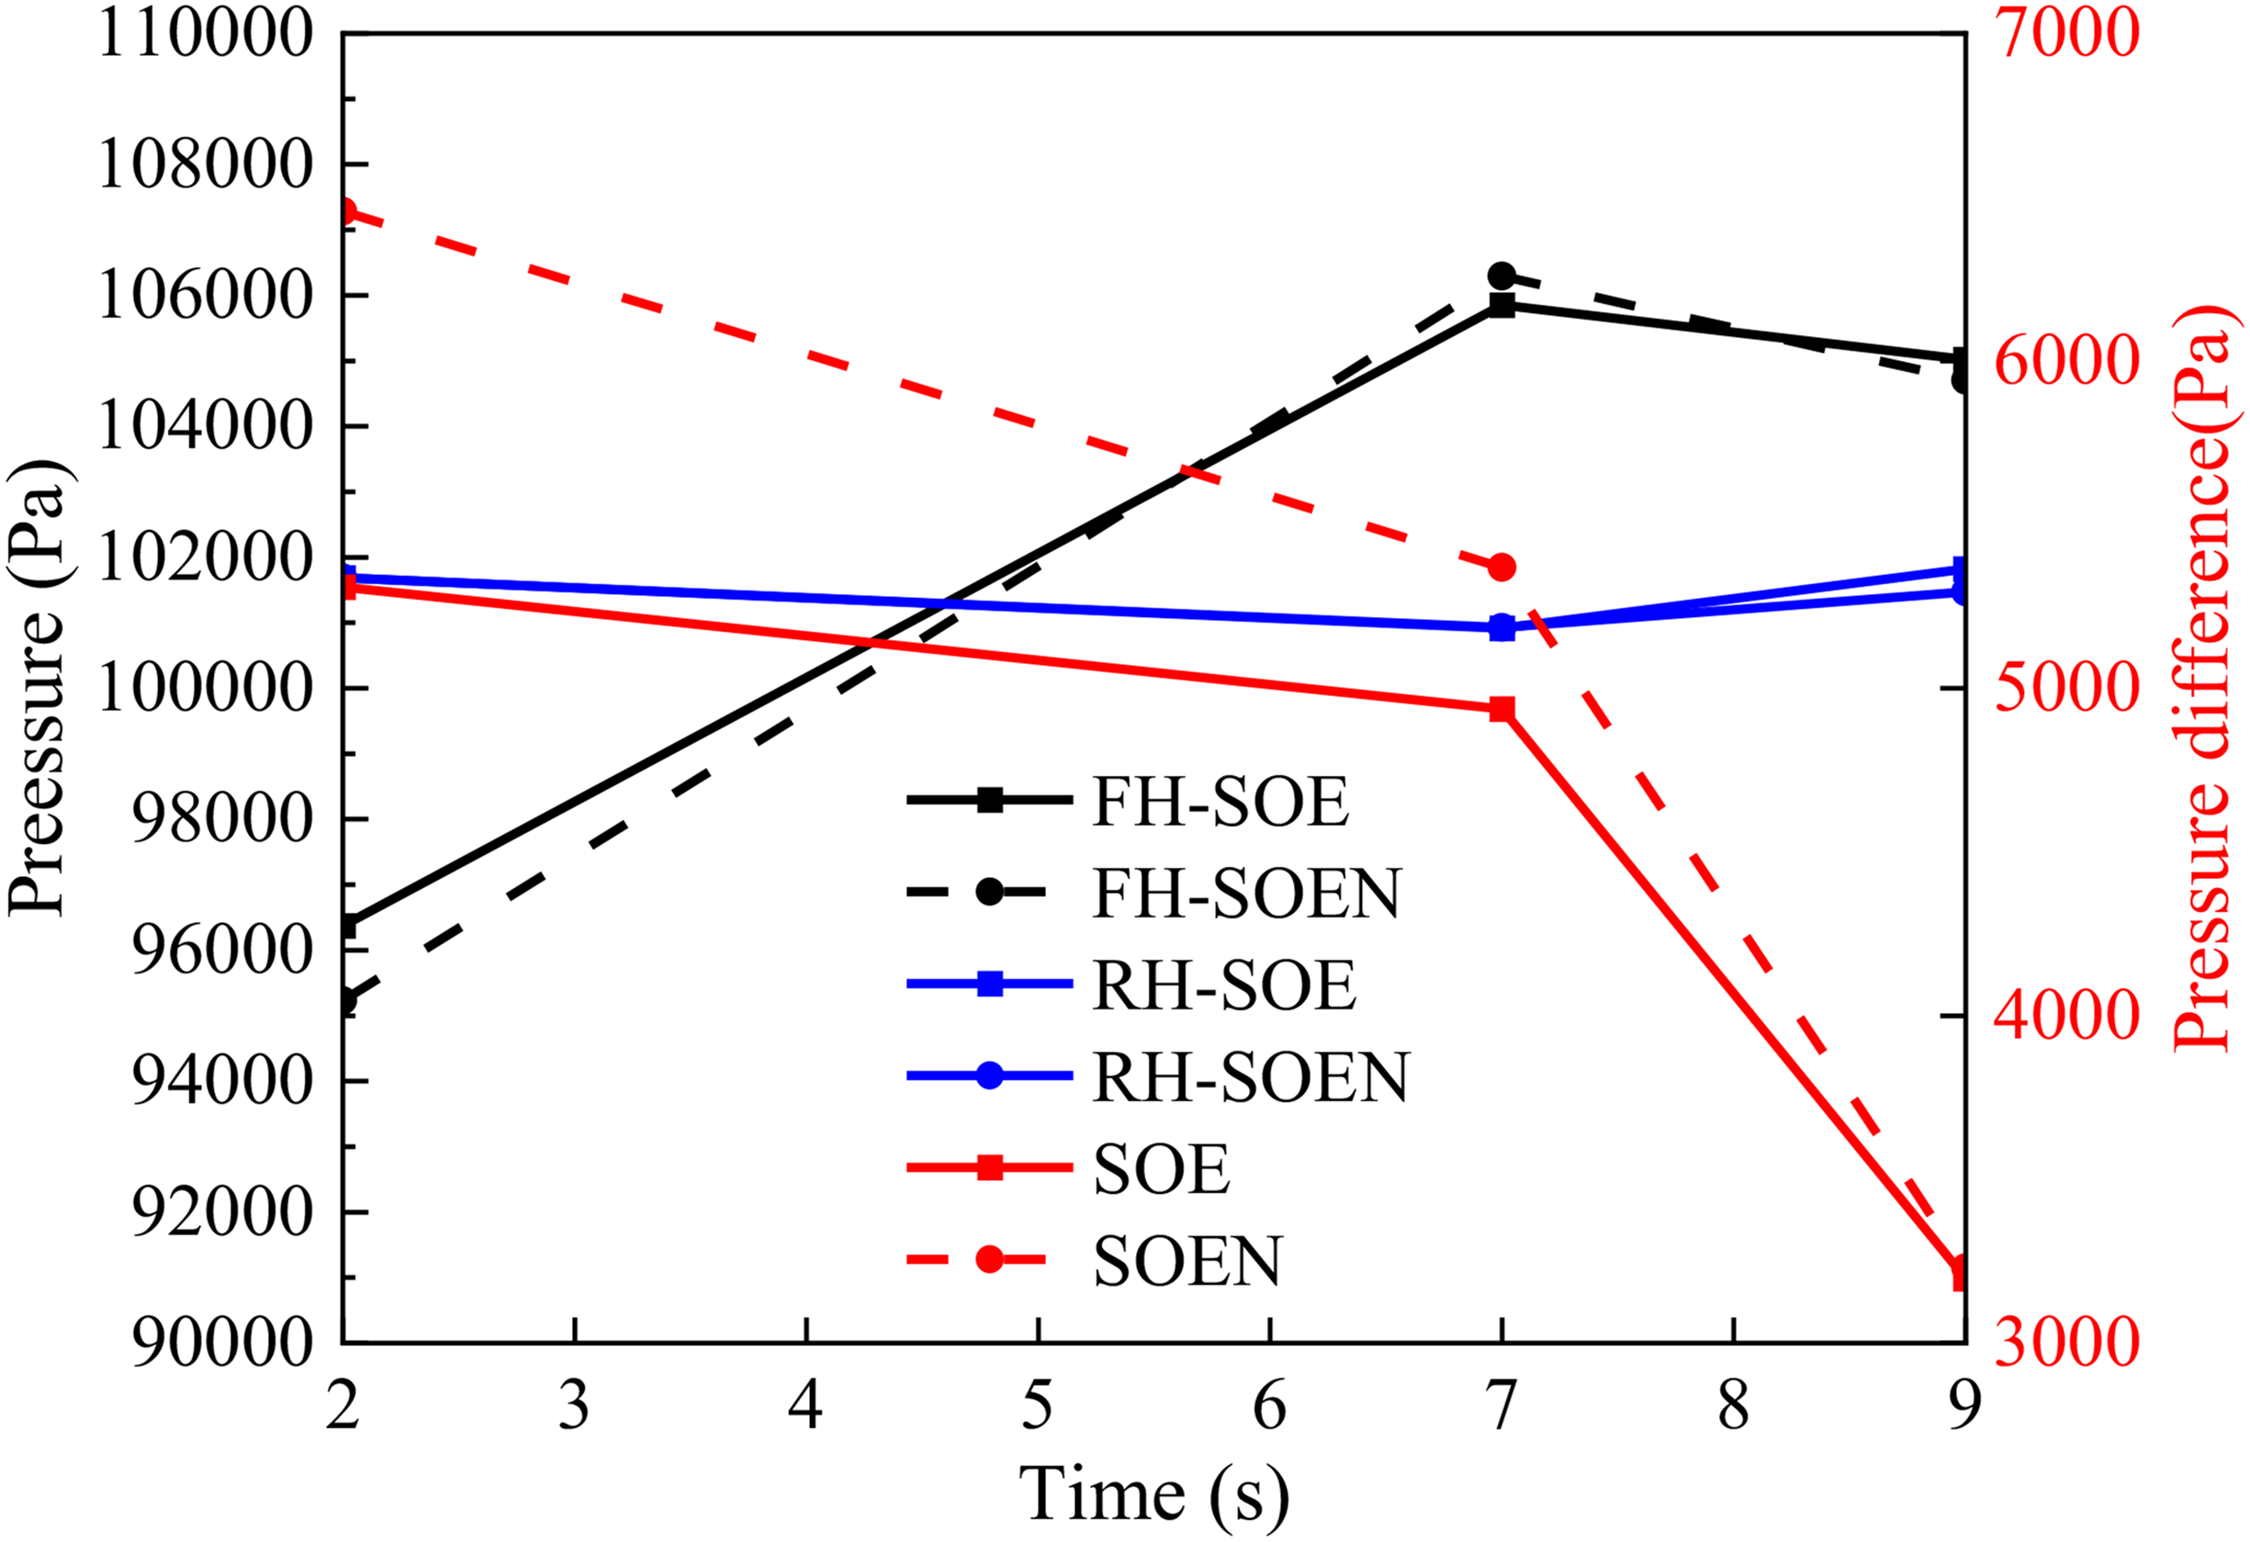
Pressure changes of the front and rear heads with and without baffle structures.
Furthermore, an analysis of pressure variations at the front and rear heads reveals that the presence of a baffle results in rapid decrease in pressure within the liquid helium head. However, it is worth noting that the conical design of the baffle leads to a reduction in the velocity of liquid flowing into the front head during the deceleration phase, resulting in an increase in pressure at the heads.
The velocity distribution within the tank interior is illustrated in Figure 13, comparing the case with and without baffle structures. As demonstrated in Figure 13, the baffle structure effectively diminishes the average surface flow rate across various YZ sections within the tank's interior. Specifically, the tank at the middle experiences the most significant reduction, with the surface flow rate decreasing from 1.3 to 1.03 m/s. At the 6-second mark, the baffle's influence is evident as it shifts the internal section forward. Consequently, the maximum velocity is observed at the X = 1 m section, reaching 2.58 m/s. In contrast, without the baffle, the maximum velocity would have occurred at the X = 2 m section, peaking at 2.47 m/s. This observation underscores the tapered baffle structure's efficacy in mitigating internal flow rates and advancing the cross-section of maximum flow rate under deceleration conditions.
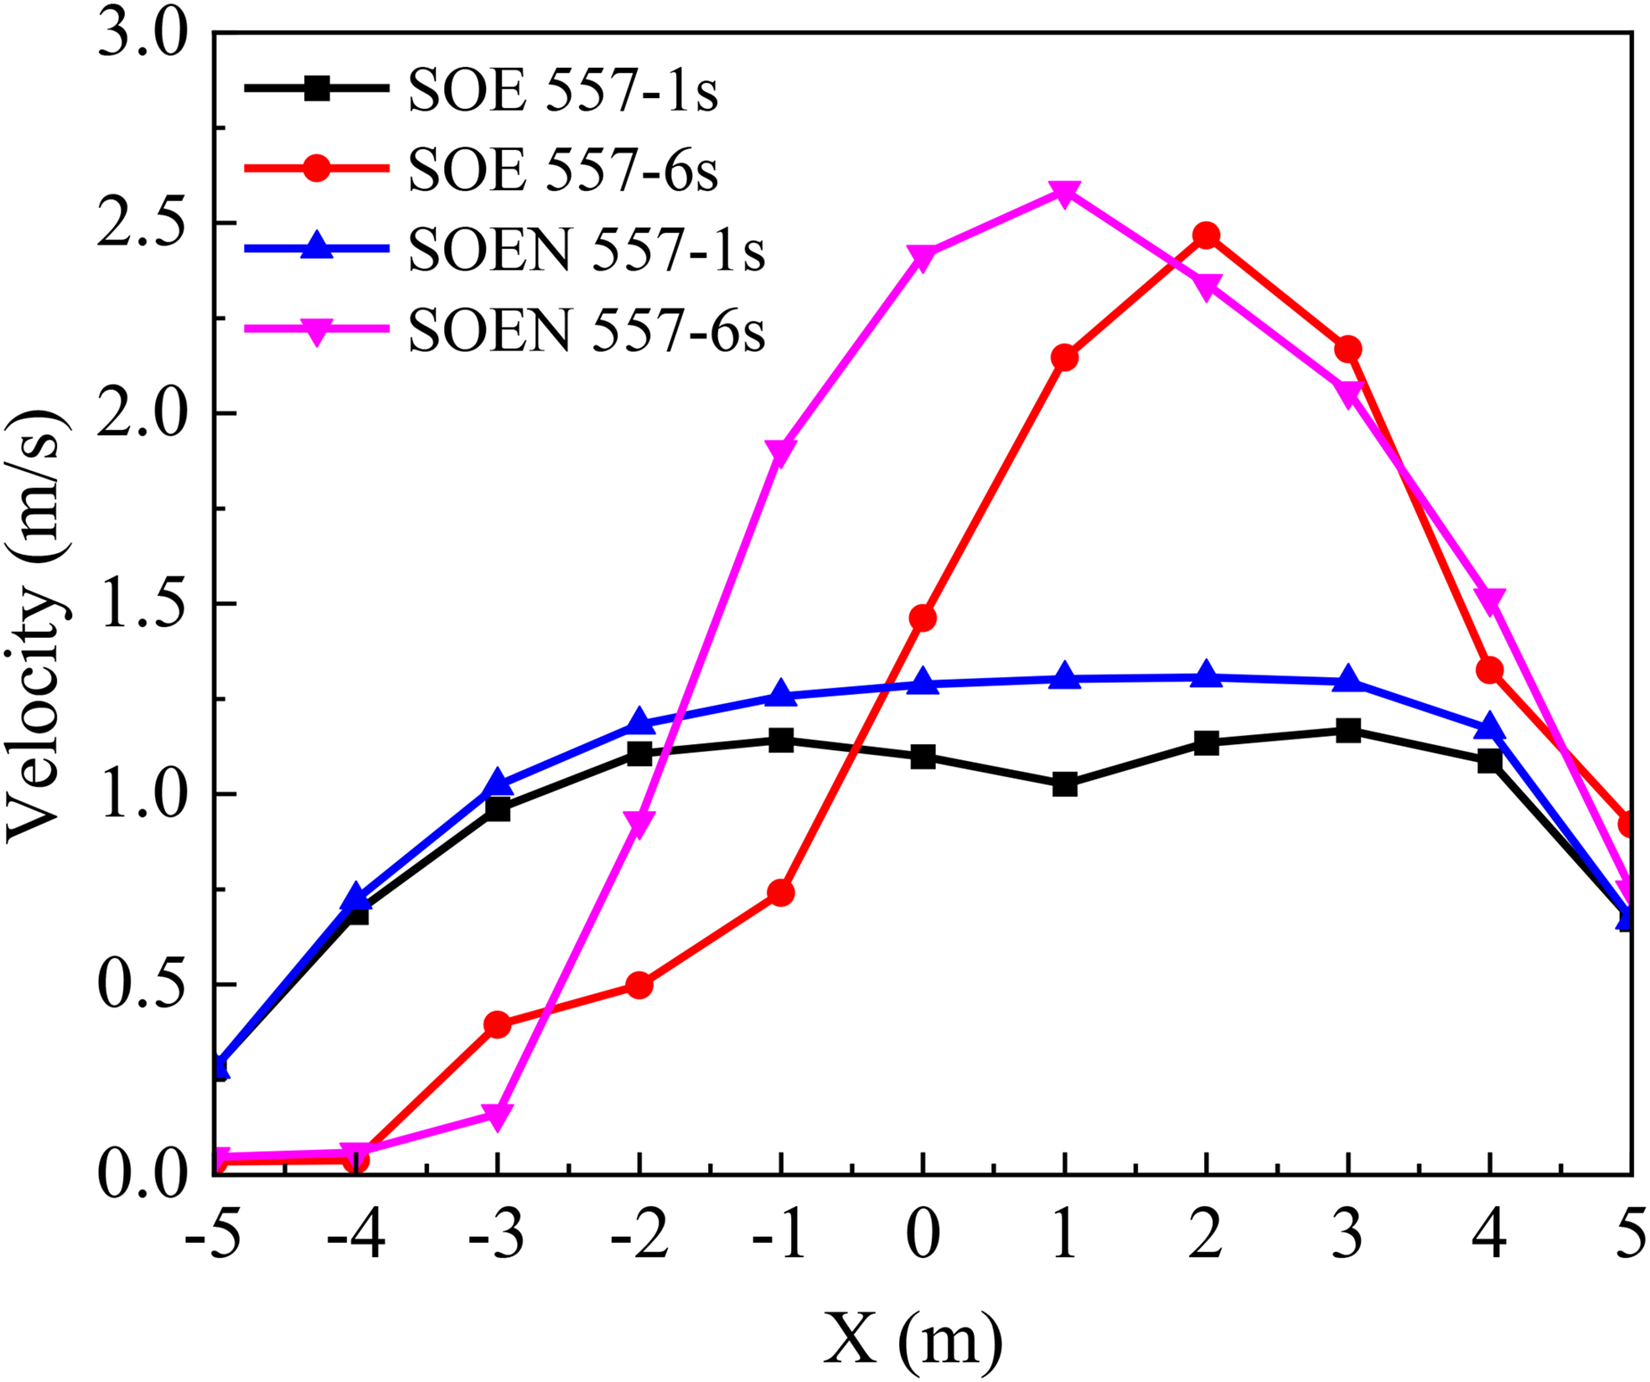
Comparison of internal flow velocity of with and without baffle structures.
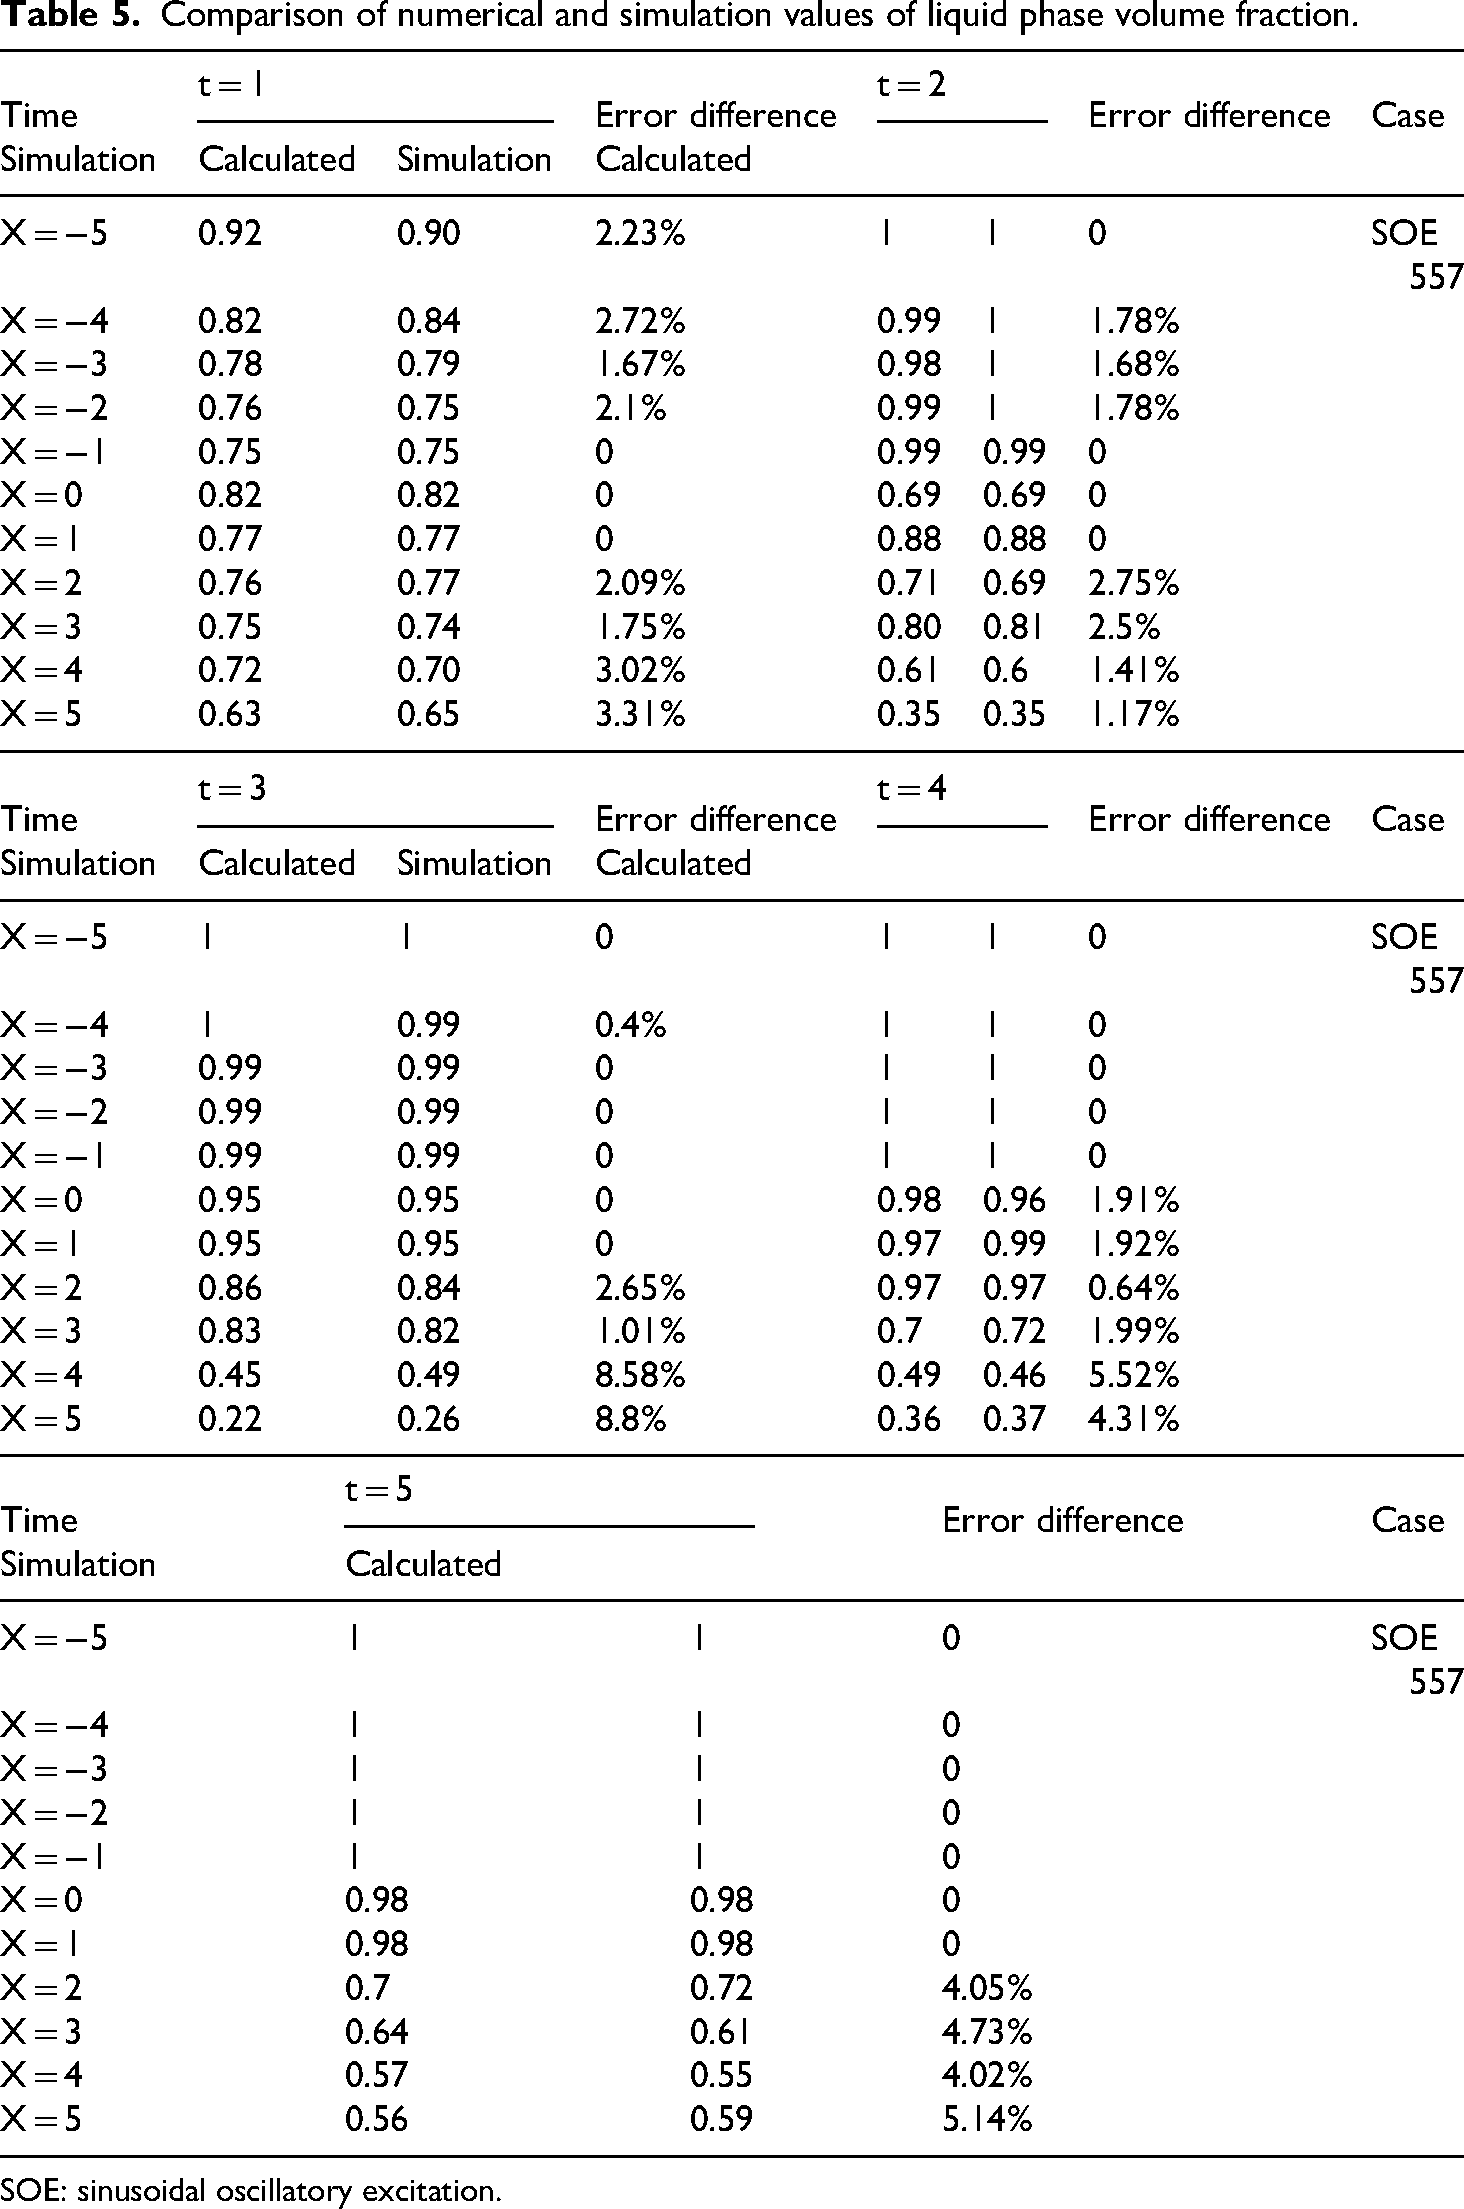
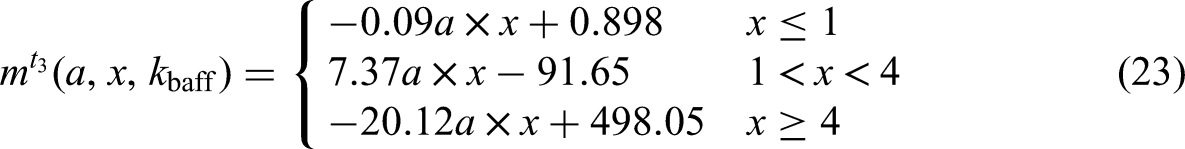
As depicted in Table 5, a comparison is drawn between the numerical and calculated values of the liquid phase volume fraction. Table 5 reveals a strong correlation between the two datasets, indicating that the numerical simulation values closely align with the calculated values. This congruence reflects the accurate portrayal of the internal liquid phase's behavioral patterns. Consequently, it can be inferred that the adopted calculation model proficiently simulates the distribution of the internal liquid phase. The calculation equation is as shown in equations (16) to (20). The error is within a controllable range.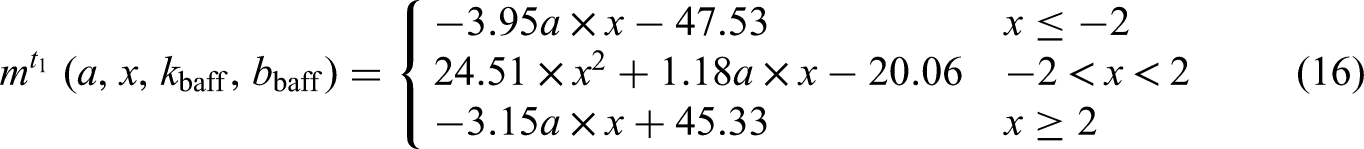


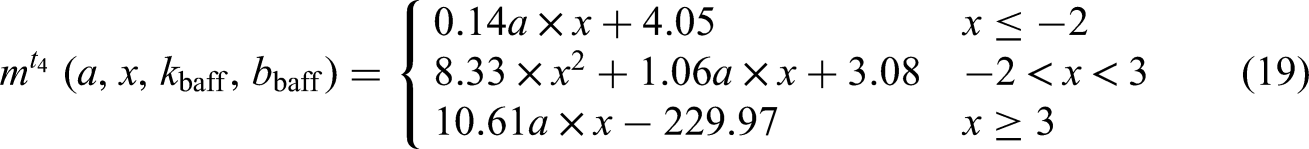

Comparison of numerical and simulation values of liquid phase volume fraction.
SOE: sinusoidal oscillatory excitation.
The calculation equation for SOEN 557 is as shown in equations (21) to (25). The error is within a controllable range. As depicted in Figure 14, a comparison is drawn between the numerical and calculated values of the liquid phase volume fraction in SOEN 557 condition.

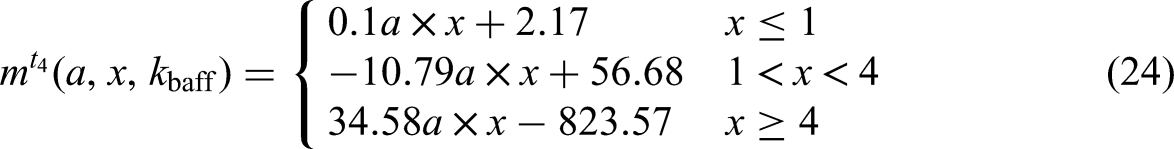


Comparison of numerical simulation value of liquid phase volume fraction in SOEN 557.
Analysis of the different shaking condition from 5 seconds to 10 seconds
In the SOE 5570 condition, the liquid helium portable tank undergoes an acceleration phase with sinusoidal acceleration of 5 seconds, followed by a constant speed period.
As illustrated in Figure 15, under the specified conditions of SOE 557 and SOE 5570, at 5 seconds, there a predominant concentration of liquid phase on the left side, while a higher presence of gas phase is observed on the right side. By the time it reaches 6 seconds, in the case of SOE 557, there is minimal change in volume fraction on the left side of the baffle. However, for SOE 5570 condition, there is an increased accumulation of fluid at the baffle and a reduction of right-side liquid level. The liquid phase volume fraction at the right end of the tank increases modestly from 55.88% to 77.44%. Notably, at its peak value during this period, 7 seconds, it reaches only up to 82.6%, significantly lower than the 99.1% observed in SOE 557.
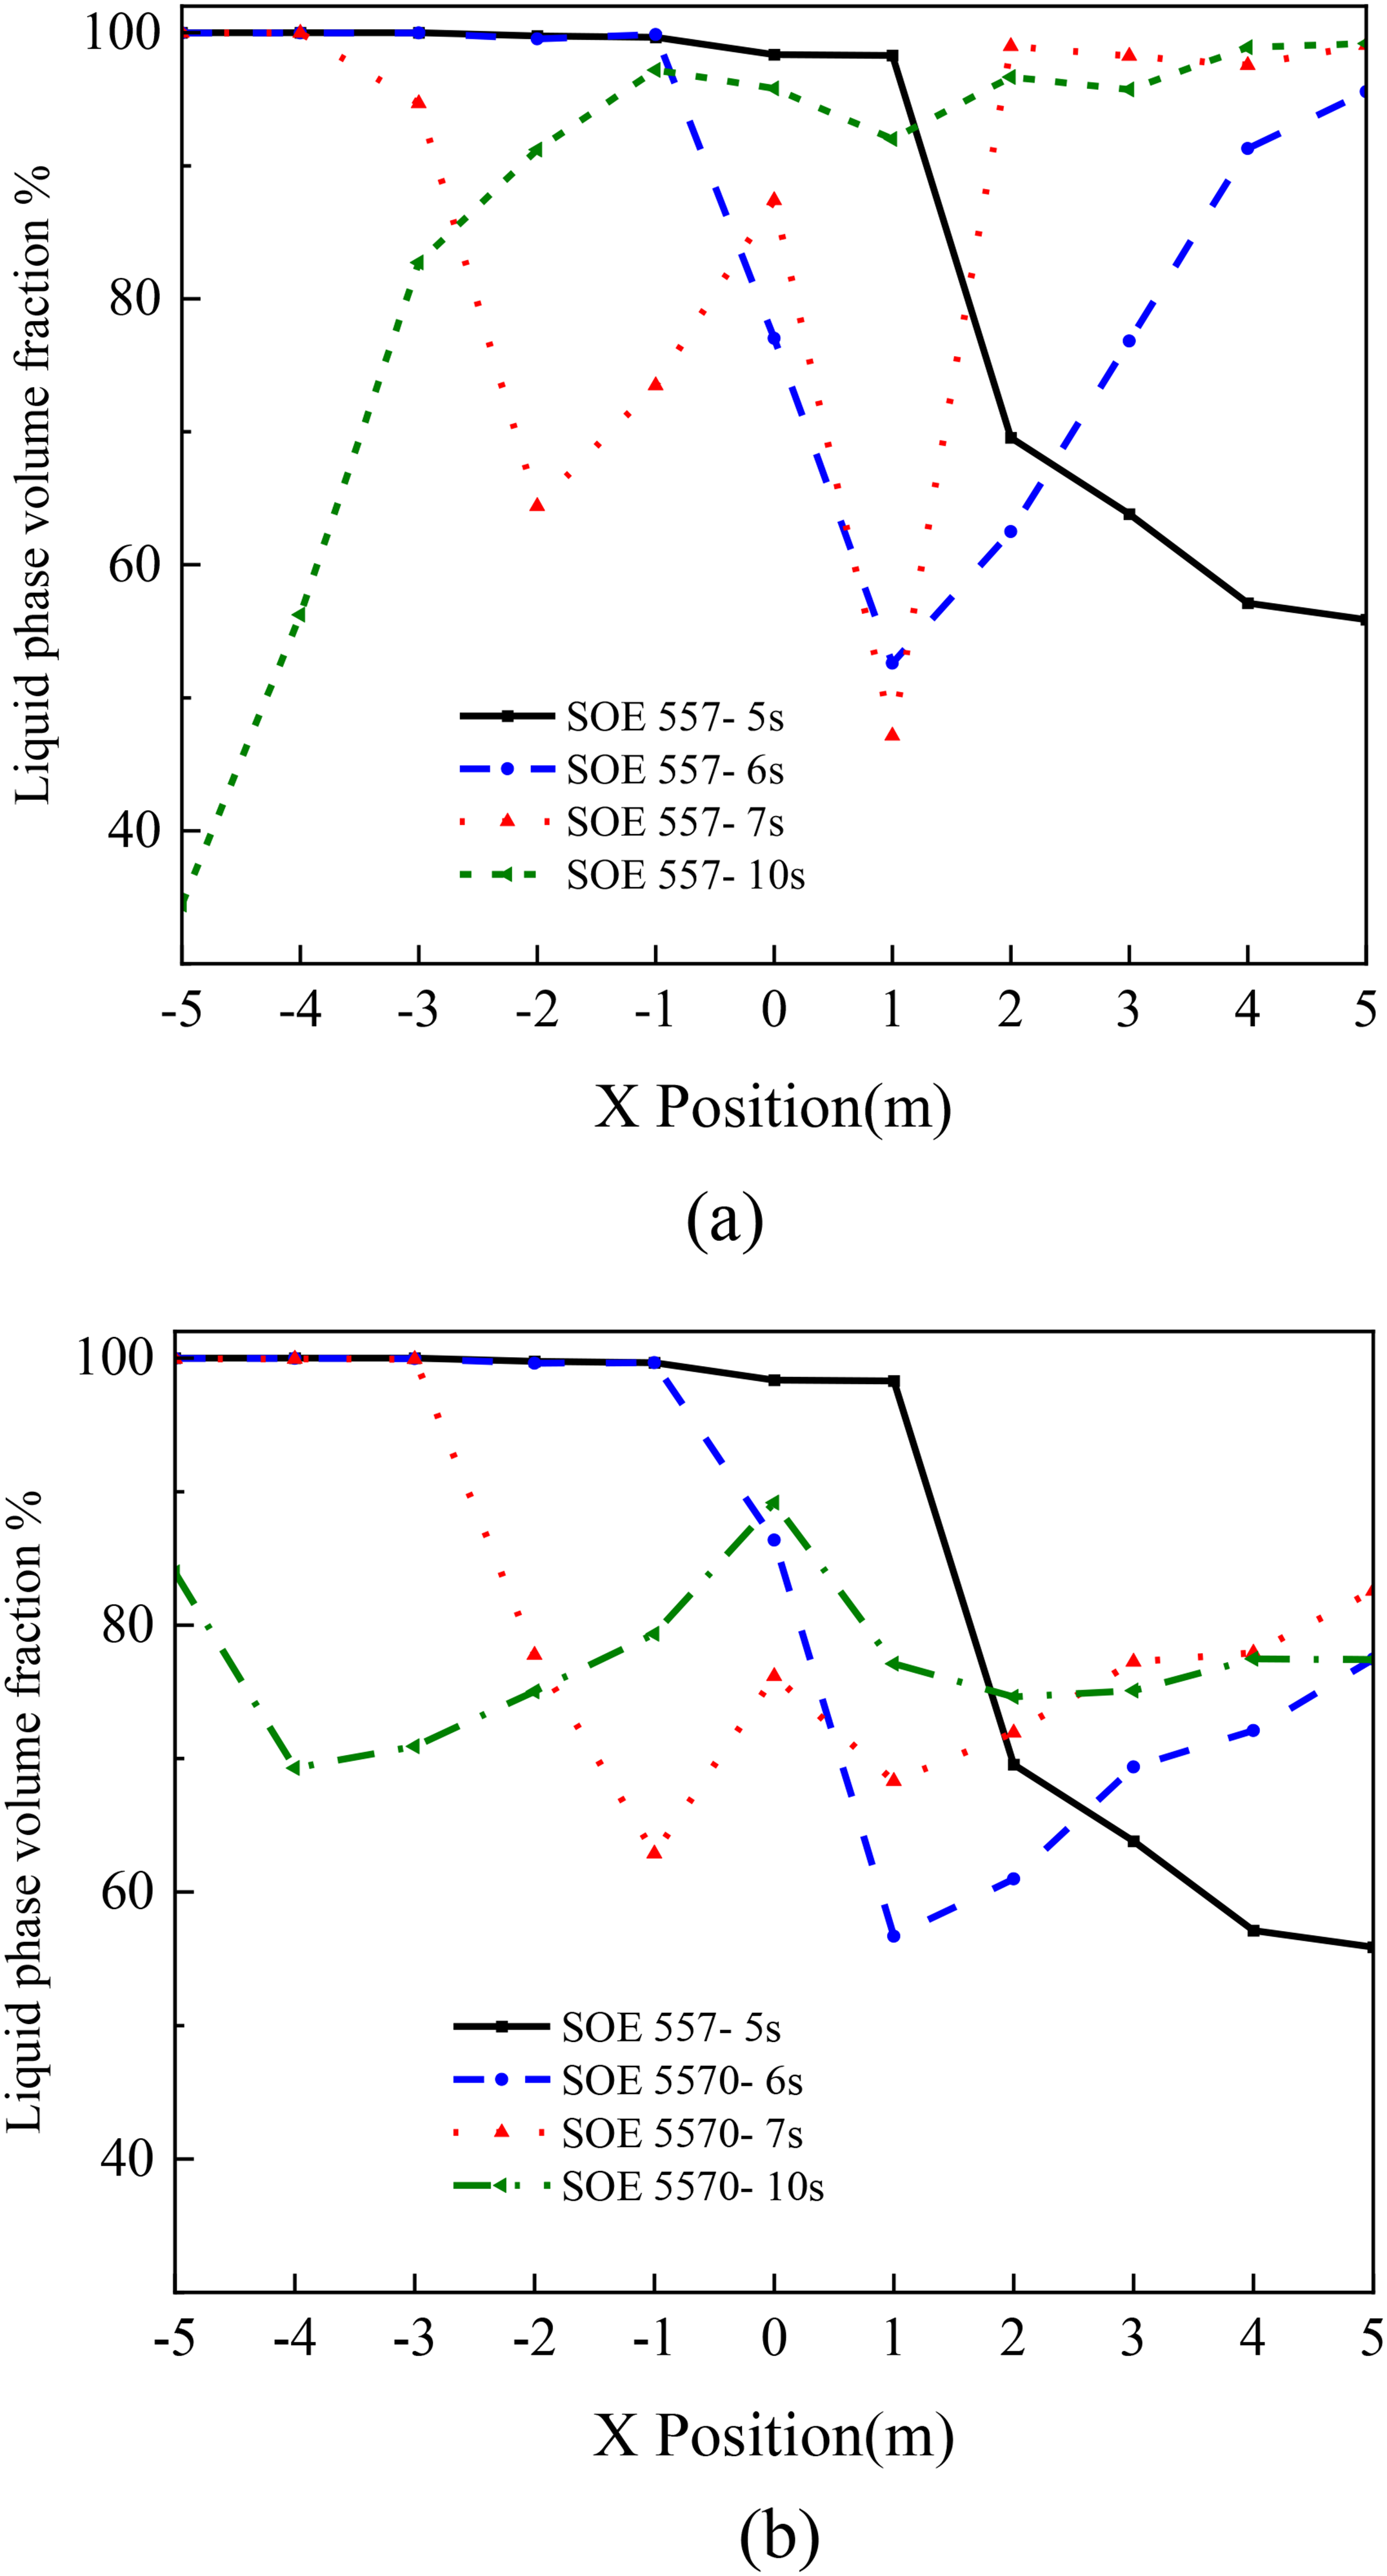
Comparison of liquid phase volume fraction between SOE 557 and SOE 5570. (a) SOE 557 and (b) SOE 5570.
The results indicate that discontinuous shaking leads to a smaller liquid shaking amplitude and a more uniform distribution of the liquid phase. The maximum difference in liquid phase volume fraction between different sections is 37.1% under SOE 5570, whereas it is 52.8% under SOE 557. Thereby liquid stability is enhanced in the tank under SOE 5570. Ultimately, this contributes to improved liquid phase stability and more efficient liquid helium transport.
Upon analyzing the effectiveness of the baffle in both scenarios, it becomes evident that the baffle exhibits superior performance in mitigating the effects of SOE 557. In the SOE 557 scenario, the liquid phase volume at the internal position X = 1 is notably low, reaching only 47.1% at 7 seconds, subsequently experiencing a gradual increase. By 10 seconds, the liquid phase ratio at this position escalates to 92%. Conversely, in the SOE 5570 case, the lowest liquid phase volume at the same position X = 1 is recorded as 56.7% at 6 seconds, followed by a progressive augmentation in the liquid phase. At 10 seconds, the liquid phase ratio at X = 1 is recorded as 77.1%.
These findings indicate that continuous shaking significantly reduces the liquid phase volume in proximity to the baffle. Furthermore, it facilitates an increase in the gas phase volume adjacent to the baffle, promoting efficient mixing of the liquid phase at the baffle region.
The temperature stratification in the Y-direction of the tank section, as illustrated in Figure 16, demonstrates a decrease in the ratio of temperature gradient. However, the impact of reducing temperature stratification within the tank is not apparent for SOE 5570. This indicates that continuous shaking promotes the mixing of liquid phase and gas phase and reduces the internal temperature gradients.

Comparison of temperature gradient between SOE 557 and SOE 5570.
Conclusions
This article employs numerical modeling to analyze and compare acceleration results, revealing the following findings:
The optimal amplitude of sinusoidal oscillation is determined to be 5.57 m/s², and the corresponding maximum speed is 63.8 km/h. It shows that under this amplitude and speed, the shaking characteristics of the liquid helium tank are ideal, which not only ensures the stability of transportation, but also facilitates the uniformity of internal temperature. By comparing the SOE and SOEN, upon shaking, a trough emerges at the baffle, accompanied by a surge like pattern in the central section of the liquid level. The baffle structure effectively reduces the pressure difference between front and rear heads and internal flow velocity in the tank. The internal shaking model for effectively obtaining the liquid level distribution in the tank is adopted to prove the positive significance of liquid helium phase distribution variation prevention by baffle structure. The baffle enhances container stability.
This study contributes significantly to understanding how to appropriately configure internal baffles in shaking scenarios. It is benefit for minimizing the impact of internal temperature stratification during the storage and transportation of liquid helium portable tanks. These insights are crucial for ensuring the safe transportation of liquid helium tanks on roads.
Footnotes
Author contributions
JQ was involved in conceptualization, methodology, formal analysis, writing—original draft, and software; GL in investigation, data curation, and visualization; XX in writing—review & editing, validation, resources, supervision, project and administration and LL in funding acquisition supervision.
Funding
The authors disclosed receipt of the following financial support for the research, authorship, and/or publication of this article: This work was supported by the Chinese Academy of Sciences Strategic Leading Science and Technology Project (grant number XDC10010300).
Declaration of conflicting interests
The authors declared no potential conflicts of interest with respect to the research, authorship, and/or publication of this article.