
Abstract
Objective
The present investigation aims to utilize the extract of vanadium pentoxide from spent vanadium catalyst in a tabletop vanadium redox flow battery (VRFB) and a home-designed cell stack. The most commonly used redox couples in VRFB systems are V2+/V3+ and V4+/V5+ which typically require the use of costly VOSO4 standard solution. In this study we propose an alternatve approch by substituting these expensive solutions with more affordable and environmentally friendly option: a V2O5 solution derived from spent catalyst.
Method
Characterization of the recovered vanadium solutions, incorporation of these solutions were performed in a three electrode cell and in a real bench-top vanadium storage battery model, and the performance of the constructed battery was tested using different electrochemical techniques such as cyclic voltammetry.
Result
The increasing current and potential observed were proportional to the concentration of the recovered solution. Furthermore, an in-house tabletop VRFB utilizing the recovered electrolyte exhibited promising electrochemical properties, achieving a maximum discharge potential of 2.0 V after 180 minutes of electrical charging and a maximum current of 83.5 mA. These results are encouraging for the utilization of recovered vanadium solutions in VRFBs.
Conclusion
This study results are encouraging for the utilization of recovered vanadium solutions in VRFBs. This work suggests a novel technique that utilizes waste vanadium solutions from the sulfuric acid industry for sustainable VRFB applications.
Keywords
Introduction
The greatest challenge in contemporary renewable energy applications resides in storing the produced energy and the environmental impact. The most widely used forms of renewable energy are solar and wind energies. The energy harvesting for these two forms of renewable energy is dependent on the daytime for solar energy and the wind speed and direction which demands efficient energy storage systems.1,2Vanadium redox flow batteries (VRFB) among others are used for the storage of energy produced from wind and solar resources.3–6 These are high-capacity rechargeable batteries based on vanadium ions that avoid cross-contamination. 7 Moreover, VRFBs present a lower fire risk compared to lithium-ion batteries. Additionally, the greater natural abundance of vanadium relative to lithium contributes to the lower cost of VRFBs. 8 VRFB also allows a high charging rate compared to other rechargeable batteries. 9 The VRFB takes advantage of vanadium's capacity to exist in four different oxidation states; the vanadium ions V4+ and V5+ which are vanadium oxide ions (VO2+ and VO+2, respectively). 10
As a result, the VRFB chemical equations are:


Overall reaction E° cell =1.264V vs SHE.
There are four major methods for preparing vanadium electrolytes: chemical reduction, electrolysis, solvent extraction, and ion exchange resin. Chemical reduction is the most popular preparation method because it is simple, highly efficient, fast, and easy to scale, but the production cost is prohibitively expensive due to the high cost of V2O+ and some other metal oxides like ZrO2.11,12 Many studies and reviews provide a brief revision of different electrolyte properties, supporting electrolytes, electrolyte additives, synthesis methods, and their impact on battery performance,13,14 where they listed many commercial sources of vanadium solution but, none of the mentioned research used the recovered vanadium solution from vanadium spent catalyst using oxalic acid as leachant solution in Al Amayreh study the researchers provided a simple and safe remediation with an almost environmentally friendly procedure for the recovery of V2O5 from spent catalysts that were used in Jordanian industry. 15 In that approach, 6% (W/W%) oxalic acid was used and a 300rpm stirring rate, at 50.0 °C for 3.0 hours, with 2525 ppm of V-ion recovered in the solution, and a percent recovery of 80.58 based on the X-ray flourscense results recovered. Several hydro- and pyrometallurgical processes have been proposed for recovering vanadium from secondary raw materials. Typically, vanadium is recovered as part of a mixed-metal solution and separated using conventional techniques such as solvent extraction, selective precipitation, and ion exchange. A novel method has been developed for recovering vanadium from spent vanadium catalysts used in sulfuric acid production at a local plant. This process achieved a 98 wt.% extraction efficiency by oxidizing the leaching solution with 30 wt.% (NH2S2O₈) = 5:1, with a reaction time of 5 min at 80 °C to 90 °C.
This efficient recovery method lays the groundwork for sustainable sourcing of vanadium from industrial waste. The pursuit of new vanadium resources is a growing focus in chemical and environmental research. Among these, the millions of tons of spent vanadium catalysts generated by sulfuric acid production plants represent a promising and underutilized source for VRFB applications. The benefits are twofold: first, the significant cost reduction from substituting pure vanadium compounds with recovered catalysts; and second, the environmental advantage of converting hazardous waste into a valuable, recyclable resource. 15 For these reasons, we undertook the present investigation, which aims to utilize vanadium pentoxide extracted from spent vanadium catalysts in a tabletop VRFB prototype with a custom-designed cell stack. Notably, this project represents the first known use of a vanadium solution recovered from spent catalysts as an electrolyte in a VRFB system. The most used redox couples in a VRFB system are V(II)/V(III) and V(IV)/V(V) [V2+/V3+ & V4+/V5+]. Those redox couples demand the use of expensive VOSO4 standard solution. Now, an inexpensive approach was opened and environmental friendly.5,8
Materials and methods
Chemicals
The following chemicals and materials were used as received from their respective suppliers without further purification:
Oxalic acid (extra pure) was purchased from Scharlau (Barcelona, Spain), and sulfuric acid (H2SO4, 99.9% purity, 98 wt.%) was obtained from a local supplier. Vanadium pentoxide was supplied by BDH Chemical Ltd (Poole, England). Nafion 117 membrane (30 cm × 30 cm), bipolar plates (10 cm²), graphite plates (10 cm × 10 cm), flow-field graphite plates, rubber gaskets, and graphite rod electrodes were all sourced from the Fuel Cell Store (Texas, USA).
A prototype tabletop vanadium storage cell was designed and constructed to mimic the high-capacity, high-tech VRFB. The basic parts of VRFB were maintained in our prototype home-made cell. The circulation of the anolyte and catholyte solutions to external tanks was ignored because it is only needed for huge megawatt cells and is unnecessary for bench-top small sizes.
Our experiments focused on the vanadium storage battery powered by recovered vanadium from spent vanadium catalyst aimed at pursuing three tasks. These tasks are the characterization of the recovered vanadium solutions, incorporation of these solutions in a real bench-top vanadium storage battery model, and testing the performance of the constructed battery.
UV-Vis spectroscopy and cyclic voltammetry characterization
The solutions extracted from the spent vanadium catalyst were characterized using cyclic voltammetry (CV) and UV-Vis (ultraviolet-visible) spectroscopy. Cyclic voltammograms were recorded with a PARC (Princeton applied research corporation) potentiostat/galvanostat (EG&G, Model 273A, USA), interfaced with a computer via a GPIB interface (general purpose interface bus) (IEEE, USA), and controlled using 270 M Echem® software (PARC, USA). A conventional two-compartment, three-electrode electrochemical cell with multiple inlet/outlet ports was used to introduce either the unaltered spent catalyst extract (conductivity: 3.65 mS/m) or a saturated V2O5 solution (conductivity: 3.21 mS/mL). Both solutions were deaerated and maintained under a blanket of high-purity oxygen-free nitrogen gas (99.999%, G5 grade), supplied by the International Company for Medical and Industrial Gases (Sahab, Jordan).
The reference electrode was an in-house fabricated Ag/AgCl electrode with a 1.0 M Cl+ concentration. The auxiliary electrode consisted of a spiral-shaped platinum wire, while the working electrode was a 1.5 mm diameter gold disk (99.99%, Johnson Matthey, USA). The reference and auxiliary electrodes were placed in one compartment of the cell, and the working electrode was inserted into the opposite compartment. All potentials were reported relative to the Ag/AgCl (1.0 M Cl+) reference electrode. Each measurement was performed three times under ambient conditions, with the potential scanned from −0.2 to +1.2 V at a scan rate of 50 mV/s, and all the R2 value were 0.99 to 1.00.
UV-Vis spectrophotometric measurements were performed on different ratios of diluted spent catalyst extracts where the wavelength was scanned between 350 and 900 nm using Cary 100 version 8.01 spectrophotometer (Varian, USA).
Vanadium storage battery cell
Two designs for a miniaturized vanadium storage battery were adopted in this work, the first was made of two pearl-shaped compartments with glass side arms that can be joined together by a polytetrafluroethylene sleeve. The middle of the sleeve contains a Nafion 17 membrane separating the anolyte and the catholyte compartments (Figure 1). Both electrodes were made of graphite rods while the anolyte or the catholyte was made of the extracted V2O5 from the spent vanadium catalyst. The second design involved a bigger cell made of two rectangular parallelepiped Plexiglas compartments connected through a cylindrical junction supplied with a Nafion 117 membrane separator (Figure 1). The electrodes were made of a 5.00 ×10.00 cm graphite plate. The catholyte and anolyte solutions were made of V2O5 extracted from the spent vanadium catalyst and other solutions. The anolytes and catholytes attempted are given in Table 1.
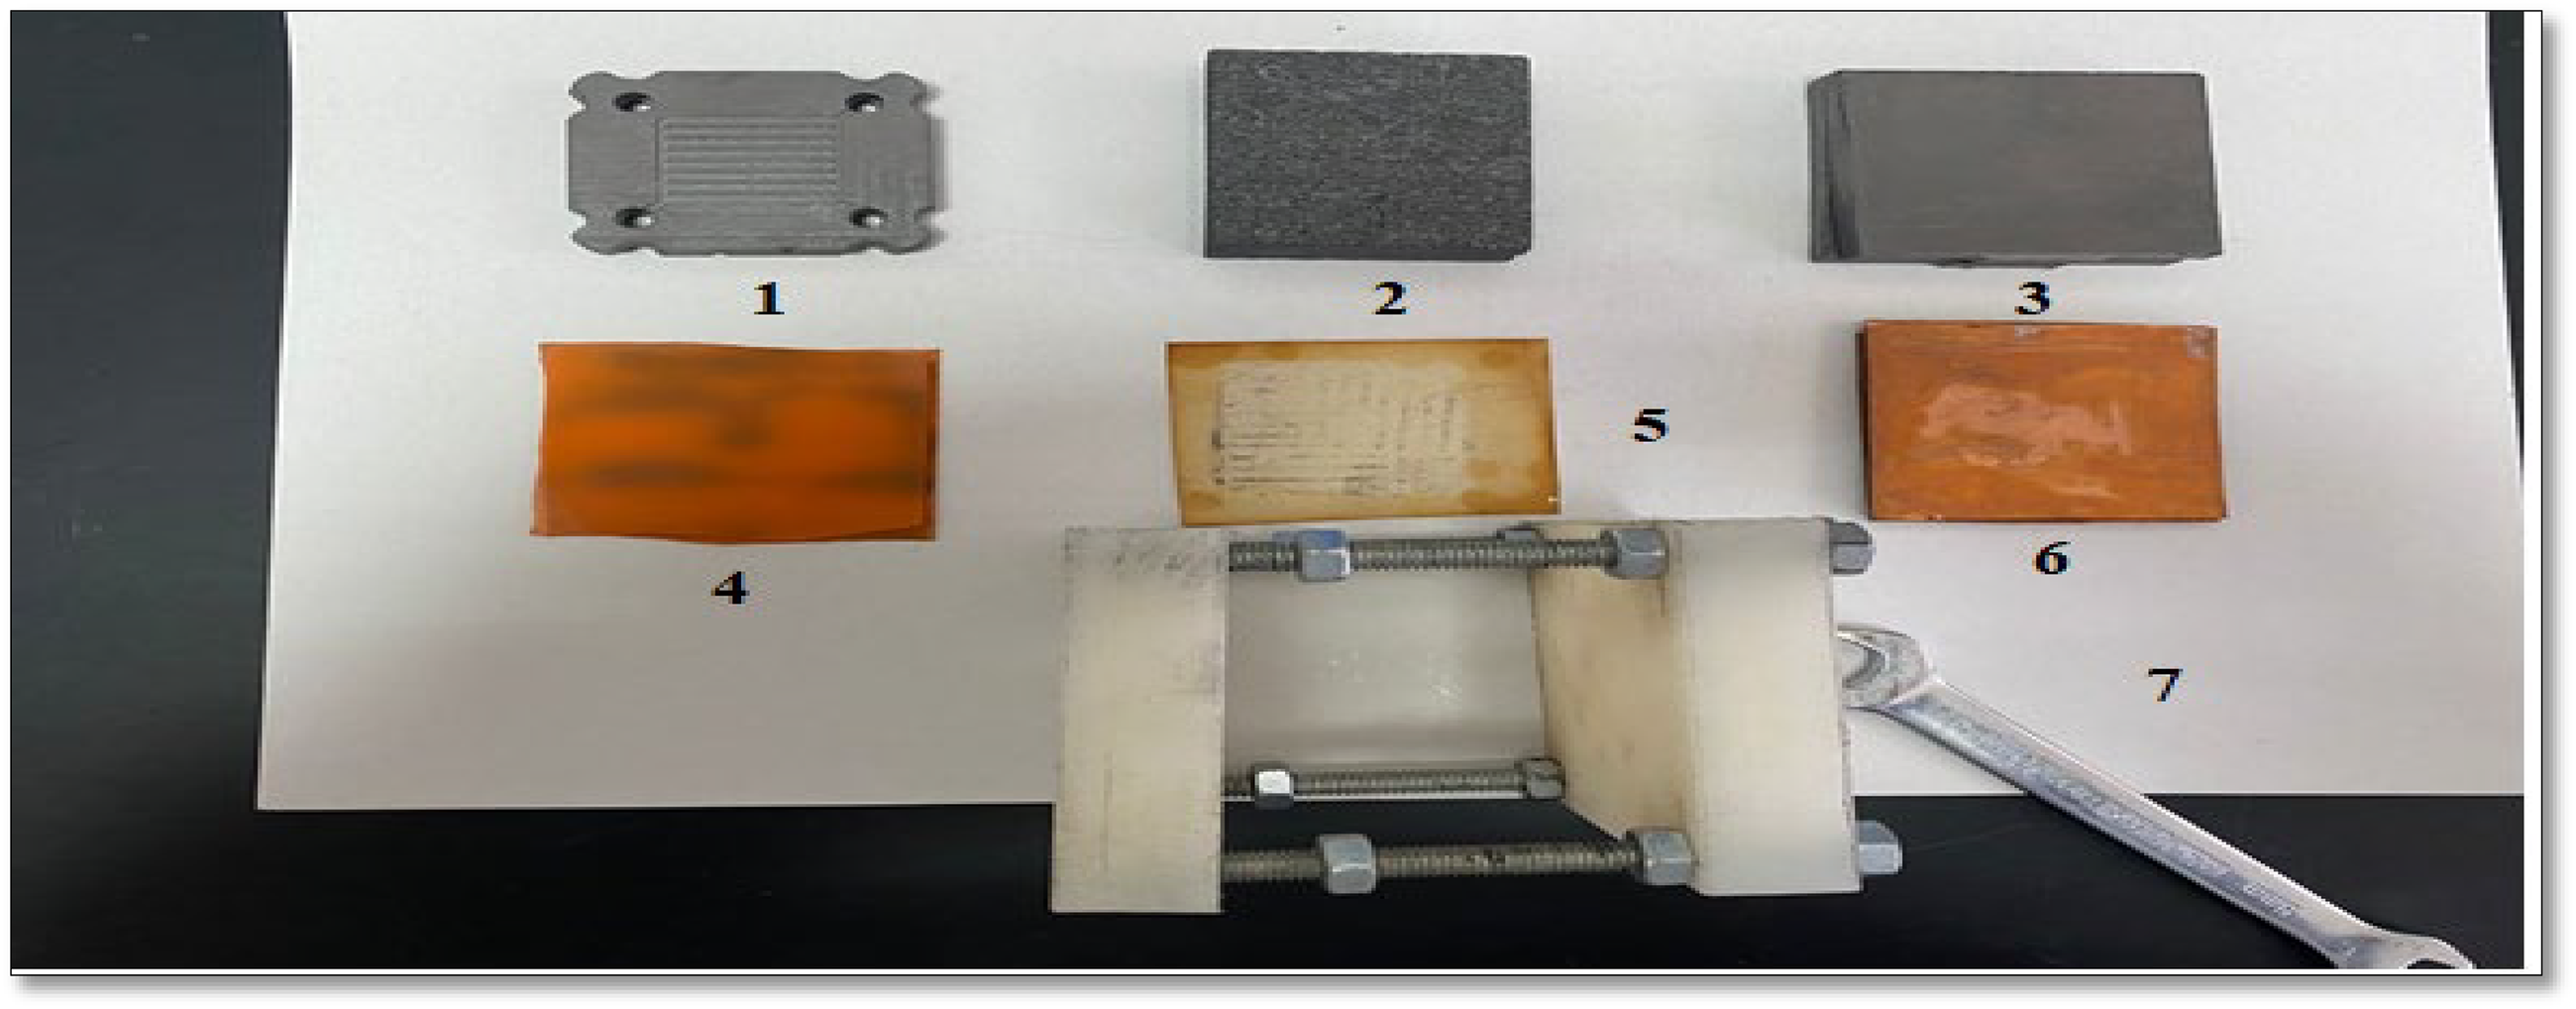
The VRFB cell stack used parts. 1: graphite plate with flow field, 2: porous graphite plate, 3: graphite plate, 4: Rubber gasket, 5: Nafion 117 membrane, 6: copper plate, and 7: Teflon frame. VRFB: vanadium redox flow battery.
The anolyte/catholyte solutions used in the vanadium storage cells along with charge/discharge time.

Charging and discharging the Vanadium redox flow battery
The cell was charged using a regulated power supply (uni T; China). The time of charging varied from 10 to 500 minutes. The contents of the two compartments of the cell were analyzed for their vanadium species spectrophotometrically and using cyclic voltammetry. Solutions conductivity was measured by WTW 3310 Conductivity Meter, Germany) and a digital multimeter (Dt-830 L, China) for current and potential measurement.
In-house fabricated cell stack for vanadium redox flow battery
A vanadium storage Membrane design, electrolyte stability and concentration, and electrode material and design are the major concerns in cell performance.6,16,17 A cell stack of VRFB was designed in our laboratory. The design was aimed to stimulate the commercial known design which is a protected patent.
All the shown parts in Figure 1 were designed and fabricated in-house as following:
5cm*5 cm graphite plate with flow field, 5 cm*5 cm porous graphite plate, 5cm*5 cm graphite plate, 5cm*5 cm Rubber gasket, 5cm*5 cm Nafion 117 membrane, 5cm*5 cm copper plate, and Teflon frame.
The finished diagram of the cell stack parts is shown in Figure 1.
Result and discussion
Characterization of the vanadium species recovered from the spent vanadium catalyst
The electrical conductivity of the solution containing vanadium species recovered from the spent vanadium catalyst was measured to assess its composition. The recovered solution exhibited a conductivity of 3.560 mS·cm+¹, compared to 3.215 mS·cm+¹ for a standard V2O5 solution, providing empirical support for the presence of similar ionic species. Additional evidence regarding the composition of the recovered solution was obtained through cyclic voltammetry. Figure 2 presents the cyclic voltammogram recorded using a gold electrode in a saturated V2O5 solution with 1.00 M H2SO4 as the supporting electrolyte. The voltammogram displays distinct anodic peaks at approximately 0.4, 0.7, and 0.85, along with corresponding cathodic peaks at 0.1 and 0.38 V.

Cyclic voltammogram of a gold electrode in spent vanadium catalyst (SC) recovered solution in 0.1 M H2SO4 (conductivity =3.650mS/ml) or/and saturated V2O5 solution (conductivity =3.210mS/ml). SC: spent catalysts.
Upon the addition of a measured amount of the recovered catalyst solution, no significant shifts in peak potentials were observed. However, the current peaks became more pronounced, with higher intensities and broader peak areas—indicating a greater concentration of vanadium species. This suggests that the added solution contains the same electroactive species found in the V2O5 standard solution. These findings provide strong preliminary evidence that the chemical species present in the recovered solution are consistent with those formed by the dissociation of V2O5 in 0.1 M H2SO4.
The peaks observed during the positive-going scan are larger and more prominent than those seen in the reverse scan at a switching potential of 1.2 V. This behavior can be attributed to the oxidation of vanadium species in the solution, whose signals are superimposed on the surface oxidation peaks of the electrode. Additionally, the oxidation products may be unstable or undergo subsequent chemical reactions in solution. These follow-up reactions introduce a competition between electrochemical reversibility and chemical transformation, reducing the intensity of the reverse peaks. This suggests sequential redox transitions among four oxidation states of vanadium: V⁵+, V⁴+, V³+ and V²+.
As more of the spent catalyst solution is added, the concentration of vanadium ions—particularly in the V³+ state—increases, leading to higher observed currents and potentials during the scan. This further supports the presence of electroactive vanadium species in the recovered solution. The redox conversion between V³+ and V⁵+ can be represented by the following reaction:


Also, on the anodic side, all the above reactions are reversed.
In other words, the redox peaks observed in the CV curve correspond to the reversible redox reaction of V3+/V5+.The anodic peak (around 0.4, 0.7, and 0.85 V) is attributed to the oxidation of V + 3 to V + 4, while the cathodic peak (at 0.1 and 0.38 V) corresponds to the reduction of V + 4 to V3 + during the reverse scan.
Oxalic acid here is expected to oxidize to CO2 or to follow other reactions:


Current peaks were obtained from the voltammogram shown in Figure 2. The curve shows the relationship between the added concentration and the current peak. The calibration curve equation is Ip = 0.9916 VSc + 2.7638. For more characterization of the solution, the saturated vanadium solution solution and two dilutions solutions of the spent catalysts (SC and SC1) were identified using UV-Vis spectroscopy as shown in Figure 3.

Absorption spectrum of spent catalyst SC, saturated V2O5 solution VS, and standard VOSO4/UV-Vis molecular absorption curve between 350 and 900 nm. (SC spent catalyst recovered solution, SC1 = 1/10SC diluted solution). SC: spent catalysts; VS: vanadium solution.
Figure 3 shows the four different peaks appearing in the spectrum between 300 and 400 nm. One is present between 520 and 650 nm, and the last one is between 700 and 900 nm. The peak that appears between 350 and 370 nm indicates the presence of V + 5 ion in the solution, while the peaks between 370 and 410 nm, 510 and 630 nm, and 700 and 900 nm indicate the presence of V3+ and V2+. In the V2O5 saturated solution, only the V5+ peak appears so that there are no ions other than the +5-charge ion. On the other hand, the peak of V+5 and those of V+3 and V+2 ions are noticed in the spent catalysts’ spectra. These results coincide with the reported data in the literature. 18 So, we can conclude that the spent catalyst solution contains the three vanadium ions: V+5, V+3, and V+2 which can be used as electrolyte couple for VRFB. 13 To check the electrochemical behavior of oxalic acid in the solution, a series of oxalic acid volumes were added to the V2O5 saturated solution, since the V-ions are recovered from spent catalysts from this solution. The voltammogram is shown in Figure 4.

Cyclic voltammogram of a gold electrode with saturated V2O5 solution (VS) alone and different 6% oxalic acid (OXA) volumes with V2O5 solution light blue color: the saturated V2O5 solution alone. Other colors: different OXA concentrations mixed with the V2O5 solution. Scan rate = 50 mV/s. VS: vanadium solution.
Figure 4 illustrates the increase in the anodic peak current Ipa, in the presence of 6% oxalic acid, and it is noticed that as the volume of 6% oxalic acid
15
increases, the anodic peak current increases as a result of increasing vanadium concentration in the solution. In the oxidation region there is more than one peak indicating the existence of multiple oxidation states of vanadium in the solution. This implies that there are more oxidized species than the reduced species in the quasi-reversible reaction so that the anodic peak (0.6–0.9 V) appeared like this:

On the cathodic side, all the above reactions are reversed. Current peaks were retrieved from the voltammogram shown in Figure 4. The calibration curve equation is as follows:
IP = 2.102 VOXA + 1.93
These results can be explained mechanistically: at low current densities, vanadium ion crossover increases due to longer diffusion times across the membrane, which lowers coulombic efficiency. In contrast, higher charging currents reduce ion crossover by limiting the time available for vanadium ions to diffuse. However, at high currents, electron transfer occurs rapidly, and there may be insufficient vanadium species to fully react with all electrons. This leads to increased ohmic polarization, which in turn reduces both the battery's capacity and voltage efficiency. 19
Design and characterization of a bench-top vanadium storage cell
Bench-top vanadium storage cell was designed and tested through the charging and discharging of vanadium redox flow battery. Twelve experiments were constructed to improve the concept of charging and discharging of the bench-top vanadium storage cell and the monitor potential change during charging was recorded. The aim was to reach 2 V during the discharge of the cell. It was fulfilled when spent catalyst leached a solution of around 2550 ppm/saturated V2O5 solution in 1.00 M H2SO4 as shown in Figure 5.

Maximum discharging potential versus experiment number during charging–discharging of bench-top vanadium cell.
Regarding the measured current, it was measured across a resistance of 10Ω, at room temperature, and different maximum current values were achieved for the various electrolyte compartments, as shown in Figure 6.

Maximum discharging current (I) versus experiment # (for charging–discharging of bench-top vanadium cell).
The maximum current was achieved for experiment #1, which was the same experiment that gave the highest potential 2 V (I = 83.5 mA) in Figure 5. This current cannot be considered as high, but it may be a promising startup for scaling up the electrolyte compartment and increasing the electrode size so more current and potential can be achieved. As for the changes in current and potential for the optimum experiment, potential and current profile variation along the charging–discharging time is shown in Figure 7.
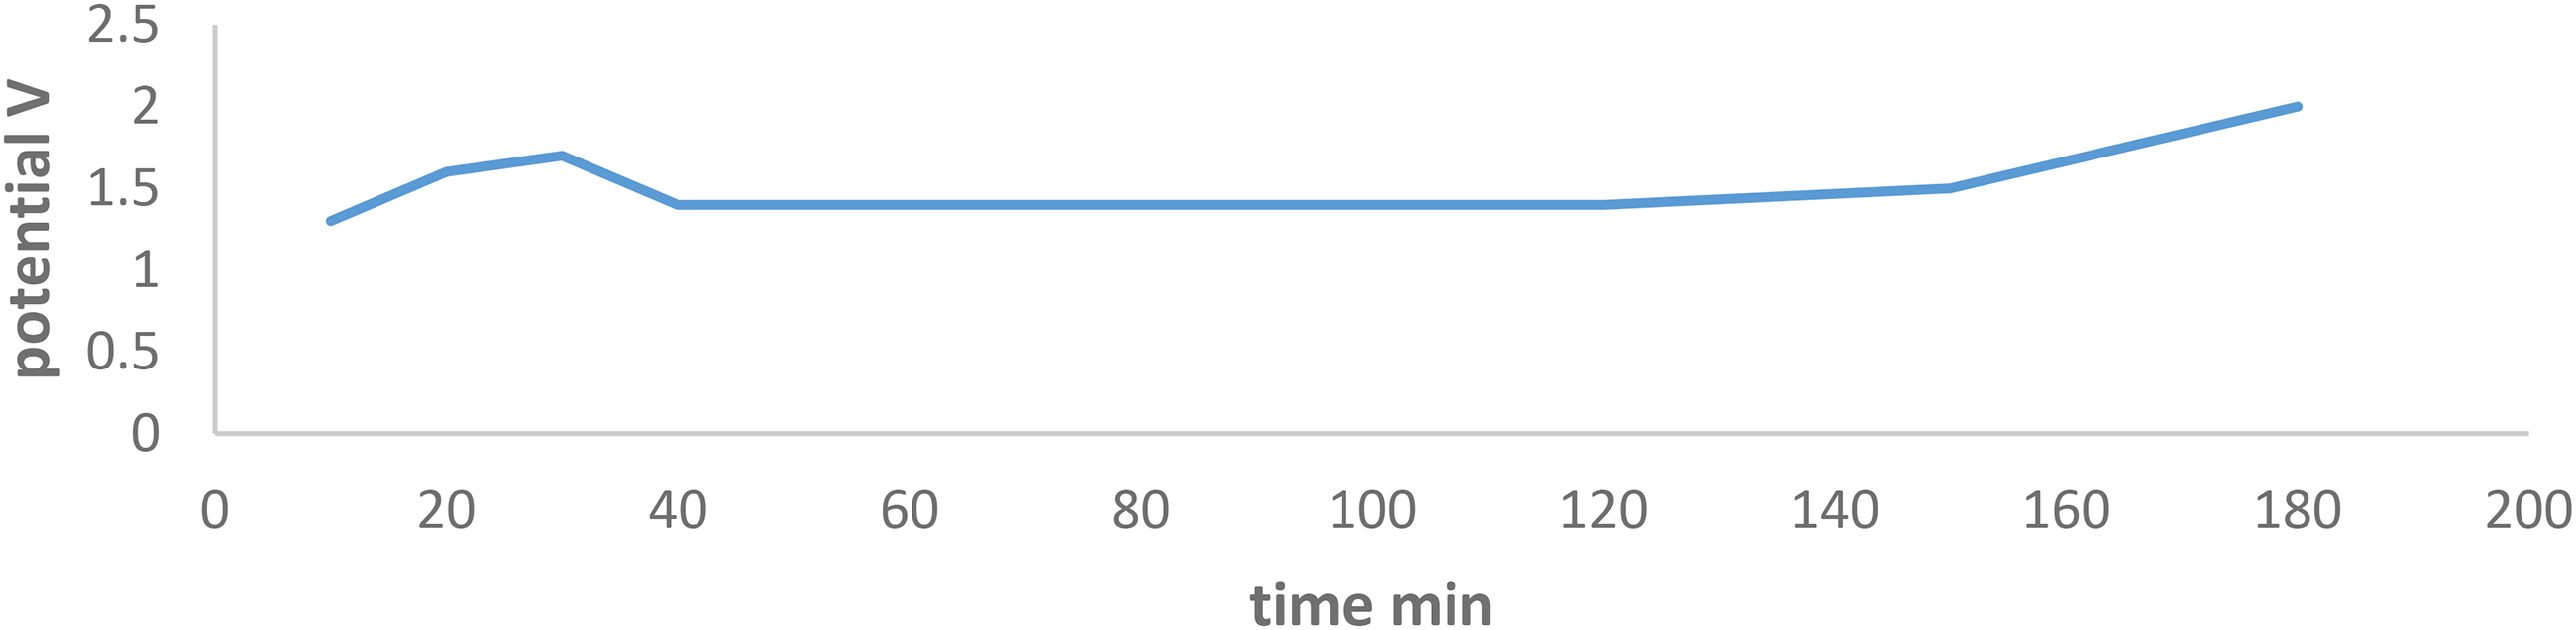
Potential variation with respect to time for charging discharging the bench-top vanadium cell for 180 minutes with a charging potential of 31.0 V.
In Figure 7, during the charging–discharging process, the discharged potential started from 1.3 V and reached its maximum of 2 V after 180 minutes. Between 40 and 120 minutes, the discharge potential maintained a constant value of 1.4 V. This can be explained by the presence of some equilibrium reactions in the catholyte and anolyte solution. 17 Looking at the current variation with time, it can be noticed that the maximum reached current was 83.5 mA after 30 minutes of the charging–discharging process, then the current falls to 72 mA and maintaining a constant value around 80minutes followed by a fall to its minimum of 16mA as shown in Figure 8.
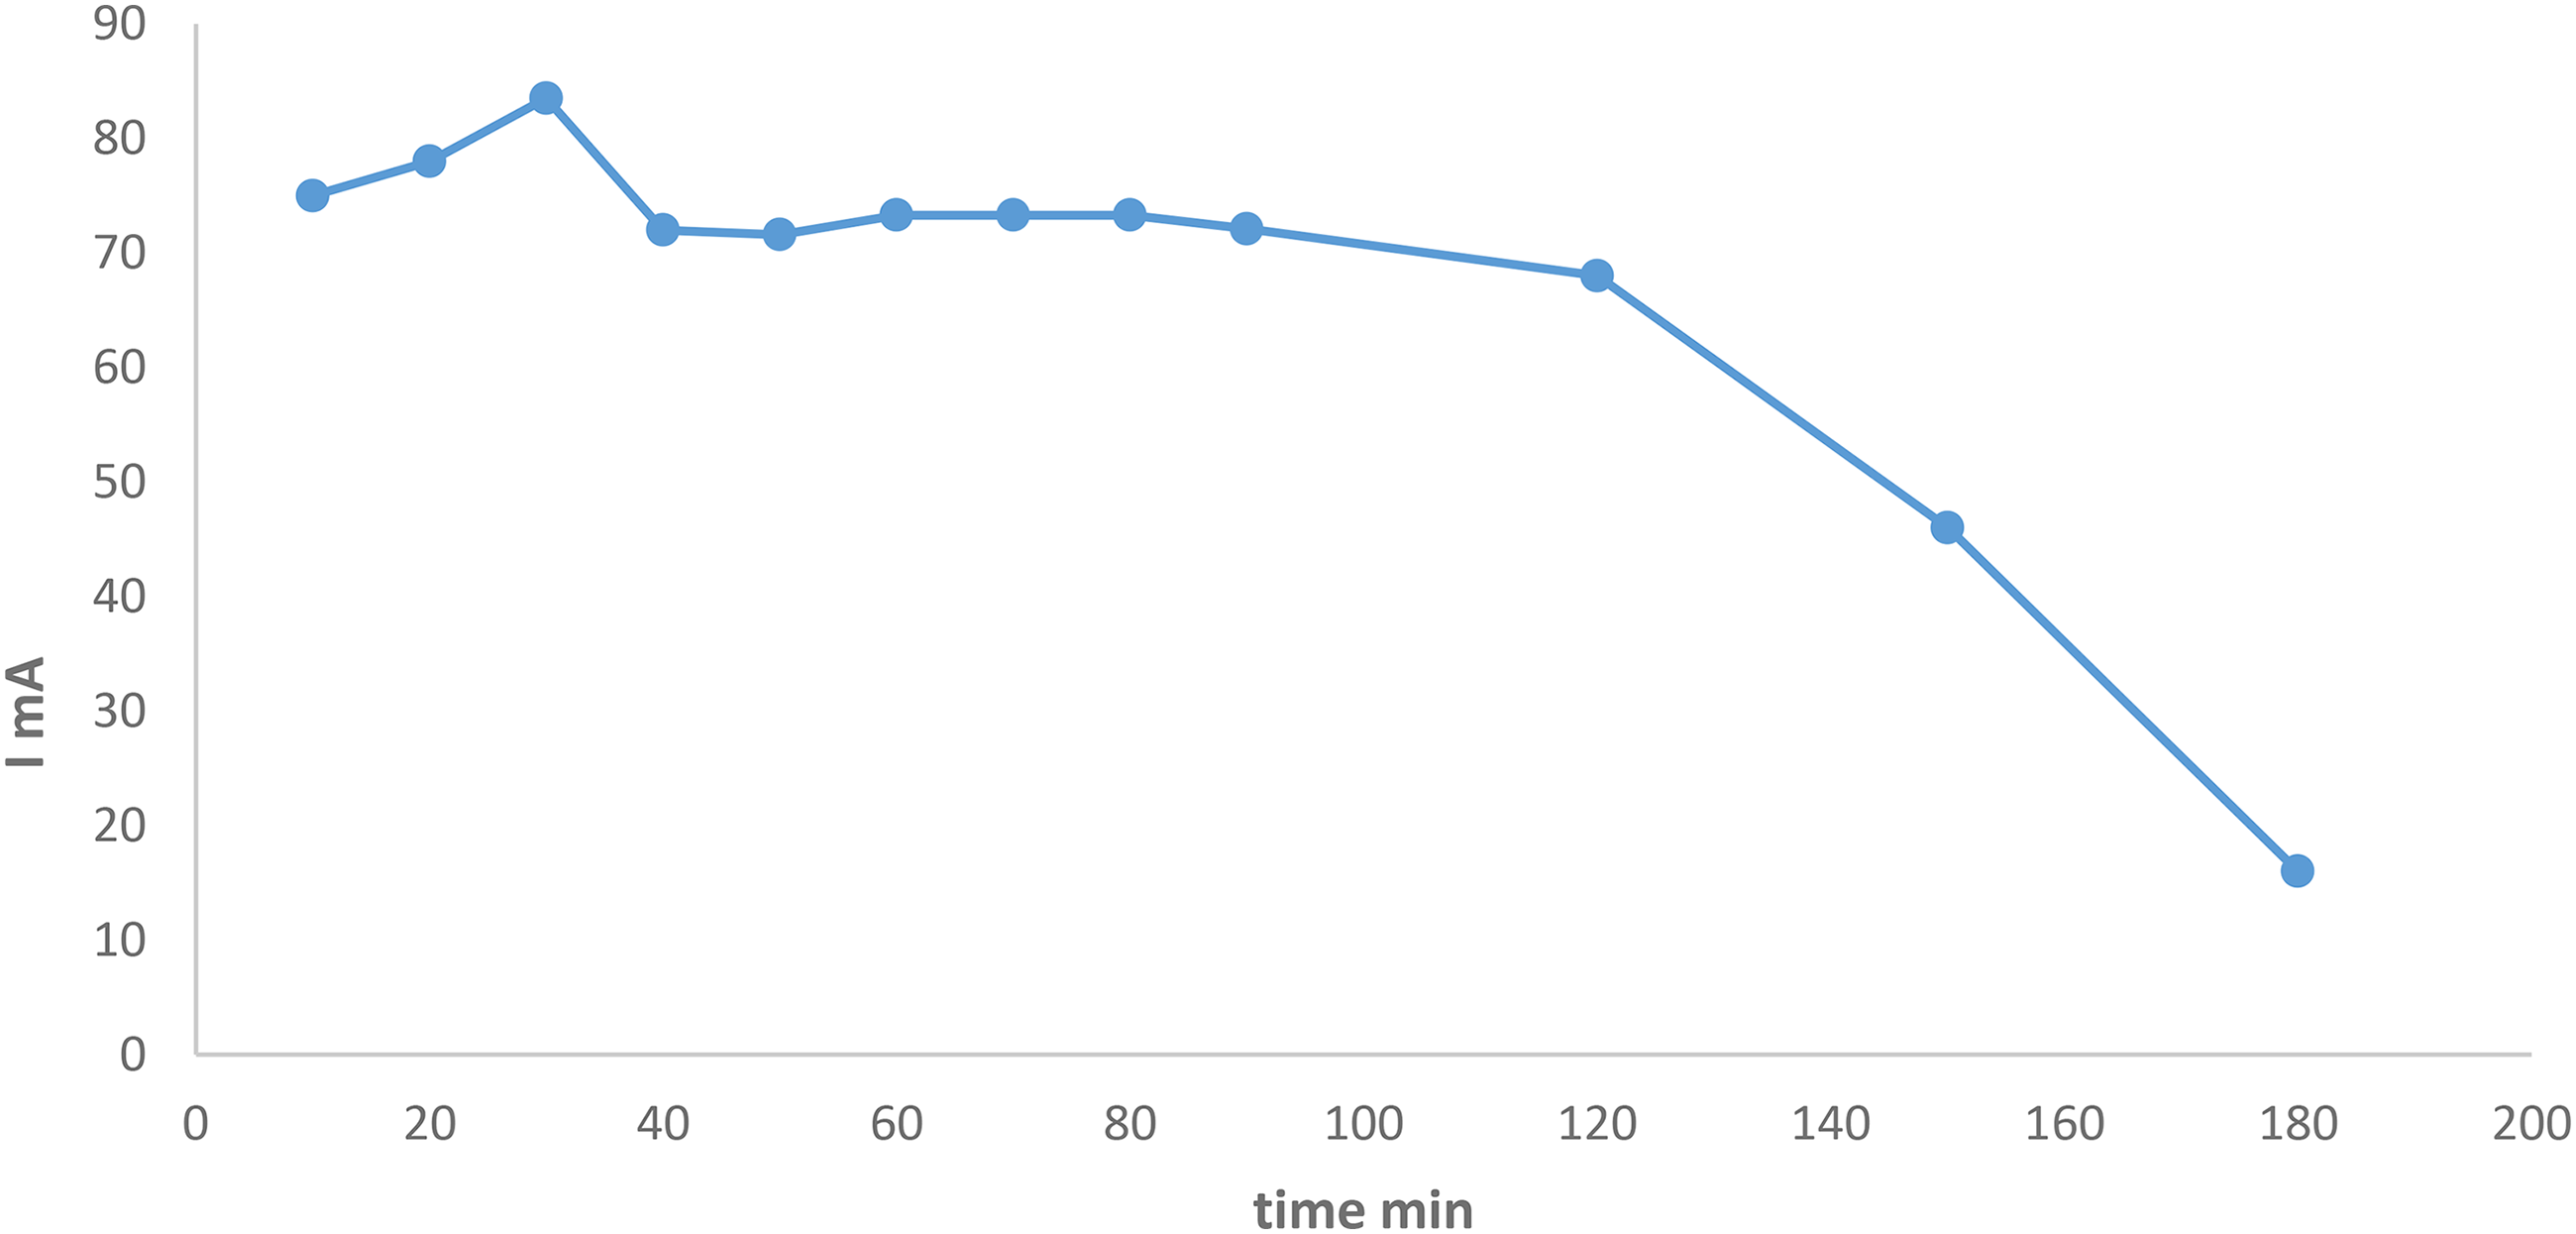
Current variation with respect to time for charging discharging the bench-top vanadium cell for 180 minutes with charging potential of 31.0 V.
To study the response of the reaction in both anolyte and catholyte compartments, cyclic voltammogram were also used to characterize the catholyte/anolyte solutions after the charge–discharge process was investigated as shown in Figure 9.

Cyclic voltammogram of a gold electrode for the catholyte solution used in testing bench-top vanadium cell before and after charging (scan rate = 50 mV/s).
As shown in Figure 9, the voltammogram of the catholyte from the spent catalyst solution was recorded before charging. A small cathodic peak at −1.201 mA and 346 mV suggests a minor reduction reaction of V⁵+ ions in the catholyte. After 180 minutes of charging, this peak shifts significantly to the left with a larger maximum current of −5.03 mA at 158 mV, indicating enhanced reduction reactions occurring in the catholyte due to the charging process and changes in its electrochemical state.
In the anodic region, a peak with a maximum current of 19.3 mA at 994 mV is observed before charging, which increases to 25.5 mA at 812 mV after charging is complete. This increase and shift can be attributed to the negative potential scan following extended charging time, during which more oxidation reactions occur, increasing the concentration of V⁵+ and V⁴+ ions in the catholyte. Consequently, the cathodic peak current (I_pc) increases, as clearly seen in the voltammogram at the end of the charging process.
The presence of a small cathodic peak current at −8.46 mA/98.10 mV is shown in Figure 10. It might be because of a small reduction reaction for V2+ in the anolyte solution, while after 180 minutes of charging, this peak is shifted dramatically to the right with higher maxima at −30.30 mA/218.00 mV. The latter suggests an additional reduction reaction that might proceed inside the anolyte because of charging and therefore the change in the electrochemistry of the anolyte. On the contrary, in the cathodic peak region, a maximum peak of 2.56 mA at 720.00 mV appears before charging, and then the values change to 22.0 mA at 708.00 mV after charging is completed. This increase and shift mean that the potential is scanned negatively after more time of charging. More oxidation reactions proceed in the catholyte solution increasing the concentration of V5+, V4+, V3+, and V2+. At the end of the charging process the cathodic peak current increases (Ipc) as presented in the voltammogram.20–24

Cyclic voltammogram of a gold electrode for the anolyte solution (saturated V2O5 solution in 1.00 M H2SO4) for testing bench-top vanadium cell before and after charging, scan rate = 50 mV/s.
Testing and characterization of the tabletop cell stack for VRFB
The fabricated cell stack was designed in our labs. It was further tested with an analyte solution mixture of spent catalyst leached solution/saturated V2O5 solution in 1.0 M H2SO4.25–29 Constructing the cell was a challenging task. The constructed setup is shown in Figure 11.
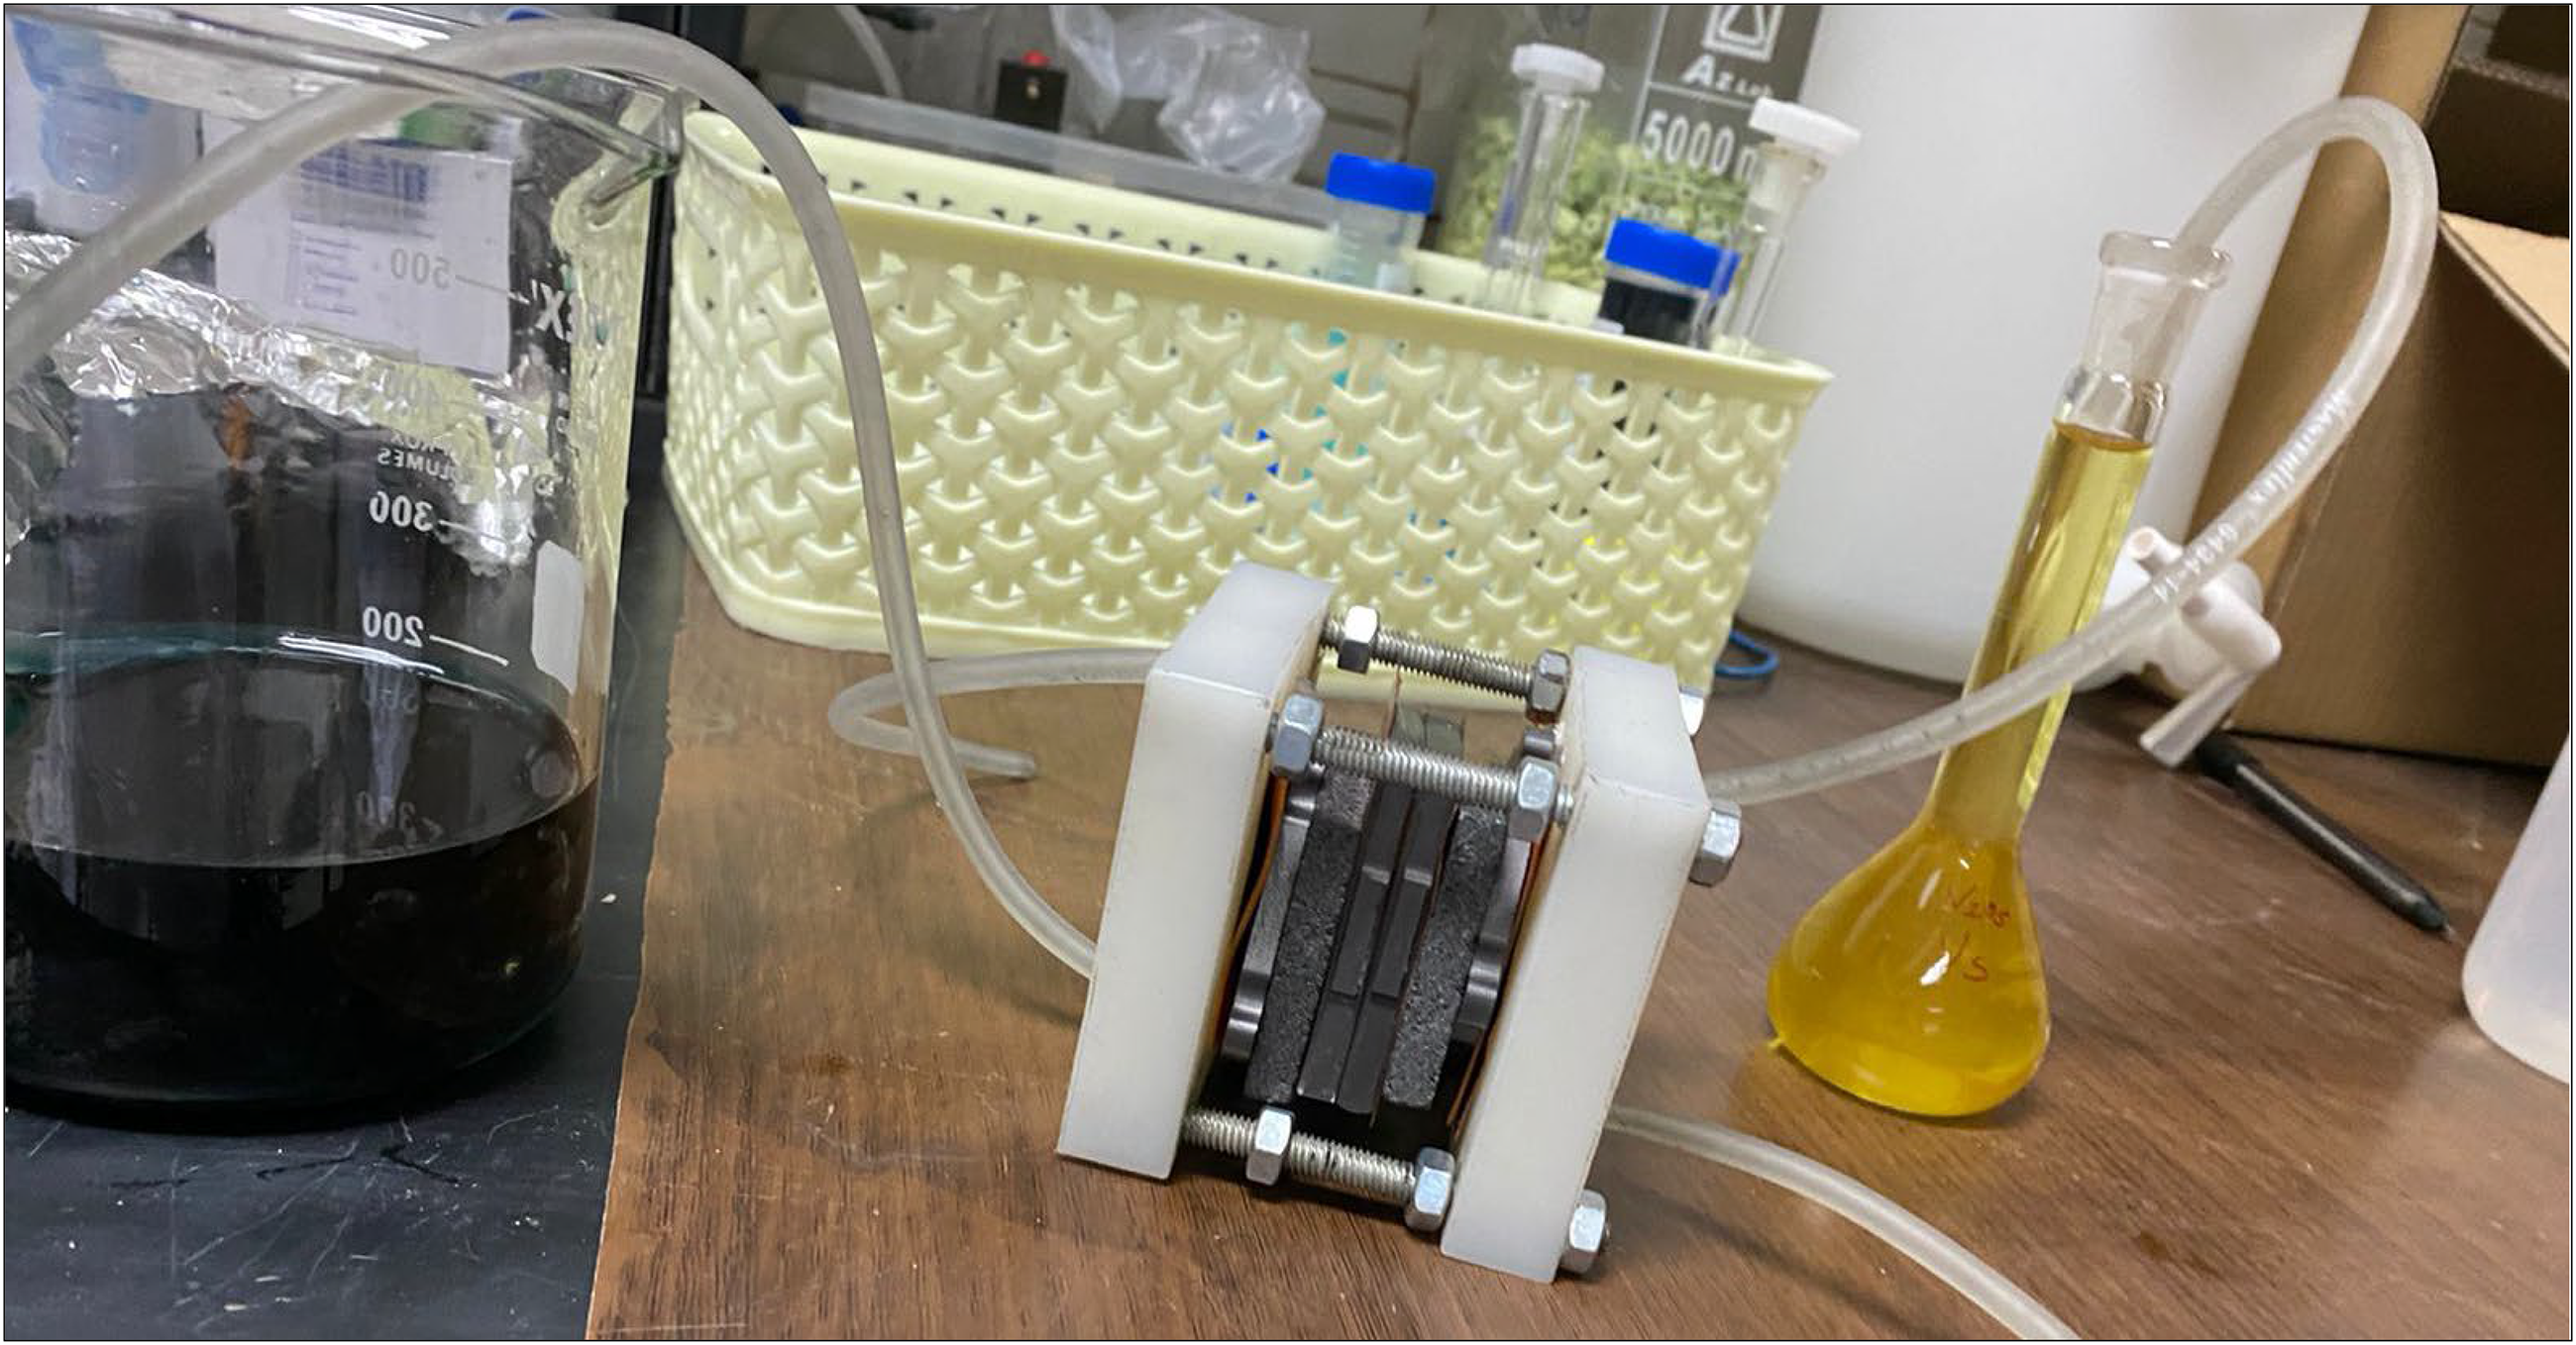
Tabletop cell stack constructed in the lab.
As displayed in Figure 11, the cell stack is composed of 13 layers rather than the Teflon frame. The third layer on each side is a flow field graphite plate, as in Figure 12. This graphite plate must be connected to in/out pipes to take the electrolyte through, and the charging process can start. One of the problems is the need to pump the solution through this flow field and optimize the best condition. This cell stack is now under more study and research by our team.

Flow field graphite plate.
Conclusion
This study demonstrated the potential of using recovered V2O5 spent catalyst solutions as electrolytes for VRFBs. The electrochemistry of the recovered catalyst solution was characterized using cyclic voltammetry in a three-electrode cell. The results indicated electrochemical behavior comparable to V2O5 saturated with VOSO4 solutions. The increasing current and potential observed were proportional to the concentration of the recovered solution. Furthermore, an in-house tabletop VRFB utilizing the recovered electrolyte achieved a maximum discharge potential of 2.0 V after 180 minutes of electrical charging.
The findings demonstrate that this method offers a novel and sustainable approach for producing VRFB electrolytes. The recovered vanadium solution exhibited promising electrochemical performance, achieving a discharge potential of 2.0 V after 180 minutes of charging and reaching a maximum current of 83.5 mA. These encouraging results highlight the potential of using recovered vanadium solutions in VRFB systems. Additionally, a tabletop VRFB cell stack was designed and thoroughly investigated, paving the way for sustainable VRFB applications utilizing waste vanadium from the sulfuric acid industry. This work opens the door to alternative electrolyte sources for VRFBs. We recommend further advanced research to optimize and evaluate the recovered solution in commercial VRFB prototypes. The primary recommendation of this study is to focus on the application of recovered vanadium electrolyte in VRFB prototypes, which will enable future system optimization and broader utilization.
Footnotes
Acknowledgements
The authors gratefully acknowledge the Jordan Atomic Energy Commission (JAC), represented by H.E. Khaled Toukan and Ahmad Al Sabbagh, for their valuable scientific and technical assistance throughout this project. Additionally, they thank the Jordan Phosphate Mines Company (JPMC) for supplying the raw materials (spent catalysts), represented by H.E. Mohammed Thneibat, Abdel Wahab Alrowwad, and Mohammed Migdadi.
Authors’ contributions
AAB, MKH, MIH and HHAA were involved in conceptualization; HHAA, AAB, and MIH in methodology; AAB in validation; AAB, HHAA, and MKH in formal analysis; HHAA in investigation and writing—original draft preparation; AAB and MIH in resources, project administration and funding acquisition; HHAA and AAB in data curation; AAB, MIH, MKH, and HHAA in writing—review and editing; and AAB, MIH, and MKH in visualization and supervision. All authors have read and agreed to the published version of the manuscript.
Funding
The authors disclosed receipt of the following financial support for the research, authorship, and/or publication of this article: This work was supported by the Deanship of Academic Research (DAR) at The University of Jordan (UJ) (grant number (Grant No. 1679/2019)).
Declaration of conflicting interests
The authors declared no potential conflicts of interest with respect to the research, authorship, and/or publication of this article.
Data availability
All data analyzed during this study are included in this published article.