
Abstract
Objective
We hypothesize that combining point shear wave elastography (PSWE) with clinical risk factors enables accurate renal fibrosis assessment. This retrospective study integrates PSWE with serum creatinine (Scr) and estimated glomerular filtration rate (eGFR) to develop and validate a nomogram for personalized renal fibrosis evaluation in chronic kidney disease (CKD) patients.
Methods
A total of 157 patients underwent renal PSWE and kidney biopsy. PSWE measured cortical stiffness in the mid-portion of the right kidney. Feature importance was selected using elastic net regression, XGBoost, and random forest, with PSWE, Scr, and eGFR identified as key variables. Three models were established: Model 1 (PSWE + Scr + eGFR), Model 2 (Scr + eGFR), and Model 3 (PSWE). Diagnostic performance was evaluated using receiver operating characteristic (ROC) curves and area under the curve (AUC) values. A nomogram based on PSWE, Scr, and eGFR was developed for precise fibrosis risk assessment. The Hosmer-Lemeshow test and K-fold cross-validation were used to evaluate the nomogram's generalizability.
Results
Model 1 achieved an AUC of 0.928, outperforming Model 2 (AUC = 0.878) and Model 3 (AUC = 0.824). The Hosmer-Lemeshow test yielded a P-value of .7969, and K-fold cross-validation showed an accuracy of 0.8419 and a Kappa value of 0.6780.
Conclusion
PSWE combined with Scr and eGFR enhances diagnostic accuracy in differentiating renal fibrosis severity in CKD patients, aiding clinicians in making precise clinical decisions. The PSWE-based nomogram demonstrates excellent performance in predicting renal fibrosis severity.
Keywords
Introduction
Chronic kidney disease (CKD) is a major global health issue, characterized by high morbidity and mortality rates, significantly impacting patient health and increasing healthcare burdens.1,2 Renal fibrosis, a common end-stage pathological manifestation of CKD progression, is an independent risk factor for the progression of CKD to renal failure. Accurate diagnosis and staging of renal fibrosis are critical for personalized treatment and monitoring disease progression. 3 Currently, kidney biopsy remains the gold standard for diagnosing renal fibrosis; however, its invasiveness and risk of complications limit its feasibility for continuous monitoring.4,5 Therefore, there is an urgent need to develop non-invasive and reliable diagnostic methods.
Shear wave elastography (SWE), an emerging non-invasive imaging technique, has been widely used to assess liver fibrosis in patients with chronic liver disease via 2D-SWE and is gradually being applied to evaluate renal fibrosis in both animal models and humans. However, research utilizing point shear wave elastography (PSWE) for renal fibrosis assessment remains limited.6,7 While some studies suggest a positive correlation between the degree of fibrosis and tissue stiffness, others report contradictory findings, indicating that severely damaged kidneys may exhibit lower stiffness than mildly damaged ones. This discrepancy may be attributed to the fact that reduced blood flow has a greater impact on kidney stiffness than tissue fibrosis itself. Additionally, some studies have found no significant relationship between shear wave speed and fibrosis indicators or perfusion.8–11 These inconsistencies highlight the need for further investigation into the application of SWE in evaluating renal fibrosis. Despite these challenges, SWE holds significant potential as a tool for assessing renal fibrosis. It enables real-time, quantitative evaluation of tissue stiffness, offering a non-invasive and accurate method for renal fibrosis assessment. This capability provides critical support for the diagnosis and management of CKD patients, particularly those requiring continuous monitoring. With ongoing technological advancements and broader clinical applications, SWE is expected to become an essential tool for staging and diagnosing renal fibrosis, offering clinicians robust evidence for diagnosis and treatment decisions.
Methods
Study Design and Ethics Approval: This retrospective investigation was conducted in accordance with the principles outlined in the Declaration of Helsinki (2013 revision). Ethical approval was obtained from the Institutional Review Board of the Affiliated Hospital of Guangdong Medical University (Approval No: PJKT2024-166; Date: August 2024) prior to study initiation. Written informed consent was obtained from all participants or their legal guardians. This retrospective analysis included CKD patients who visited the Ultrasound Medicine Department of the Affiliated Hospital of Guangdong Medical University from August 2022 to October 2023. Based on CKD staging, the cohort comprised: 84 patients with stage G1 CKD (64 with mild fibrosis; 20 with moderate-to-severe fibrosis), 30 patients with stage G2 CKD (15 with mild fibrosis; 15 with moderate-to-severe fibrosis), 32 patients with stage G3 CKD (7 with mild fibrosis; 25 with moderate-to-severe fibrosis), eight patients with stage G4 CKD (all showing moderate-to-severe fibrosis), and three patients with stage G5 CKD (all with moderate-to-severe fibrosis). All patients underwent comprehensive evaluations, including kidney biopsy, liver and kidney function tests, routine 2D ultrasound, and PSWE examination. Kidney biopsies performed by experienced nephrology pathologists following clinical diagnostic standards served as the outcome validator. As PSWE is a non-invasive and radiation-free technique, it posed no additional risks to patients. Prior to the examination, detailed explanations of the procedure were provided to patients or their legal guardians.
Inclusion Criteria are as follows: (1) Patients were diagnosed with CKD based on the 2012 Kidney Disease: Improving Global Outcomes (KDIGO) guidelines. 12 (2) Liver and kidney function biomarker tests were conducted one day prior to kidney biopsy. (3) PSWE examination was performed before kidney biopsy.
Exclusion Criteria are as follows: (1) Presence of diseases that may interfere with PSWE examination. (2) Inability to cooperate with breathing instructions during PSWE examination. (3) Insufficient tissue obtained from kidney biopsy for pathological analysis.
Study Flow: As shown in Figure 1, a total of 157 patients meeting the inclusion criteria were enrolled. Among these, 86 patients had mild fibrosis, and 71 patients had moderate-to-severe fibrosis. Due to the limited number of severe fibrosis cases (n = 10), moderate and severe cases were combined into a single group for analysis, referred to as “moderate-to-severe fibrosis.” The baseline characteristics of the study population are presented in Table 1.

Flowchart of study population selection.
Baseline characteristics of the study population.

PSWE: point shear wave elastography; eGFR: estimated glomerular filtration rate; Scr: serum creatinine; UACR: urine albumin to creatinine ratio; UPCR: urine protein to creatinine ratio.
Ultrasound examination
To minimize inter-observer variability, all ultrasound imaging examinations were independently performed by a single ultrasound physician with over 5 years of experience in abdominal ultrasound and more than 3 years of experience in SWE. The ultrasound physician was blinded to biopsy results. The examinations were conducted using an ACUSON Sequoia ultrasound system equipped with a convex array probe (5C1: 1.0–5.7 MHz). First, a 2D ultrasound examination was performed with the patient in the prone position. A conventional longitudinal scan of the kidney was conducted, ensuring that the ultrasound beam was as perpendicular as possible to the renal capsule. Measurements of the right kidney length, thickness, and cortical thickness were recorded. Subsequently, a PSWE examination was performed. Patients underwent PSWE examination 3 days before kidney biopsy

Ultrasound schematic of PSWE examination.
Renal biopsy
Ultrasound-guided renal biopsy was performed at the lower pole of the right kidney using a 16G biopsy needle (BARD MaxCore disposable biopsy needle, USA). The biopsy specimens were evaluated by two experienced pathologists, each with over five years of clinical experience. Pathologists were blinded to PSWE results. Histopathological evaluation of the renal biopsy specimens was performed using optical microscopy, immunofluorescence, and electron microscopy. Any discrepancies were resolved through thorough discussion and consensus. A semi-quantitative scoring system was used for comprehensive assessment of renal fibrosis, based on pathological observations, including: Glomerular attributes (e.g. cellular proliferation, segmental lesions, and global sclerosis), Tubulointerstitial characteristics (e.g. infiltration, fibrosis, and atrophy). Vascular changes (e.g. wall thickening and hyaline degeneration). The scoring reference is detailed in Table 2.14,15 Based on the pathological scores, cases were categorized into three fibrosis severity groups: Mild fibrosis (≤9 points), Moderate fibrosis (10–18 points), Severe fibrosis (≥19 points). Due to the limited number of severe fibrosis cases (n = 10), moderate and severe fibrosis cases were combined into a single group for analysis, referred to as moderate-to-severe fibrosis (Table 3).
Index of renal fibrosis pathology grade.
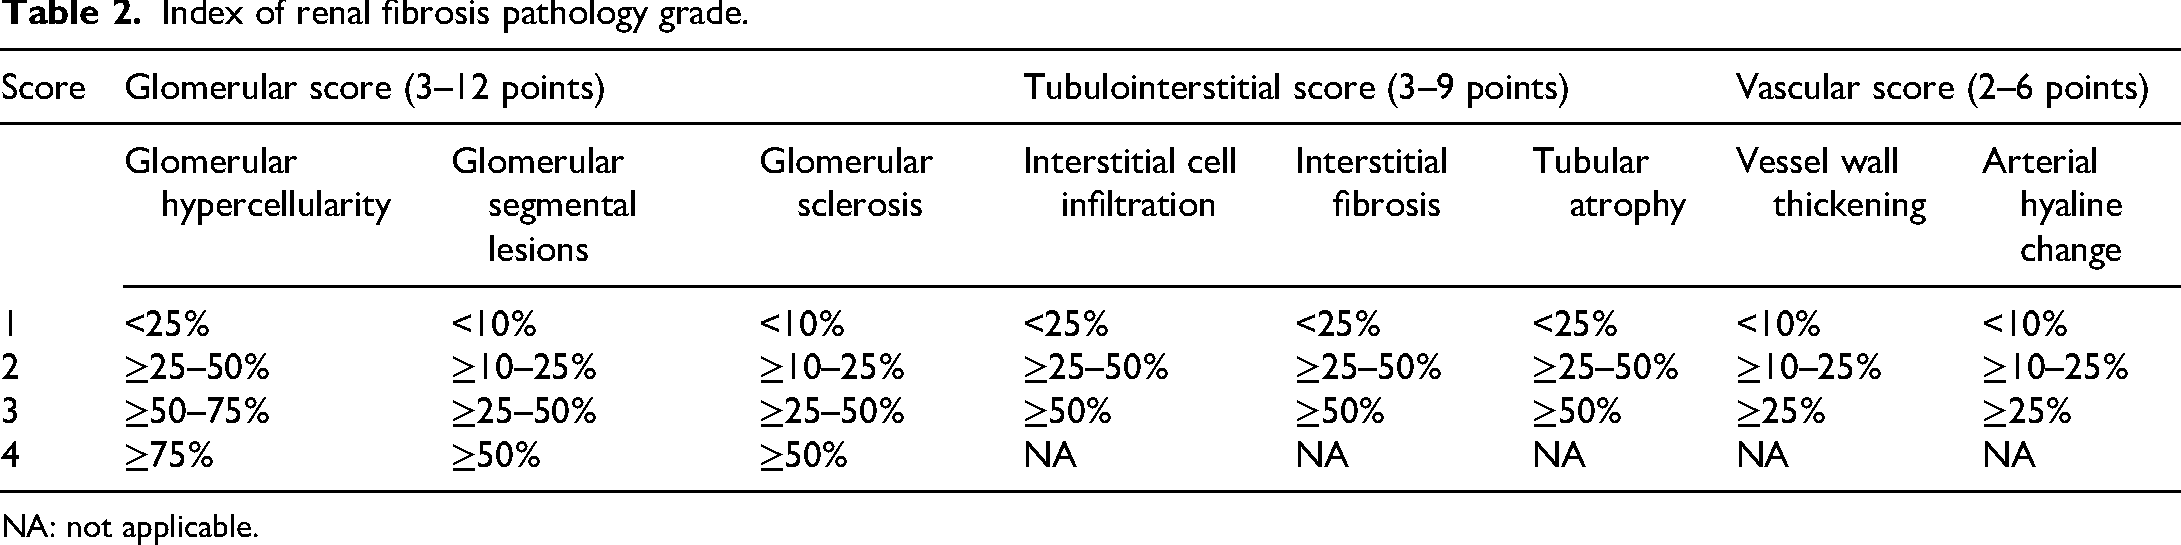
NA: not applicable.
Count of mild and moderate-to-severe fibrosis in different pathological types.

Selection of predictive variables
As shown in Table 1, a total of 19 predictive variables were derived from clinical parameters, renal function biomarkers, and ultrasound imaging features. Selecting variables highly correlated with renal fibrosis grading is crucial. Previous studies have reported various approaches integrating SWE and eGFR, as well as nomograms based on SWE, hypertension, and eGFR.16,17 In this study, three different algorithms were employed to rank the importance of predictive variables: Elastic Net Regression, XGBoost, and Random Forest.18–21 Due to space limitations, only the top five most important predictive variables for each algorithm are displayed. By comparing the results across all three algorithms, PSWE, Scr, and eGFR were ultimately selected as the final predictive variables (Figure 3(a) to (d)).
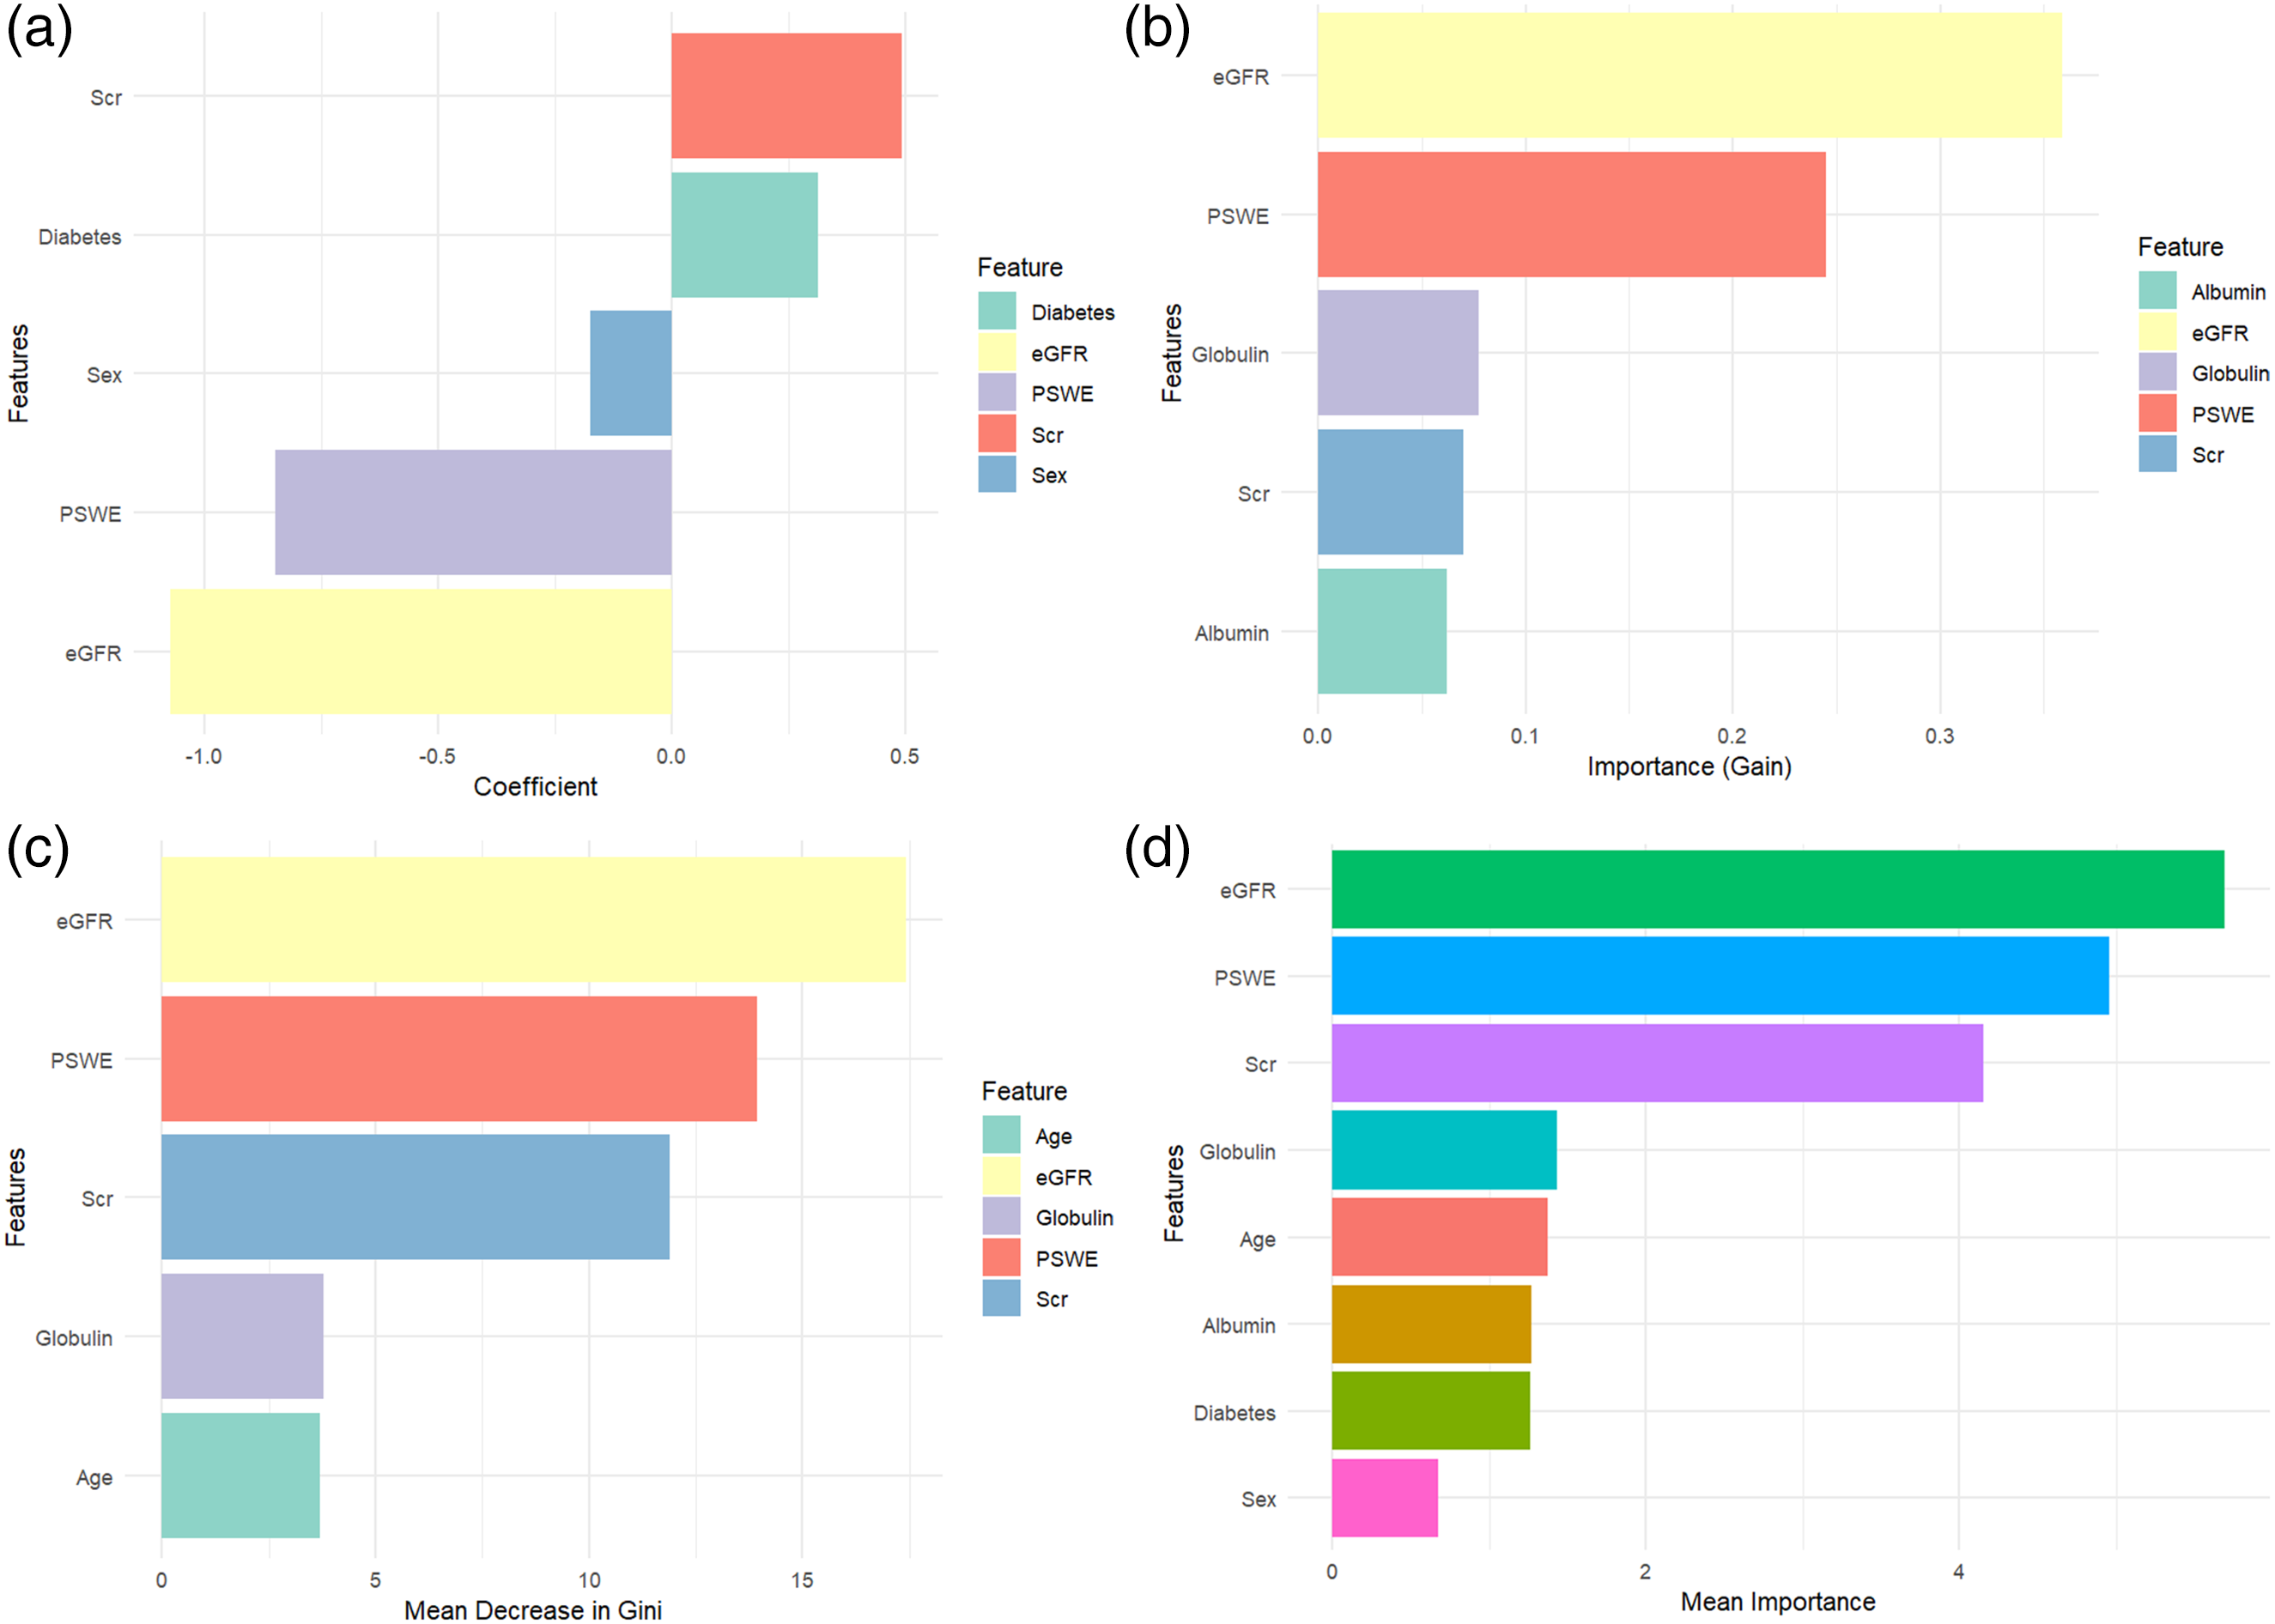
(a) Top 5 important predictive variables identified by elastic net regression. Among these variables: Scr had the strongest positive impact on model prediction. eGFR had the strongest negative impact on model prediction. (b) Top 5 important predictive variables identified by XGBoost model. Among these variables, eGFR was the most influential feature in the classification task. PSWE, Globulin, Scr, and Albumin also played significant roles in predicting renal fibrosis. (c) Top 5 important predictive variables identified by the random forest model. Among these variables, eGFR was the most influential feature in the model. PSWE, Scr, Globulin, Age also played significant roles in predicting renal fibrosis. (d) comprehensive analysis of important predictive variables. Based on the comprehensive analysis from panel (d), the following key insights are drawn: PSWE, Scr, and eGFR are key predictive variables for renal fibrosis, as these variables consistently appear as important predictors across multiple models.
Construction of receiver operating characteristic (ROC) curves
We hypothesized that combining PSWE values with clinical risk factors would improve the accuracy of renal fibrosis assessment. To evaluate the diagnostic performance, we constructed three models: Model 1: PSWE, Scr, and eGFR. Model 2: Scr and eGFR. Model 3: PSWE. ROC curves were plotted, and the area under the curve (AUC) was calculated to quantify the diagnostic performance of each model. The optimal cutoff point was determined using the Youden Index, and corresponding sensitivity, specificity, and accuracy values were obtained (Figure 4).

ROC curves against biopsy-confirmed fibrosis.
Construction of the nomogram, calibration curve
A nomogram was constructed based on PSWE, Scr, and eGFR to predict renal fibrosis (Figure 5). A calibration curve was generated using 1000 bootstrapped resamples to assess the predictive accuracy of the nomogram (Figure 6). The Hosmer-Lemeshow test was used to evaluate the goodness-of-fit of the nomogram. 22 Given the small dataset size, K-fold cross-validation was employed to evaluate the nomogram's generalizability.23,24

A nomogram constructed based on PSWE, eGFR, and Scr.

A calibration curve based on the nomogram.
Establish a stratified clinical diagnostic pathway for renal fibrosis
This pathway integrates the synergistic application of eGFR, PSWE, and biopsy to maximize non-invasive diagnostic efficacy while reducing unnecessary biopsies (Figure 7).

Stratified clinical diagnostic pathway for renal fibrosis.
Statistical analysis
Statistical analysis was performed using SPSS 25.0 software (SPSS Inc., Chicago, IL, USA) and R statistical software (version 4.3.3; http://www.R-project.org). Categorical variables were expressed as frequency (percentage) and compared using the chi-square test or Fisher's exact test. Continuous variables were presented as mean ± standard deviation (SD) and analyzed using the t-test or Mann‒Whitney U test, depending on data distribution. A P < .05 was considered statistically significant. No missing data existed for key variables (PSWE, Scr, eGFR) due to strict inclusion criteria.
This study involved the development and validation of a multivariable diagnostic prediction model. The design and reporting adhere to the TRIPOD statement (Transparent Reporting of a multivariable prediction model for Individual Prognosis Or Diagnosis) guidelines. The completed TRIPOD checklist has been submitted as supplementary material. 25
Results
Patient characteristics analysis
Table 1 summarizes the characteristics of patients with mild fibrosis and moderate-to-severe fibrosis. Significant differences were observed between the two groups in terms of PSWE, eGFR, Scr, total protein, globulin, urea nitrogen, and diabetes, with P < .05, indicating statistical significance.
The ROC curve analysis
Model 1: AUC = 0.928, sensitivity = 0.873, specificity = 0.860, accuracy = 0.867.
Model 2: AUC = 0.878, sensitivity = 0.775, specificity = 0.849, accuracy = 0.812.
Model 3: AUC = 0.824, sensitivity = 0.915, specificity = 0.593, accuracy = 0.754.
Comparison of Models: Model 1 outperforms both Models 2 and 3 in terms of AUC, specificity, and accuracy, highlighting the performance improvement achieved by including PSWE in the clinical model. To compare the areas under the ROC curves (AUC), the Delong test was used to assess statistical differences in diagnostic performance between the models: Model 1 versus Model 2: Z-value = 2.603, P = .009 (P < .05). Model 1 versus Model 3: Z-value = 3.511, P = .0004 (P < .01). Model 2 versus Model 3: Z-value = 1.292, P = .197 (P > .05).
The threshold for PSWE in diagnosing mild and moderate-to-severe fibrosis is 6.70 kPa. Higher SWE values are associated with a greater likelihood of mild fibrosis.
The calibration curve analysis
The P-value of the Hosmer-Lemeshow test was 0.7969, indicating that the model was well-fitted (P > .05). This chart is used to assess the agreement between the predicted probabilities and the observed probabilities of a logistic regression model. The mean absolute error was 0.009, indicating minimal error and good model calibration. The mean squared error was 0.00013, suggesting that the predictions align very closely with the actual observations.
K-fold cross-validation analysis
The results of K-fold cross-validation were as follows: accuracy = 0.8419, kappa = 0.6780, accuracy SD = 0.0647, kappa SD = 0.1342. An accuracy of 84.19% indicates that the model can effectively differentiate between patients with varying degrees of renal fibrosis, making it suitable for clinical decision-making. The Kappa value of 0.6780 demonstrates that the model's predictions are reliable, suggesting its potential as an auxiliary tool in clinical practice to assist doctors in making diagnoses. The accuracy SD (0.0647) and kappa SD (0.1342) indicate that the model's performance shows low variability across different subsets, suggesting it is adaptable to diverse patient groups.
Discussion
In previous studies, PSWE alone has demonstrated diagnostic efficacy in predicting renal fibrosis, while combining PSWE with clinical indicators can enhance diagnostic performance. It is well-established that eGFR and Scr are mature biochemical markers used in clinical practice, with eGFR serving as a crucial indicator for CKD staging. In this study, we applied three algorithms for data processing and feature selection and found that PSWE, eGFR, and Scr significantly contribute to predicting renal fibrosis. Other studies have suggested that hypertension and diabetes are also important factors in renal fibrosis.26,27 The Elastic Net algorithm in our study included diabetes as a relevant factor, although it was not incorporated by other algorithms, possibly due to the relatively low number of diabetic nephropathy cases in this cohort.
The nomogram 28 is widely used in patient management and disease monitoring due to its excellent performance and easy-to-interpret results. In this study, we developed a novel PSWE-based nomogram that can distinguish between moderate-to-severe and mild renal dysfunction. The AUC of the model was 0.928, outperforming both the clinical model and the standalone PSWE model. We demonstrated that PSWE is an independent feature for predicting moderate-to-severe renal dysfunction and provides additional value when combined with clinical variables. Different levels of kidney pathology require different treatment strategies. Early identification of mild renal dysfunction allows for timely intervention, while moderate-to-severe cases require more aggressive treatment to delay the need for dialysis. 29 By using multiple algorithms, we reduced 19 candidate risk factors down to three potential predictors—PSWE, Scr, and eGFR—which were then incorporated into the nomogram to assist in the individualized diagnosis of renal damage severity.
PSWE is a non-invasive imaging technique that quantifies tissue elasticity by tracking shear wave propagation induced by acoustic radiation force pulses. Research has shown that PSWE performs well in distinguishing between mild and moderate-to-severe kidney damage, with an AUC of 0.824 in our study. The threshold for diagnosing mild and moderate-to-severe fibrosis using SWE was 6.70 kPa, with higher SWE values indicating a greater likelihood of mild fibrosis. Research has identified glomerulosclerosis and tubulointerstitial fibrosis as common pathological changes in chronic and end-stage renal disease. These changes lead to increased renal cortical stiffness, while reduced renal perfusion can decrease kidney stiffness. Studies have shown that both renal fibrosis and low perfusion jointly influence kidney stiffness, with fibrosis increasing stiffness and reduced perfusion decreasing it. In the progression of CKD, the effect of renal perfusion on kidney stiffness may be more significant than fibrosis itself. For example, Asano et al. 30 suggested that renal perfusion has a greater impact on SWE parameters than histological fibrosis progression, indicating that as CKD advances, renal stiffness is more influenced by changes in renal blood flow. Specifically, as the pathological grading increases, microvascular intimal proliferation and medial thickening reduce the lumen diameter, increase flow resistance, and lead to reduced renal perfusion. These changes create low perfusion pressure, which further decreases kidney stiffness, potentially masking the increased stiffness caused by fibrosis progression.
Therefore, decreased renal perfusion may have a more significant impact on the stiffness of CKD kidneys than fibrosis itself. In addition, Chauveau et al. 31 reported that as tubulointerstitial fibrosis progresses and renal function deteriorates, magnetic resonance elastography reveals a decrease in renal stiffness. Similarly, studies by Hu et al. 11 have shown that shear wave velocity in severely damaged kidneys is significantly lower than in mildly or moderately damaged kidneys. As arterial wall thickening increases, SWE values tend to decrease, indicating that the more severe the small artery stenosis, the lower the kidney stiffness. Chen et al. 32 also demonstrated a significant negative correlation between SWE measured elasticity values and the risk of moderate-to-severe renal fibrosis in CKD patients. Compared to mild cases, the SWE values in the moderate-to-severe renal fibrosis group were significantly lower. Although hemodynamic parameters were not collected in our study to explore the relationship between renal perfusion and PSWE, previous studies by the above scholars confirmed the hypothesis that blood perfusion plays an important role in affecting renal elasticity.
Overall, these studies suggest that during the progression of CKD, renal perfusion may have a greater impact on kidney stiffness than fibrosis. As a result, with increasing pathological grading, SWE parameters tend to decrease. Given the impact of reduced blood flow on kidney SWE parameters, renal perfusion (rather than interstitial fibrosis) may primarily affect the elasticity of CKD kidney tissue. Our findings are consistent with these results, indicating that tubulointerstitial fibrosis may not be the primary factor affecting renal stiffness, while changes in renal perfusion play a larger role in the pathological progression of CKD. Limitations of this study include: (1) The relatively small cohort size, particularly the limited number of eligible participants in the severe renal fibrosis group, which may compromise the statistical power and precision of the findings. (2) Absence of pathological categorization among CKD patients; future studies should assess whether results remain consistent across different pathological subtypes. (3) The single-center design, necessitating external validation in multi-center cohorts to confirm generalizability. (4) This study was a retrospective analysis, and due to data limitations (lack of menopausal status/hormone levels), we were unable to conduct in-depth gender-stratified analyses.
Conclusion
PSWE combined with Scr and eGFR enhances diagnostic accuracy in differentiating renal fibrosis severity in CKD patients, aiding clinicians in making precise clinical decisions. The PSWE-based nomogram demonstrates excellent performance in predicting renal fibrosis severity.
Supplemental Material
sj-docx-1-sci-10.1177_00368504251363483 - Supplemental material for Integrative evaluation of shear wave elastography and renal function biomarkers for predicting renal fibrosis in chronic kidney disease patients
Supplemental material, sj-docx-1-sci-10.1177_00368504251363483 for Integrative evaluation of shear wave elastography and renal function biomarkers for predicting renal fibrosis in chronic kidney disease patients by Jiexin Wang, Honglian Zhou, Xiaohong Xu, Yuping Yang, Qiang Huang, Shixing Zheng and Qiurong Ye in Science Progress
Footnotes
Acknowledgments
We acknowledge the collaborative efforts of the clinical team at the Nephrology Department. Non-author contributors provided technical assistance only.
Ethical approval
This study received ethical approval from the Institutional Review Board of the Affiliated Hospital of Guangdong Medical University (Approval No: PJKT2024-166; August 2024) prior to commencement.
Informed consent
Written informed consent for renal biopsy was obtained from all participants or their legal guardians prior to participation. Detailed procedural explanations of point shear-wave elastography were provided before examination.
Authorship contribution
All authors made substantial contributions to the conception, execution, or interpretation of this study. Each author meets the ICMJE criteria for authorship.
Funding
The authors received no financial support for the research, authorship, and/or publication of this article.
Declaration of conflicting interests
The authors declared no potential conflicts of interest with respect to the research, authorship, and/or publication of this article.
Data availability statement
The clinical data supporting this study are available from the first author upon reasonable request and with institutional approval. Data were sourced from verified clinical records.
Supplemental material
Supplemental material for this article is available online.
References
Supplementary Material
Please find the following supplemental material available below.
For Open Access articles published under a Creative Commons License, all supplemental material carries the same license as the article it is associated with.
For non-Open Access articles published, all supplemental material carries a non-exclusive license, and permission requests for re-use of supplemental material or any part of supplemental material shall be sent directly to the copyright owner as specified in the copyright notice associated with the article.