
Abstract
Creep is an inherent property of polymeric geogrids, which can significantly impact the safety and durability of reinforced soil structures, as it directly influences the effectiveness of the interface between the geogrid and soil. This study involved a series of creep tests on two types of biaxial geogrids to investigate their creep behavior. Four different constant loads were applied, each maintained for 1000 hours. The results indicated that for biaxial geogrids, the geogrid with a higher tensile strength experienced more creep deformation than the one with lower tensile strength at the same loading level. Furthermore, the geogrid fractured when the loading level reached 60% of its ultimate strength. To systematically investigate the influence of geogrid reinforcement and its creep characteristics on the mechanical performance of sand cushions, a series of large-scale model tests were conducted using a geogroove apparatus. The experimental program involved a comparative analysis of three types of cushion materials: unreinforced sand, sand reinforced with non-creeped geogrids, and sand reinforced with geogrids subjected to creep. The results demonstrated that the tensile strength of the geogrid plays a significant role in enhancing the bearing performance of the composite system. When subjected to appropriate tensile strain levels, the reinforced sand cushions showed marked improvements in bearing capacity compared to the unreinforced case. Quantitatively, two distinct geogrid-reinforced systems showed increases in load-bearing capacity of approximately 20% and 55%, respectively. However, the long-term deformation behavior (creep) of the geogrids was found to negatively affect the mechanical efficiency of the reinforcement, leading to a reduction in overall bearing capacity. Additionally, creep-induced changes were observed to influence the stress distribution within the cushion, alter the effective internal friction angle, and modify the overall stiffness response of the system.
Introduction
Geogrid-reinforced soil structures, including foundations, embankments, and retaining walls, are widely utilized due to their cost-effectiveness and enhanced mechanical stability.1–7 Geogrids improve load distribution and lateral confinement by mobilizing tensile resistance, thereby enhancing the bearing performance of subgrade systems.8–10 However, the long-term performance of these reinforced systems is inherently linked to the time-dependent deformation behavior—commonly referred to as creep—of the geosynthetic reinforcement, particularly under sustained loads that are below their ultimate tensile strength (UTS).11–13
Creep is particularly pronounced in polymer-based geogrids (e.g., polypropylene, high-density polyethylene (HDPE)), involving both viscoelastic and viscoplastic deformation, which may lead to strain accumulation, interface weakening, and eventual deterioration of structural performance over time.14–20 Consequently, many researchers have highlighted the importance of accurately characterizing geogrid creep behavior to define long-term design strength, limit state thresholds, and service life.8,12,21,22
Creep behavior of geosynthetic materials: Previous studies have extensively focused on the intrinsic creep properties of polymer composites used in geosynthetics. Low-temperature and cyclic loading tests on HDPE, polypropylene (PP), and polymer-modified matrices have demonstrated that stress levels, environmental conditions (humidity, temperature), and additive content significantly influence time-dependent deformation.6,7,14–17,20,21,23,24 For instance, Zhao et al.13,15 investigated accelerated creep in geocell sheets, while Qin et al. 17 examined matrix–fiber interactions under sustained stress in fiber-reinforced polymers. Jayswal et al. 21 further reported the complex viscoelasticity and post-creep recovery behavior exhibited by 3D-printed polymer composites. However, these studies primarily focus on the polymer behavior in isolation, without relating it to system-level geotechnical responses or load-bearing implications.
Constitutive modeling of creep: To describe time-dependent deformation behavior, numerous constitutive models have been developed. Among these, the Kelvin-Voigt and Burger models are widely used due to their ability to capture both primary and secondary creep phases.18,19,25–29 Zhang et al.25,26 applied these models to viscoelastic rods and rock creep simulations, while Farno et al. 27 demonstrated that fractional Kelvin-Voigt models better capture long-term deformation in biological-sludge analogs. In the geotechnical domain, Zou et al. 18 and Xiao et al. 22 extended these frameworks to simulate lateral deformation in reinforced walls, using temperature-creep coupled models. However, the application of these models has predominantly been limited to laboratory fitting and numerical simulations, with limited validation through field-scale or model-scale mechanical performance evaluations.
Interface behavior and geogrid–soil interaction under creep: Creep not only affects the internal strain behavior of geogrids but also alters their interaction with the surrounding soil. Yang et al., 11 Yuan et al., 9 and Ferreira et al. 30 have reported that long-term loading can lead to a reduction in shear resistance at the geogrid–soil interface. Similar findings were observed in pull-out and direct shear tests by Liu et al., 1 Gao et al., 2 and Cui et al., 31 highlighting the critical role of interface degradation in reinforced soil stability. Other researchers32–36 have used scanning electron microscope (SEM) and nanoindentation techniques to examine microstructural damage, crack propagation, and coating loss in polymer geogrids post-creep. Despite these advances, there remains a lack of direct evidence linking such interface or fiber-scale damage to macro-scale effects, such as reduced bearing capacity, lower modulus, or compromised stress redistribution.
In summary, three major limitations exist in the current state of research: (i) a lack of integrated experimental frameworks linking creep-induced material degradation to the full-system load-bearing behavior; (ii) insufficient evaluation of the effects of creep on key geotechnical indices, such as modulus, stress diffusion angle, and earth pressure distribution; and (iii) limited understanding of how the performance of pre-creeped geogrids compares to that of new geogrids in practical cushion applications.
To address these gaps, this study proposes an integrated methodology comprising: (1) long-term laboratory creep tests on two types of biaxial polypropylene geogrids under four different load levels (20%, 30%, 40%, and 60% UTS); (2) SEM analysis to examine microstructural evolution and fiber-level damage; and (3) large-scale static load tests using a geotechnical trench setup to assess load-settlement behavior, earth pressure, stress diffusion characteristics, and bearing capacity.37–40 This study thus bridges the material-structure gap by demonstrating how creep affects not only the intrinsic properties of geogrids but also their system-level performance in reinforced cushion foundations. The findings are expected to provide insights into design limits for long-term geogrid use, particularly by identifying critical stress thresholds and creep durations beyond which mechanical efficiency is compromised.
Creep test
Properties of geogrids
To investigate the mechanical behavior of geogrid-reinforced systems, two commercially available biaxial PP geogrids were selected based on a comprehensive market survey. Both specimens were sourced from the same manufacturer to minimize variability in production processes. The geometric configuration, mass per unit area, and tensile performance characteristics of the geogrids are provided in Table 1, which includes details such as aperture dimensions, tensile strength, and stress levels corresponding to specified strain values.
Physical property indexes of biaxial geogrids. 39

These two geogrids were selected based on their distinct tensile strength characteristics: BG1, with lower tensile strength, and BG2, with higher tensile strength. These differences provide a basis for comparing the impact of creep behavior on reinforcement performance.
Due to proprietary restrictions, the manufacturer did not disclose specific formulation details, such as the type and dosage of stabilizing additives. However, it was confirmed that the products exhibited ultraviolet (UV) resistance through the incorporation of carbon black at a typical concentration of approximately 0.5 wt%. The tensile performance of the geogrids was evaluated in terms of the maximum tensile load normalized by area density and the elongation corresponding to peak load conditions.
Testing apparatus
The creep testing apparatus, which consisted of a support system, clamping system, loading system, and measurement system, was developed by the authors, as shown in Figure 1.

Pictorial view of the test apparatus for the creep tests.
The clamping system was used to secure the specimens. Temperature and humidity were maintained at 20°C ± 2°C and 50% ± 10%, respectively, throughout the experiment to minimize external influences on the creep behavior. The clamping method is critical in a creep test to ensure measurement accuracy during creep deformation. In this study, the clamping system consisted of two parallel steel plates (holders) and bolts. The geogrid specimen was placed between the two parallel steel plates, which were clamped in position using bolts. To provide sufficient friction and prevent the specimen from sliding against the steel plates, a rubber blanket was attached to the side of each steel plate in contact with the specimen. The width of the plates was 450 mm, but the width of each tested geogrid specimen was 200 mm, which provided a uniform clamping load on the specimen.
One end of the plate was fixed to the support system, while the other end was connected to the loading system. A dial gauge with an accuracy of 0.001 mm was used to measure the displacement of the geogrid specimens. Weights were employed to apply the load.
Test method
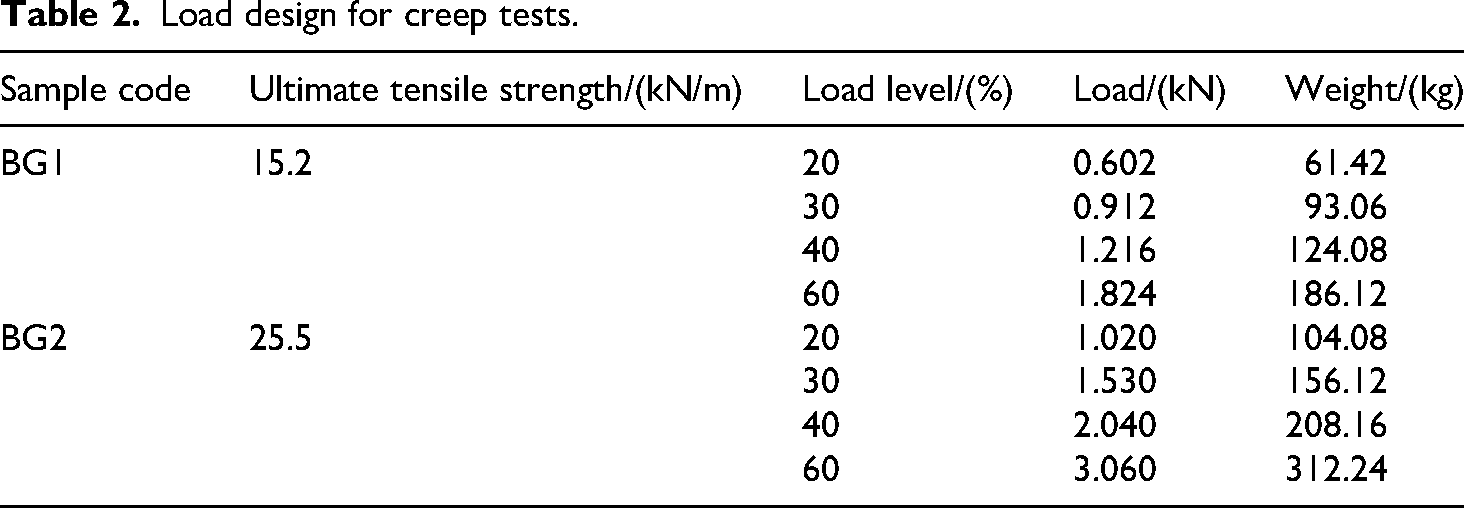
During the creep test, the temperature was maintained at 20°C ± 2°C, and the relative humidity at 50% ± 10%. In this study, four different loading levels were selected, namely 20%, 30%, 40%, and 60% of the UTS of the geogrid under test, as shown in Table 2.
Load design for creep tests.
Before initiating the test, a biaxial geogrid specimen with six parallel ribs was mounted in the holder. The specimens were pre-stressed for 24 hours at a load value equal to 1% of the UTS to ensure they remained flat. The lengths of the specimens at this stage were recorded as their initial lengths. Subsequently, the designed loads were applied and maintained for 1000 hours or until the specimen fractured, whichever occurred first. During the first 100 hours, data were recorded at 0 minutes, 1 minutes, 2 minutes, 4 minutes, 8 minutes, 12 minutes, 30 minutes, 1 hour, 2 hours, 4 hours, 8 hours, 10 hours, 20 hours, 50 hours, and 100 hours. Thereafter, data were recorded every 100 hours until 1000 hours.
Results and discussion
Creep curves
In a creeping test, the relationship between the creep strain and time is referred to as the creep curve. The creep curves obtained in this study are shown in Figure 2. In general, creep strain increases with the duration of the applied load for a given loading condition. Additionally, creep strain increases with the applied loading level for the same duration of load application. In Figure 2(a), the creep curve under 60% of the UTS initially stabilizes, but then experiences a sudden increase. This sudden rise occurs when the material reaches its yield point, at which micro-cracking and chain scission within the polymer structure accelerate deformation. Figure 2(a) presents the creep curves of the biaxial geogrid with a tensile strength of 15.2 kN/m (BG1). The maximum strains observed are 3.236%, 5.609%, and 6.221% at 1000 hours, respectively. However, the BG1 specimen ruptured under a loading level of 60% of the UTS at 600 hours, with the maximum creep strain reaching 24.72%.

Time–strain creep curves: (a) BG1; (b) BG2.
Figure 2(b) shows the creep curves of the biaxial geogrid with a tensile strength of 25.5 kN/m (BG2). The creep curves of BG2 are also very similar to those of BG1 when the loading levels are 20%, 30%, and 40% of the UTS. The maximum creep strains are 4.329%, 6.233%, and 6.940% at 1000 hours, respectively. For the BG2 specimen, creep rupture occurred at 70 hours under a loading level of 60% of the UTS, with a maximum creep strain of 7.834%.
Based on the results of the tests above, it can be summarized that there are two types of creep curve shapes. When the loading levels are relatively low (in this study, less than 60% of the UTS), no creep rupture occurs. In this case, the creep curve is relatively flat and can be divided into three stages: a rapid increase in creep strain, a slow increase in creep strain, and a constant creep strain as the load duration increases. In contrast, when the loading levels are high, creep rupture occurs, and the creep curve is not flat. It can be divided into three stages: a rapid increase in creep strain, a slow increase in creep strain, and a very rapid increase in creep strain leading to rupture, as the load duration increases. The duration of the second stage depends on the loading level and may be very short at higher loading levels. For BG1 and BG2, first, the creep strain of BG1 is smaller than that of BG2; second, creep rupture occurs at a loading level of 60% of the UTS, and the time for rupture to occur in BG1 is greater than that in BG2. Based on Tables 1 and 2, the tensile strength of BG1 is lower than that of BG2. Thus, under the same loading level, the actual weights differ (as shown in Table 2). The load acting on BG2 at each loading level is the greatest. A similar phenomenon has been observed by Zou et al., 18 Dong et al., 37 and Miyata et al. 38
Isochronous creep curves
The curve of the loading level versus the creep strain at a given load duration is referred to as the isochronous curve, which is another method for representing the creep property. Figure 3 shows the isochronous curves of BG1 and BG2 under different loading levels at 20 hours, 100 hours, 200 hours, 400 hours, 600 hours, 800 hours, and 1000 hours, respectively. The creep strain increases with the loading level for the same load duration. The isochronous curve is convex and escalates toward rupture as time progresses. The loading level is also a significant factor affecting the creep strain for a given type of biaxial geogrid.

Isochronous load–strain curves for BG1 and BG2 samples: (a) BG1; (b) BG2.
Residual stain–time curves
After the creep test for 1000 hours, the weights and clamps beneath the geogrids were removed, and the geogrids were maintained in a vertical position. The length of the geogrid specimen during the contraction test was measured as L1. The length of the measuring section of the sample was then measured at specific intervals using a vernier caliper, with an accuracy of 0.01 mm. The intervals were 5 minutes, 10 minutes, 1 hours, 10 hours, 50 hours, and subsequently every 100 hours until 1000 hours. The calculation formula for shrinkage strain is as follows:
where
As shown in Figure 4, at the moment of load removal, the geogrid experienced elastic shrinkage deformation, with the majority of this shrinkage occurring during this period. After the elastic contraction, an arc section appeared in the curve, indicating that the rate of contraction rebound gradually decreased. Plastic deformation occurred following the creep process, and shrinkage continued after unloading up to 400 hours. After 400 hours, the shrinkage deformation ceased. At the loading levels of 20%, 30%, and 40% of the UTS, neither of the three geogrids returned to their original size. The final residual strains of the geogrids at the load levels of 20%, 30%, and 40% of the UTS were 0.97%, 2.15%, and 4.18% for BG1, and 1.96%, 2.96%, and 3.64% for BG2, respectively.

Residual stain–time curves for TG, BG1, and BG2 samples: (a) BG1; (b) BG2.
Constitutive model formulation of creep behavior
Pronounced time-dependent plastic deformation was observed in the geogrid specimens under prolonged loading, particularly at elevated stress levels. The magnitude of permanent strain increased significantly with higher applied stress ratios, indicating the onset of nonlinear visco-plastic behavior under long-term loading conditions. The generalized Kelvin–Voigt model, a widely used rheological framework for simulating creep behavior in viscoelastic materials, consists of a network of multiple spring-dashpot pairs arranged in parallel, as schematically shown in Figure 5. 28 The model predictions were compared with established theoretical frameworks, such as the Burger model and Maxwell model, to assess its novelty and applicability. The selection of parameters was based on the experimental data and material characteristics, ensuring a better fit to the creep response observed in the tests.
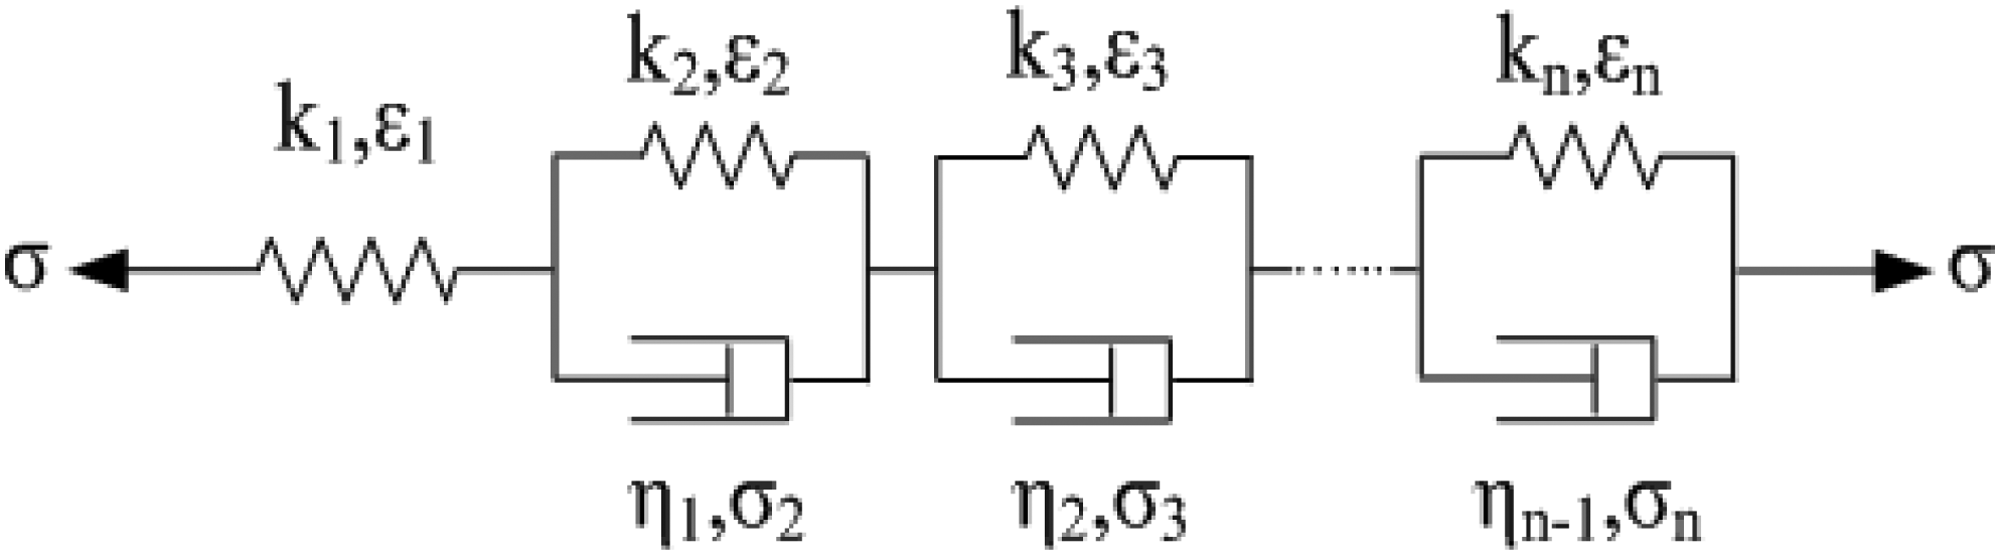
Schematic diagram of the generalized Kelvin model.
In parallel rheological systems, such as the generalized Kelvin–Voigt configuration, the total tensile stress is obtained by summing the stresses carried by each individual element, while the total strain experienced is the same across all elements due to their parallel arrangement.

In these formulations, the spring and dashpot represent idealized elastic and viscous components, governed by Hooke's and Newton's constitutive laws, respectively. The variables 


where k and
The extended Kelvin–Voigt model used in this study incorporates one primary spring element and multiple parallel spring-dashpot subunits, each exhibiting identical relaxation characteristics. When subjected to a step-load input (
To evaluate the model's predictive capability, the stretched exponential equation (equation (7)) was calibrated against the experimental creep data using non-linear least squares regression. The parameters a, b, c, d, and e were optimized based on laboratory results. A comparison between the simulated curves and empirical observations, as shown in Figure 6, demonstrates a high level of agreement, confirming both the validity and robustness of the proposed rheological model in replicating the observed long-term deformation trends. The fitting parameters of the creep curves for the geogrids are listed in Table 3. The generalized Kelvin-Voigt model provides a good fit for the creep curves, with the best fitting observed at higher load levels. The fitting coefficients (R²) of the three models (including the Burger model, Maxwell model, and the generalized Kelvin–Voigt model) under different load levels (20%, 30%, and 40% of UTS) compared to the experimental results are shown in Figure 7. Comparing the fitting results of the different models reveals that the generalized Kelvin-Voigt model provides the best fit, followed by the Maxwell model, while the Burger model provides the poorest fit.

Comparison between experimental and calculated creep strain: (a) BG1; (b) BG2.

Comparison of R2 values for the three models under different load levels (20%, 30%, 40% UTS): (a) BG1; (b) BG2.
Fitting parameter of creep curves of geogrids.

Static load indoor model tests
Test apparatus and material
The bearing capacity test of reinforced sand cushion foundations typically includes both field tests and laboratory model tests. The field test environment is more representative of actual project conditions; however, due to the influence of weather, temperature, humidity, equipment, and other environmental factors, the variability in field test results and the challenges in data processing make it difficult and costly. In contrast, laboratory model tests offer more controllable environmental and equipment factors, as well as greater economic feasibility, which has led to their widespread adoption among researchers. Laboratory model tests are mostly conducted in a model box, but due to the limited size of the model box, boundary effects inevitably increase test errors and affect the accuracy of the results. To investigate the long-term deformation effects, specifically the creep behavior, on the load-bearing performance of geogrid-reinforced sand cushions, a controlled laboratory experiment was conducted. The objective was to replicate boundary conditions similar to those encountered in field environments while minimizing the variability caused by external environmental influences. The experimental campaign was carried out in the geotechnical laboratory of the Geotechnical Institute at Taiyuan University of Technology. A large-scale reinforced concrete containment structure, with internal dimensions of 9 m in length, 4 m in width, and 3.1 m in depth, was constructed to house the model setup. The testing system comprised several key components, including subgrade material, a servo-controlled static loading apparatus, instrumentation for measurement, and a real-time data acquisition platform. As shown in Figure 8, a hydraulic actuator was employed to apply vertical loads during testing.

Schematic diagram of loading device for model test. 39
Given the substantial quantity of sand required for the experiment and spatial constraints at the site, locally sourced naturally occurring river sand was used as the foundation material. Prior to placement, the sand was screened to remove oversized particles and organic matter, ensuring uniformity. A total sand depth of 2.4 m was compacted within the test chamber. To achieve consistent and adequate density across all strata, the sand was deposited in 0.3-m layers and compacted using a flat-plate vibrator, with each layer undergoing three consecutive rounds of compaction. A square steel footing plate, measuring 200 mm × 200 mm in plan and 25 mm in thickness, was used as the interface for applying vertical loads to the cushion. Settlement readings during load application were captured using four dial gauges, precisely arranged symmetrically around the plate. The schematic of the loading assembly is shown in Figure 8.
The granular cushion material was characterized by a uniformity coefficient (Cu) of 1.79 and a curvature coefficient (Cc) of 0.91, indicating a well-graded sand with a moderate particle-size distribution. The maximum dry unit weight achieved through compaction was 1.71 g/cm³. A series of static incremental loads were applied vertically using a hydraulic jack, and both the applied pressures and resulting settlements were concurrently monitored via a calibrated pressure transducer and four dial indicators, respectively. The loading sequence strictly adhered to the procedural guidelines outlined in GB50007-2012, as issued by the Chinese Ministry of Housing and Urban–Rural Development. Each load increment was set at 20 kPa and maintained until the recorded settlement rate decreased to below 0.1 mm per hour for two consecutive hours. The test was concluded when the cumulative vertical displacement reached 0.06 times the footing width (B), corresponding to 12 mm in this experimental design. To analyze the distribution of earth pressure in the reinforced soil foundation, earth pressure cells were arranged within the foundation. The layout of the earth pressure cells in both the plane and longitudinal directions is shown in Figure 9. A total of 15 soil pressure measurement points were used. Points 1, 6, and 11 are located on the same vertical line; points 2, 7, and 12 are on another vertical line; points 3, 8, and 13 are on a third vertical line; points 4, 9, and 14 are on a fourth vertical line; and points 5, 10, and 15 are on the fifth vertical line. Points 1, 2, 3, 4, and 5 are located on the same horizontal plane, 500 mm below the ground surface. Points 6, 7, 8, 9, and 10 are positioned on a horizontal plane 300 mm below the ground surface. Points 11, 12, 13, 14, and 15 are located on another horizontal plane, 100 mm below the ground surface.
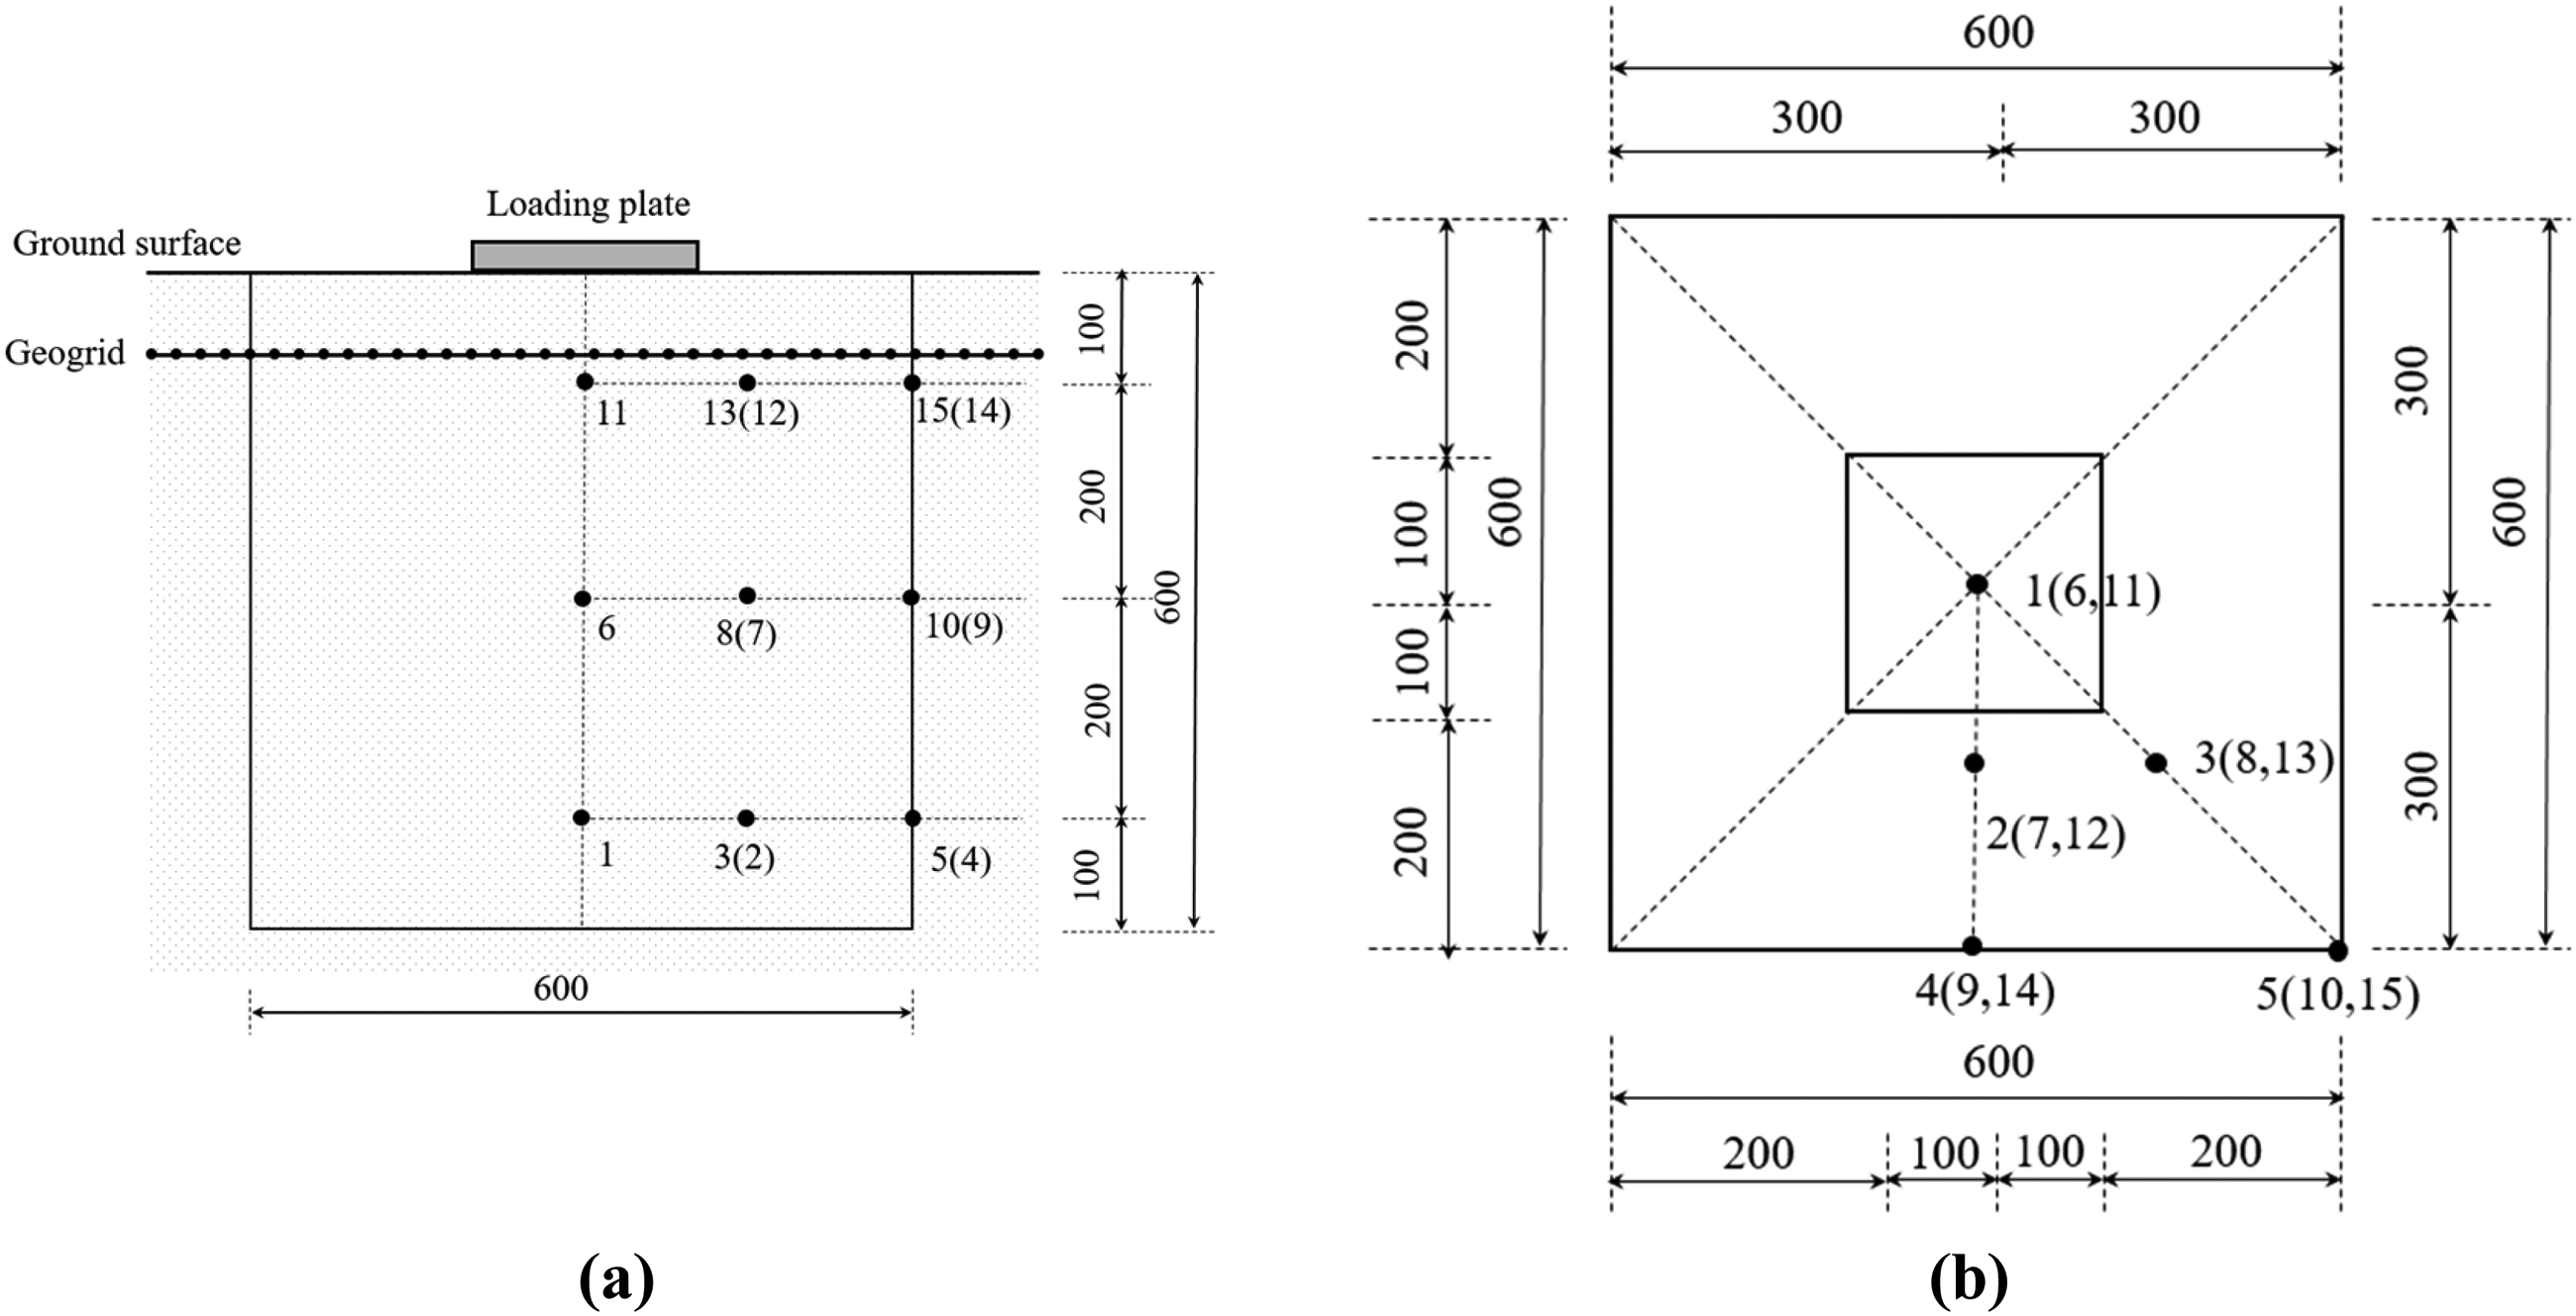
Layout of soil pressure cell: (a) vertical section view; (b) top view.
Results and discussion
Influence of tensile strength of geogrids on bearing capacity of cushion
The load–settlement relationships for various sand cushions were obtained and are illustrated in Figure 10. When compared to the unreinforced sand cushion, the reinforced sand cushions exhibited a reduction in settlement at identical load levels, indicating an improvement in the foundation's bearing capacity. Notably, the sand cushion reinforced with BG2 geogrid demonstrated a smaller settlement compared to the BG1-reinforced sand cushion, reflecting an enhanced load-bearing performance. Initially, the load–settlement curves for both the reinforced and unreinforced sand cushions overlapped, suggesting that the reinforcement effect was not significant during the early stages of loading. However, as the load increased, the separation between the curves for the unreinforced, BG1, and BG2 reinforced sand cushions became more pronounced, indicating that the reinforcement effect became increasingly evident at higher applied loads.

p–s curves of uncreep geogrid and pure sand cushion. 39
Influence of creep of geogrids on bearing capacity of cushion
The pressure–settlement (P–S) relationships of BG1 and BG2 geogrids, both before and after creep exposure, are illustrated in Figure 11. As shown in Figure 11(a), the P–S trajectories for the creep-affected and non-creep BG1 geogrids are nearly identical when the applied pressure is below 175 kPa. Beyond this threshold, the curves diverge, indicating that, at equivalent stress levels, the vertical deformation ratio in the creep-reinforced sand cushion increases relative to its non-creep counterpart. This suggests that creep deformation reduces the compressive stiffness of the reinforcement under higher loading conditions. However, the overall reduction in bearing capacity remains limited. The influence of creep becomes more pronounced only as the system approaches its ultimate load-bearing capacity, indicating that the geogrid's time-dependent deformation characteristics begin to dominate the structural behavior in this regime.

p–s curve of reinforced sand cushion before and after creep: (a) BG1; (b) BG2.
In contrast, BG2 geogrids exhibit a similar trend but with a higher creep threshold, as shown in Figure 11(b). For BG2, the critical load beyond which creep-induced divergence occurs is approximately 275 kPa—significantly greater than that observed for BG1. This discrepancy can be attributed to the superior tensile strength of the BG2 material, which provides greater resistance to time-dependent deformation under sustained loading. The higher threshold suggests that BG2 geogrids maintain structural integrity for a longer duration under comparable stress conditions, thereby enhancing the stability of reinforced soil systems. Consequently, geogrids with higher tensile capacities (e.g., BG2) exhibit reduced sensitivity to creep effects compared to those with lower tensile strengths (e.g., BG1), particularly during the early stages of loading.
To systematically assess the reinforcement efficiency of different geogrid types under varying mechanical conditions, the ultimate bearing capacities (UBC) and their corresponding bearing capacity ratios (BCR) are summarized in Table 4. The comparison reveals a consistent trend, where geogrid-reinforced sand cushions exhibit significantly higher bearing capacities than their unreinforced counterparts. The improvement in load-bearing performance is quantified by BCR values ranging from 1.22 to 1.56, indicating a clear enhancement in structural stability due to the inclusion of geogrid materials.
BCR of geogrid reinforced sand.

Specifically, the control group (Group 1), consisting of an unreinforced sand cushion, demonstrates a baseline ultimate bearing capacity of 225 kPa. When BG1-type geogrids are integrated without prior creep exposure (Group 2), the UBC increases to 275 kPa, representing a 22% improvement (BCR = 1.22). Interestingly, the application of a 40% UTS creep treatment to the BG1 geogrid (Group 3) results in an identical UBC of 275 kPa, indicating that the creep history at this stress level has a negligible effect on the short-term bearing capacity performance of BG1 under the tested conditions.
In contrast, the performance of the BG2 geogrid demonstrates significantly higher reinforcement efficacy. Without creep exposure (Group 4), BG2 achieves a UBC of 350 kPa, representing a 56% improvement over the control condition (BCR = 1.56). However, when subjected to 40% UTS creep (Group 5), a slight reduction in capacity is observed, with the UBC decreasing to 325 kPa (BCR = 1.44). This suggests that while BG2 offers superior reinforcement even after undergoing creep, its strength degradation due to sustained loading is more noticeable compared to BG1.
Overall, these findings highlight the critical influence of both geogrid type and loading history on the mechanical response of reinforced soil systems. High-tensile-strength geogrids, such as BG2, not only raise the load-bearing threshold of sand cushions but also maintain relatively robust performance after creep-induced preloading, although with some marginal reductions in ultimate strength.
Influence of geogrid creep on earth pressure in reinforced foundation
The effect of creep on the earth pressure distribution of BG1 geogrid-reinforced soil is shown in Figure 12. In Figure 12(a), when p = 125 kPa and z = 100 mm, the earth pressure distribution is similar to that of the pure sand cushion, exhibiting a parabolic shape with the maximum pressure at the center, decreasing on both sides. The earth pressure at 100 mm below the center of the BG1 geogrid-reinforced cushion after 40% UTS creep is 11% higher than that of the non-creep BG1-reinforced cushion and 11% higher than that of the pure sand cushion. In Figure 12(b), when p = 125 kPa and z = 300 mm, the earth pressure at the center of the 40% UTS creep-reinforced BG1 cushion is nearly identical to that of the pure sand cushion. The earth pressure at the center of the foundation is slightly greater than that of the pure sand cushion but less than that of the non-creep BG1, with a distribution pattern similar to that of the pure sand cushion. In Figure 12(c), when p = 125 kPa and z = 500 mm, the earth pressure distribution of the 40% UTS creep-reinforced BG1 cushion shows a large central pressure, gradually decreasing with a step-like distribution on both sides. The center pressure is nearly the same as that of the pure sand and non-creep BG1 cushions, while the earth pressure at points far from the center is slightly lower than that of the non-creep BG1 and slightly higher than that of the pure sand cushion.

Effect of creep on earth pressure of BG1 geogrid reinforced cushion: (a) z = 100 mm, p = 125 kPa; (b) z = 300 mm, p = 125 kPa; (c) z = 500 mm, p = 125 kPa.
The effect of creep on the earth pressure distribution of BG2 geogrid-reinforced soil is shown in Figure 13. In Figure 13(a), when p = 125 kPa and z = 100 mm, the earth pressure distribution pattern of the 40% UTS creep-reinforced BG2 cushion is similar to that of the pure sand cushion, exhibiting a parabolic distribution with the maximum pressure at the center, decreasing on both sides. The earth pressure at 100 mm below the center of the 40% UTS creep-reinforced BG2 cushion is higher than that of the non-creep reinforced BG2 cushion, while the earth pressure of the pure sand cushion decreases by 27.5%. In Figure 13(b), when p = 125 kPa and z = 300 mm, the earth pressure at the center of the 40% UTS creep-reinforced BG2 cushion decreases by 25% compared with that of the pure sand cushion, but increases by 31% compared with that of the non-creep reinforced BG2 cushion. The earth pressure distribution at the center of the foundation takes a more pronounced gentle stepped form. In Figure 13(c), when p = 125 kPa and z = 500 mm, the earth pressure distribution of the 40% UTS creep-reinforced BG2 cushion shows a large central pressure, gradually decreasing on both sides with a gentle step-like distribution. The earth pressure far from the center is slightly lower than that of the non-creep BG2.

Effect of creep on earth pressure of BG2 geogrid reinforced cushion: (a) z = 100 mm, p = 125 kPa; (b) z = 300 mm, p = 125 kPa; (c) z = 500 mm, p = 125 kPa.
Influence of geogrid reinforcement and creep on modulus
A geogrid-reinforced cushion laid along the horizontal direction exhibits a higher tensile modulus and greater tensile strength compared to the geogrid-soil composite cushion. This enables it to better bear the load from the foundation. The geogrid, by providing a lateral restriction effect on the soil, effectively facilitates stress diffusion, thereby improving the modulus of the composite foundation. The deformation modulus (E) and compression modulus (Es) can be calculated using formula (8) and formula (9), based on the load–settlement curve of the foundation.

where
In this test, the sand cushion was compacted simply, resulting in significant initial deformation. As a result, the calculated foundation modulus and cushion modulus were relatively low. Additionally, the size of the load plate also affected the modulus values. To eliminate the influence of these factors on the modulus values, the modulus ratio of the foundation (FMR) is used. This ratio, which compares the deformation modulus or compression modulus of the reinforced foundation to that of the pure sand cushion foundation, reflects the increase in the modulus of the reinforced foundation.
From Table 5, it can be observed that the compressive modulus of reinforced soil is significantly higher than that of unreinforced soil. The compressive modulus of unreinforced BG1 geogrid-reinforced soil is 43% higher than that of the pure sand cushion, while the compressive modulus of unreinforced BG2 geogrid-reinforced soil is 50% higher than that of the pure sand cushion. Compared with the pure sand cushion, the compressive modulus of the reinforced soil with BG1 creep 40% UTS geogrid is 1.41 times that of the pure sand cushion, and the compressive modulus with BG2 creep 40% UTS geogrid is 1.44 times that of the pure sand cushion.
Foundation module ratio.

According to the principle of stress diffusion, the stress diffusion angle of reinforced cushion is calculated according to formula (10) and formula (11).

where,
The calculated stress diffusive angles of the reinforced cushion are presented in Table 6. All five test groups exhibit that the stress diffusive angles (SDA) exceed 29°. Compared with the pure sand cushion, the reinforced cushion shows a greater stress diffusive angle. The stress diffusion ratio (SDR), defined as the ratio of the stress diffusive angle of the reinforced cushion to that of the pure sand cushion, is used to characterize the effect of reinforcement on stress diffusion. The stress diffusion ratio under creep conditions (SDRC) is defined as the ratio of the stress diffusive angle after creep to that before creep, indicating a reduction in stress diffusive angle due to creep in reinforced cushions.
Stress diffusion angle.
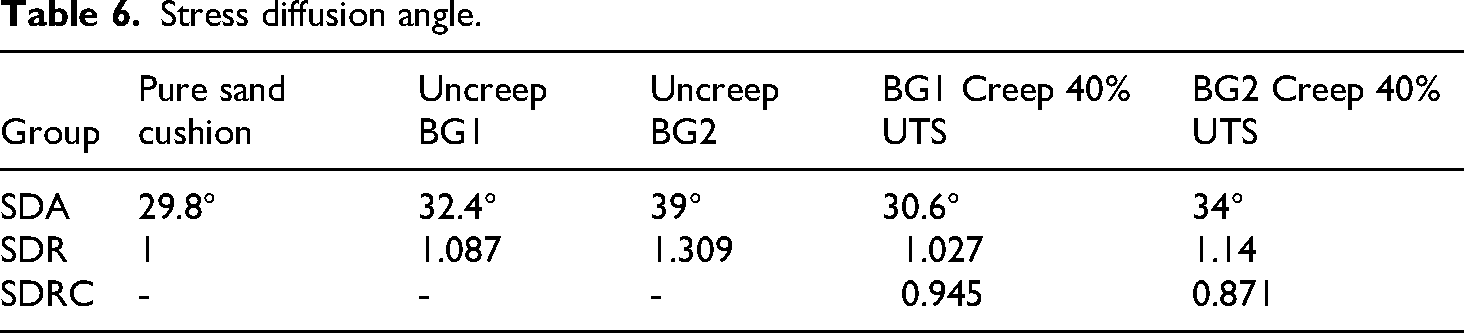
As shown in Table 6, the stress diffusion angle ratio of the non-creep reinforced BG1 cushion is 1.087, representing an 8.7% increase compared with that of the pure sand cushion. For BG2, the ratio is 1.309, corresponding to a 30.9% increase. These results indicate that the geogrid reinforcement enhances the stress diffusion angle, with greater improvements observed in reinforced cushions utilizing geogrids with higher initial tensile strength.
The stress diffusion angle of the reinforced cushion with BG1 creep 40% UTS geogrid is 1.027, which is 2.7% higher than that of the pure sand cushion. The stress diffusion angle of the reinforced cushion with BG1 creep 40% UTS geogrid is 0.945, which is 5.5% lower than that of the non-creep BG1 geogrid reinforced cushion. The stress diffusion angle of the reinforced cushion with BG2 creep 40% UTS geogrid is 1.14, representing a 14% increase compared with that of the pure sand cushion. The stress diffusion angle of the reinforced cushion with BG1 creep 40% UTS geogrid is 0.871, which is 12.9% lower than that of the non-creep reinforced cushion.
Therefore, geogrid reinforcement enhances the stress diffusion angle, with cushions reinforced by geogrids of higher initial tensile strength showing a more significant increase in the stress diffusion angle. However, the creep effect of geogrids reduces the stress diffusion angle of the reinforced cushions, and the reduction is more pronounced in geogrids with higher initial tensile strength under creep conditions.
Analysis of creep mechanism
Geogrids are composite materials made from various types of polymeric fibers, commonly used to enhance the shear strength of soil in reinforced soil foundations. The surface characteristics of the polypropylene fibers in the geogrids were analyzed using a scanning electron microscope (Hitachi TM-1000 Table Top SEM). The fibers were examined both before and after creep testing to visually assess and quantify the damage induced by creep. The analysis was conducted on geogrids subjected to no creep and geogrids that underwent 1000 hours of creep testing under a 40% load level.
Figure 14 presents two SEM images of the polypropylene fibers from the node of BG2. In Figure 14(a), the SEM image shows that the surface of the geogrid without creep is relatively smooth and free of cracks. In contrast, the surface of the BG2 sample after 40% UTS creep, shown in Figure 14(b), displays micro-cracks (approximately 80 microns wide) distributed across the entire surface of the node.

SEM images of BG2 fibers in the node before and after the creep procedure: (a) initial state of geogrid; (b) creep 40%UTS.
It can be observed that, in the initial state before creep (shown in Figure 15(a)), the bituminous coating was uniformly distributed. However, after the creep procedure (shown in Figure 15(b)), it is evident that some of the geogrid fibers have been damaged, exhibiting physical damage and changes in surface morphology, such as broken fibers and loss of the bituminous coating. This damage during the creep process indicates a change in the mechanical properties of the fibers.

SEM images of BG2 fibers in the longitudinal ribs before and after the creep procedure: (a) initial state of geogrid; (b) creep 40%UTS.
During the creep test, the geogrids were subjected to tensile stress, resulting in the formation of micro-cracks at the defects or weak points of the geogrids. These microcracks were oriented perpendicular to the direction of the principal stress and exhibited an elongated, strip-like shape with fine groove patterns. The micro-crack width was approximately 10 μm, and the length was around 80 μm. As the tensile stress on the geogrid increased, the development of micro-cracks accelerated.
Conclusion
In this study, a series of creep tests were conducted on biaxial geogrids in the laboratory. Both the creep curves and the isochronous creep curves of these biaxial geogrids were analyzed. The following conclusions can be drawn:
The loading level was a significant factor influencing creep failure. When the loading level was below 60% of the UTS, no creep rupture occurred in the biaxial geogrids. However, creep rupture occurred in the biaxial geogrids when the loading level reached 60% of the UTS. It was demonstrated that individual geogrid fibers exhibited physical damage after the creep procedure, including loss of the bituminous coating and fiber breakage. The generalized Kelvin–Voigt model was shown to accurately predict the creep behavior of the geogrids. When the loading level was below 40% of the UTS, the strain of the geogrids gradually stabilized and remained below 10%. Geogrid reinforcement significantly alters the bearing characteristics of the sand cushion, increasing the bearing capacity, stress diffusion angle, and modulus of the reinforced cushion. The reinforcement effect is more pronounced for geogrids with higher tensile strength. Creep alters the interface characteristics between the geotechnical steel grid and the soil, leading to changes in the bearing properties of the geogrid cushion after creep. The modulus decreases, and the creep resistance of geogrids with higher tensile strength is more pronounced. The reinforcement effect of both creeping and non-creeping geogrid-reinforced cushion layers increases with the load level. At the initial stage of loading, the reinforcement effect is not significant.
Footnotes
Acknowledgments
The authors would like to express their gratitude to the researchers whose work is cited in this paper. Their contributions have provided a valuable foundation for the present study.
Author contribution
Conceptualization, Hui Yuan and Xiaohong Bai; methodology, Xiaohong Bai; software, Hui Yuan; validation, Hui Yuan; investigation, Xiaohong Bai; resources, Hui Yuan and Xiaohong Bai; writing—original draft preparation, Hui Yuan; writing—review and editing, Xiaohong Bai; visualization, Hui Yuan; supervision, Hui Yuan and Xiaohong Bai; project administration, Xiaohong Bai.
Funding
The authors disclosed receipt of the following financial support for the research, authorship, and/or publication of this article: This work was supported by the National Natural Science Foundation of China (grant number 51578359).
Declaration of conflicting interests
The authors declared no potential conflicts of interest with respect to the research, authorship, and/or publication of this article.
Data availability
Some or all data that support the findings of this study are available from the corresponding author upon reasonable request.