
Abstract
As a unique type of flexible slope fill-retaining structure, reinforced soil-retaining walls have the advantages of convenient construction, broad application conditions, good seismic performance, and high economic benefits. In general, reinforced soil-retaining walls appear at corners due to the restriction in topographic conditions during engineering construction. However, their special structures and stress conditions are usually ignored, thus triggering panel bulging, cracking, and collapse. In this study, an experimental method based on fiber Bragg grating (FBG) sensing technology was proposed for a physical model of reinforced soil-retaining walls. Then, a uniformly distributed load experiment was performed on this model by combining the measurement advantages of intelligent wire-type soil pressure sensors and the flexible characteristics of geotechnical reinforcement materials. The deformation development of this reinforced soil-retaining wall was monitored. Results revealed that before and after the loading of the reinforced soil-retaining wall, the deformation was mainly concentrated above the retaining wall, and the deformation scale at the corners was larger than that in the bilateral linear parts. After loading, the largest force deformation area on the retaining wall was transferred from the corners to the load area. The maximum strain was right beneath the load above the retaining wall, and the peak value at the other layers gradually approached the retaining wall. The experimental results prove that FBG sensing technology is feasible and effective for the whole-process monitoring of reinforced soil-retaining walls and is thus worthy of popularization and application.
Introduction
Slope stability is vital to the safety of people's production and life. Domestic (Chinese) slope reinforcement systems have been increasingly perfected; among them, reinforced soil-retaining walls are widely favored by engineering technicians as a type of unique flexible retaining structures and have been extensively applied to highways, railways, ports, and urban constructions.1–3 Reinforced soil-retaining walls develop and evolve intricately, so the stress-strain monitoring of reinforced soil-retaining walls provides timely knowledge of their stability.
Physical models can be scaled down to simulate site engineering and further acquire experimental data and deformation characteristics that are more economical than those obtained by in situ experiments and more real than those acquired by numerical analyses. Therefore, the physical model experiment is one of the important means of scientific research in the geotechnical engineering field. Al-Rkaby A. H. J. et al. and Yazdandoust M. et al. investigated the deformation characteristics of reinforced soil-retaining walls under all kinds of circumstances through a series of model experiments.4,5 Wang and Yang et al. analyzed the displacement and soil pressure distribution laws and stress–strain response characteristics of retaining walls under static and dynamic loads through model experiments.6–8 With the bulging disease at the convex corner of a reinforced soil-retaining wall as an example, 9 Liu et al. conducted corresponding design and checking calculations based on the features of the convex corner area, analyzed the causes of bulging deformation, and provided opinions and suggestions for the design code of corner areas. Yang et al. studied the cross-sectional soil pressure of a green stone cage-reinforced soil-retaining wall through field tests and numerical analyses and obtained largely identical experimental and numerical analysis results of soil pressure. 10 Long and Li et al. theoretically analyzed deformation characteristics of different forms at the corners of a reinforced soil-retaining wall and its stress-strain characteristics through a series of numerical simulations.11–13
Continuously developing in recent years, fiber Bragg grating (FBG) sensing technology, which adopts light as the carrier and optical fiber as the medium and integrates sensing with transmission, has been widely applied to the monitoring of various slope engineering structures due to its high sensitivity, high precision, strong durability, strong anti-jamming capability, and recyclability.14–16 Zhu et al. developed a quasi-distributed optical fiber sensing network based on FBG technology to monitor the strain distribution of soil nails, the underground displacement of slopes, and the strain inside soil mass; they explored the motion change laws of reinforced soil slopes and the strain distribution laws in the passive area and revealed the progressive evolutionary process of reinforced soil slopes. 17 Wu et al. monitored the cracking, seepage, and concrete pouring temperature of a dam project on the basis of the FBG sensing principle and obtained relatively reliable monitoring data. 18 Liu et al. designed an optical fiber sensor package structure applied it to a geogrid reinforced slope, and proved its sensitivity and monitoring feasibility by investigating its force deformation characteristics. 19 Hong et al. and Yashima et al. conducted a corresponding experimental verification in consideration of the interaction mechanism between an FBG sensor and geogrids and verified the stability and accuracy of the FBG sensor in strain measurement on geogrids.20,21
Most of the abovementioned studies have concentrated on model experiments on linear retaining walls and strain monitoring of slopes. Meanwhile, model experiments on reinforced soil-retaining walls through FBG sensing technology and site engineering cases, not to mention investigations on the 3D stress and strain at corners, are rare. In this study, the measurement advantages of soil pressure sensors and dial indicator displacement meters were integrated to propose a uniformly distributed load experiment on a physical model of a reinforced soil-retaining wall based on FBG sensing technology. The aim was to master the deformation and mechanical response characteristics at the corners of the reinforced soil-retaining wall and monitor their development. The force deformation characteristics of the retaining wall under loading action were also monitored and explored. Then, the practicability and effectiveness of FBG sensing technology in monitoring reinforced soil-retaining walls were evaluated. The study results can provide a basis for design research on reinforced soil-retaining walls on the basis of optical fiber sensing technology and serve as a reference for peers in the industry.
Basic principle of FBG sensors
As an optical fiber sensing technology based on the wavelength information of reflected lights, FBG sensing adopts FBGs as sensing units, and the sensing principle is displayed in Figure 1. In this study, FBG strain sensors were designed using the UV light-sensitive characteristics of optical fibers, whose refractive index presents an axially periodic distribution. When transmitted along the fiber core, the light of a specific wavelength is subjected to coupling reflection at FBGs, and such a specific wavelength (i.e. central wavelength) is expressed as follows:


Schematic of the FBG structure.
Existing research results show that the center wavelength of fiber grating is linearly related to strain and temperature, as shown by the following expression:


Eq. (3) shows that the center wavelength of the FBG is simultaneously sensitive to strain and temperature. To eliminate the measuring errors induced by the change of temperature, one FBG temperature sensor for the function of temperature compensation should be arranged near the FBG strain sensor. The FBG temperature sensor's sensing equation can be expressed as follow:

By combining Eqs. (3)and(4),we can obtained:

Profile of the model experiment
Testing apparatus
In this study, a physical model of a concrete block panel-type reinforced soil-retaining wall (Figure 2) was designed and built based on FBG sensing technology. The testing apparatus mainly consisted of the model test chamber, loading system, and testing components and parts (Figure 3). The dimensions of the model test chamber were 3 m (length) × 3 m (width) × 2.3 m (height), and the total filling height of the retaining wall was H = 2 m. The bottom, right side wall, and rear side wall of the test chamber were transversely and longitudinally welded and fixed by a plurality of square steels at an equal spacing, and the upper part was welded and fixed by a plurality of I-beams and the two side walls. The overall stability of the test chamber and the rigidity required by the experiment are guaranteed. During the loading process, there was no deformation outside the side of the retaining wall, and the plane strain condition was guaranteed. Organic glass (10 mm in thickness) was placed inside the side walls to directly observe and record the deformation development of this model. Multiple I-beams on the top to perform two functions: (1) prevent the deformation failure of the side walls during the loading process and (2) serve as the reaction beams of the loading system.

Model testing apparatus.

Schematic diagram of model test of reinforced soil retaining wall (a)Layout plan of the test components and parts (b)Monitoring plane layout.
The loading system included a screw jack, a pressure sensor, a high-precision intelligent display, I-steel reaction beams, and pressure-transmitting plates.The screw jack was placed between the reaction beams and pressure-transmitting plates to apply pressure. The maximum lifting load was 20 T, and the pressure-transmitting plates could prevent deflection during pressurization while transmitting the uniformly distributed load.
Three dial indicator displacement meters were symmetrically arranged at the top of a pressure-transmitting plate in accordance with the model to measure the vertical displacement on the top face. The dial indicators outside the panel were fixed using a self-made bracket outside the model chamber by means of absorption. Moreover, two columns of dial indicator displacement meters were arranged at 0.25 and 1.25 m on one side of the wall surface from the corner line, for a total of 10 ones (Figure 2), to measure the horizontal displacement of the wall surface. A total of 13 dial indicator displacement meters were used.
Test materials
Test soil samples were collected from the foundation pit of a construction site. The fillers were sieved before the indoor geotechnical test, and the measured physical and mechanical parameter indices are listed in Table 1.
Main physical and mechanical indices of fillers.

The retaining wall panels were prefabricated from self-made components by using anti-cracking mortar. The panels were made into five styles in accordance with the retaining wall model characteristics and corner forms. They were overlapped on the left and right in a staggered way by using concave–convex grooves and tongues to ensure that they could exert the maximum resistance. The sensors adopted the FBG strain sensor and FBG temperature sensor produced by Dalian Boruixin Technology Co., Ltd Given the adherence and later-stage force deformation characteristics of FBG sensors, the 250 g/m3 filament woven geotextiles were selected as reinforcement materials in this experiment. Their dimension was set to L = 0.7 m, H = 1.4 m by the standard released by the U.S. Federal Highway Administration. Geotextile is made of high-strength and low-ductility polypropylene high-strength wire as raw material and processed through a special process. It has good overall continuity, lightweight, strong buried resistance, tensile resistance, corrosion resistance, and excellent geotechnical reinforcement performance, which can enhance the tensile strength and non-deformability of soil and the stability of the retaining wall. The test components and parts used in the experiment are presented in Figure 4.

Test components and parts (a) Dial indicator displacement meter (b) Intelligent wire-type soil pressure sensor (c) FBG strain sensor.
Model preparation process
The geotextiles served as the carrier, and the FBG sensors were pasted on the geotextiles by using AB glue to ensure the collaborative deformation of the two and obtain highly accurate data. The geotextiles pasted with strain sensors were buried inside the model to realize multi-scale measurement while improving the survival rate of the sensors and guaranteeing the mutual coordination and synchronous deformation of the optical fibers and the model.
The model was prepared through layered filling and tamping. The compaction tools were reasonably selected and manual compaction was adopted. The loose thickness of each layer was 15 cm, the compaction thickness was 10 cm, and the compactness was not less than 90%. After the layer was filled and compacted, the moisture content and density of the fill were tested, and the compactness was checked by the ring knife method to ensure that the density of each layer of the fill was consistent. In accordance with the experimental scheme, soil pressure sensors were buried at the corresponding position of each layer through the pit-digging method. Specifically, a soil pressure sensor was buried once the filling was completed for 30 cm and protected by placing fine sand around it. Soil pressure data were measured once after zero setting, filling, and tamping for 30 cm. Next, the FBG temperature sensor and a layer of geotextiles pasted with FBG strain sensors were paved to retest the soil pressure and optical fiber data until the whole retaining wall was finished. The retaining wall filling and reinforcement material paving procedures are displayed in Figure 5.

Retaining wall filling and instrument layout (a) Filler tamping (b) Fine sand paving (c) Burying of soil pressure sensors (d) Pasting of FBG strain sensors (e) Testing of FBG strain sensors (f) Calibration and installation of dial indicator displacement meters.
Test loading scheme
After the physical model of the reinforced soil-retaining wall was set up, it was allowed to stand for one week so that the specimen could be fully coupled with optical fibers and geotextiles under the action of geostatic stress. Before formal loading, whether the instruments could operate normally was checked through precompression, and their initial readings before loading were recorded. Then, 10 kPa (6.4 kN) of the uniformly distributed load was applied via the screw jack on the top, and the readings of each test unit were recorded every 1 h. According to the “Specification for Design of Highway Reinforced Soil Engineering” (JTJ 015-91), 23 the scale of the retaining wall model and the existing research experience,8,24 the loading amplitude of each stage was finally determined to be 10 kPa, which was divided into 12 stages of loading step by step, and the load of each stage was increased by 10 kPa until 120 kPa.The reason for choosing to record every 1 h was because under each stage of load, there was a certain process of the retaining wall from the deformation stage to the stable stage. At the same time, the number of test components was large, and it took a certain amount of time to measure the data and observed the changes in the data. The completion of the work could be controlled within 1 h, so chose to record every 1 h. Meanwhile, the deformation of the retaining wall behind the glass was observed. When the measured difference value was 0, the wall body deformed stably. Then, loads of 20, 30, and 120 kPa were successively applied. The pressure-transmitting plates used in the test have a thickness of 20 mm, and a small area with sufficient flexural strength to withstand a force of 120 kPa, and the pressure-transmitting plates could transmit the uniformly distributed load while ensuring that prevent deflection during pressurization. Based on the numerical simulation results11–13 and the existing research experience,8,25 it was believed that the deformation development rate of reinforced soil retaining wall increased exponentially with the increase of load from 20 kPa. When the load was 120 kPa, a small load change would cause a large deformation of the soil due to the continuous accumulation of deformation inside the retaining wall. At the same time, the strength reduction method was used to calculate the stability coefficient of the reinforced soil retaining wall when the load was 120 kPa, which was 1.43. 13 Therefore, the maximum load of 120 kPa can fully reflect the stress and deformation characteristics of the reinforced soil retaining wall.
Analysis of experimental results
Deformation characteristic analysis of the retaining wall
The horizontal displacement of the wall panel showed an overall small growth amplitude due to the geotextile–soil friction. The increment curves of horizontal displacements at different distances from the retaining wall panel to the corner line under loading action are presented in Figure 6. The horizontal displacement of the wall panel was small when the load was lower than 30 kPa, revealing the strong non-deformability of the retaining wall under this circumstance. By comparison, the closer to the corner line, the more obvious the horizontal displacement of the wall surface, that is, the corner part was subjected to deformation failure more than the linear segments were. The distribution curves of the horizontal displacement of the panel along the wall height are displayed in Figure 7. When no load was applied, the whole retaining wall experienced an outward inclination of the top. As the load increased, the retaining wall shifted from the outward inclination of the top to middle-upper bulging deformation, which presented a single-peak distribution along the wall height. Figure 8 displays the vertical settlement–load relation curve chart of the retaining wall under loading action. The settlement of the retaining wall increased with the increase in load. The settlement of the loading area was obvious, the maximum settlement reached 4.3 mm, the parallel wall surfaces were distant from the corner line, and the vertical wall surfaces penetrated the retaining wall, both of which experienced a reduction in vertical deformation.

Change laws of horizontal displacements at different positions on the retaining wall (a) Increment in horizontal displacement at 0.25 m from the corner line (b) Increment in horizontal displacement at 1.5 from the corner line.
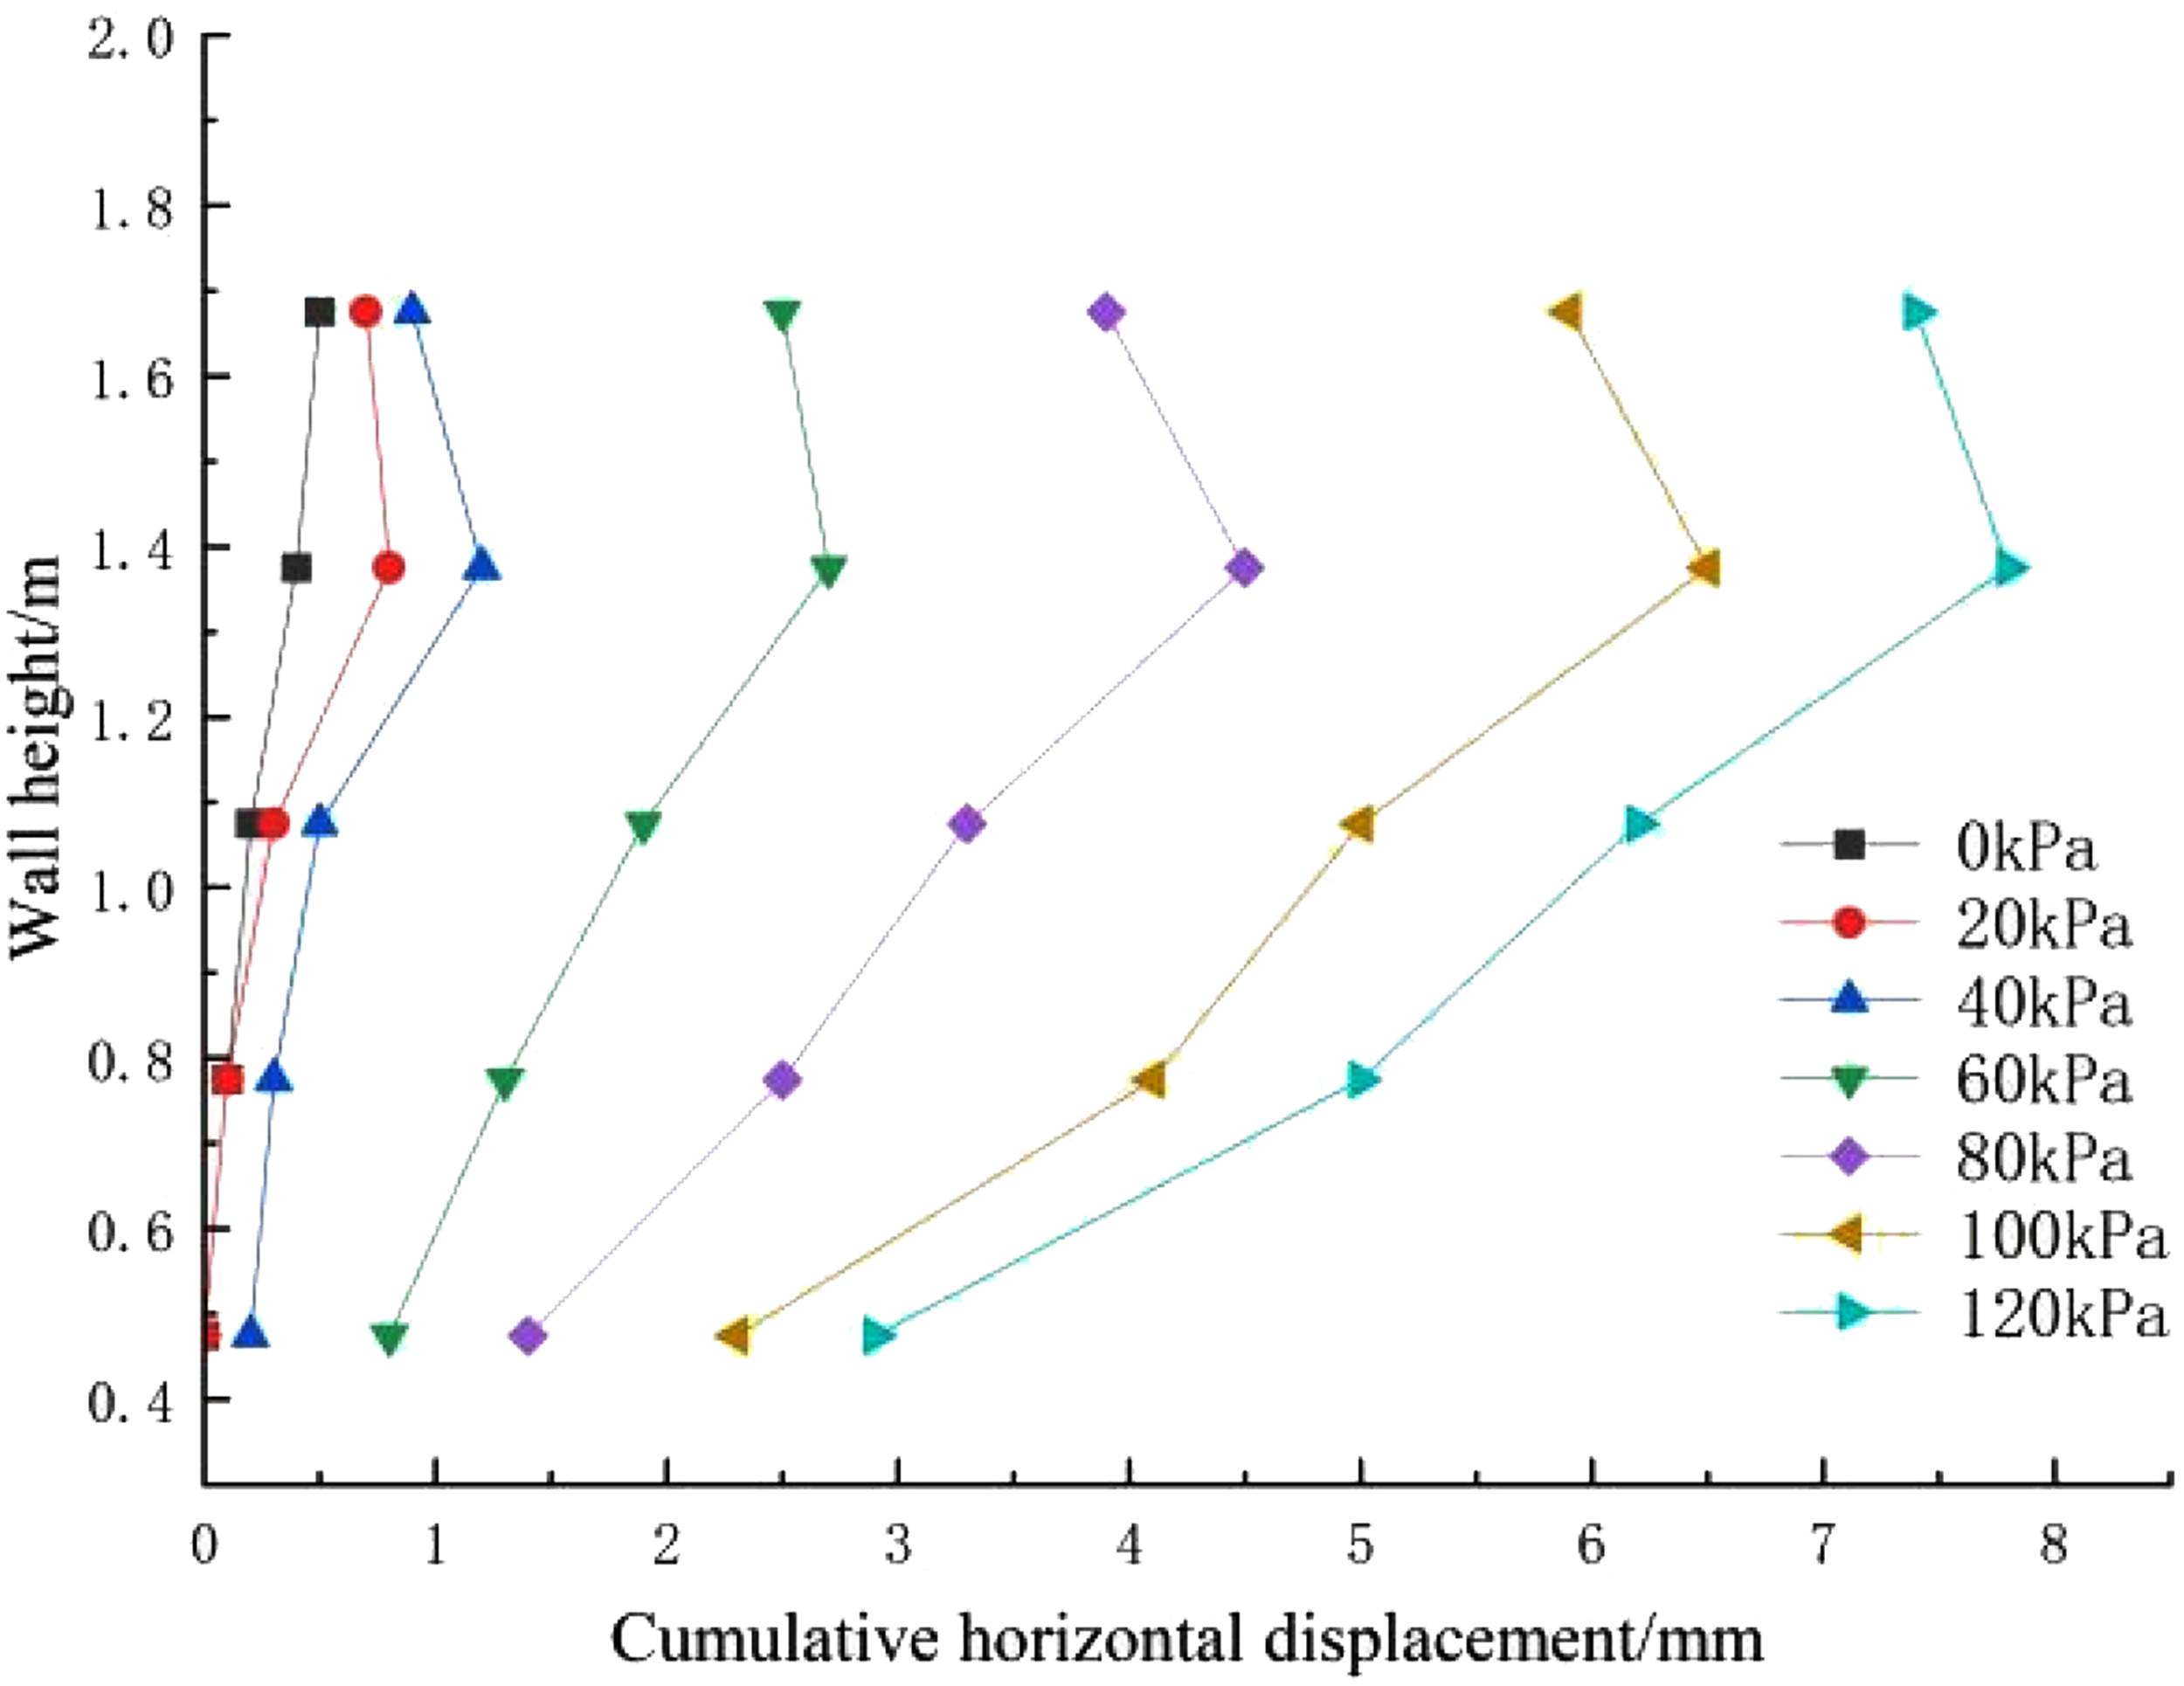
Distribution curves of horizontal displacement along the height of the retaining wall.

Distribution of the vertical settlement of the retaining wall with load.
Analysis of soil pressure results
Soil pressure sensors were arranged at one side of the retaining wall in accordance with the symmetry property of the model. The specific layout in the horizontal direction of each layer is shown in Figure 9. A total of five layers of soil pressure sensors were arranged at heights of 0.25, 0.85, 1.15, 1.45, and 1.75 m. The bottom layer was set at a distance of 0.6 m, the main reason was that combined with the deformation characteristics of the numerical simulation of reinforced soil retaining walls11–13 and its related conclusions, considering that the number of soil pressure sensors on the upper four layers was large, and they were arranged at equal intervals with the FBG sensors, the density was large, and the force and deformation characteristics of the middle and upper parts of the retaining wall could be reflected in real-time. In addition, considering the uncertainty of the pressure change at the base of the retaining wall, by measuring the base soil pressure and comparing it with the value of the middle and upper part of the retaining wall, the change law of the overall soil pressure of the reinforced soil retaining wall can be obtained. Therefore, the bottom layer of the soil pressure sensor was adjusted from 0.3 m to 0.6 m. At the first, third, and fifth layers, two additional soil pressure sensors were arranged at X-3-1 and X-5-1, and a total of 18 ones were arranged at each layer to verify the symmetric changes in soil pressure in the model. The second and fourth layers were arranged with 16 pressure sensors each. Therefore, a total of 86 soil pressure sensors were arranged. Afterward, soil pressure data were acquired and monitored using a comprehensive tester (JMZX-3001L) in the filling and loading phases.

Layout plan of the soil pressure sensors.
Soil pressure in the filling phase
The vertical soil pressure value at each layer of the retaining wall increased because the overlying soil was thickened in the filling phase. The changes in vertical soil pressure in the cross-section of the corner bisector of the retaining wall are given in Figure 10. The vertical soil pressure at each layer of the retaining wall at positions close to the wall surface, namely, the corner (X-1-1), was always considerably greater than that at the other positions of the same layer; meanwhile, those in the other parts were equal. In addition, the soil pressure in the unreinforced area (X-5-2) inside the retaining wall distant from the wall panel increased slightly because this position (i.e. unreinforced area) was free from the stress diffusion of the reinforcement materials and the load reduction effect of “net bag,” resulting in a slightly high soil pressure value. This result indicates that the geotextiles in the reinforcement area exerted a favorable diffusion effect on the vertical soil pressure.

Change curves of vertical soil pressure on the corner bisector.
Soil pressure in the loading phase
The changes in soil pressure values at different layers under different load conditions in the loading phase are presented in Figure 11. Figure 11(a) indicates that the soil pressures at the different layers exhibited largely identical variation trends. The soil pressure at high parts above the retaining wall increased significantly, and the increased amplitude was at the maximum at the top-layer measuring point 0.9 m from the wall surface because it was the closest to the loading system. However, the vertical soil pressure at the lower layers increased slowly with a minor variation in amplitude, and due to the load, the largest force deformation area of the retaining wall rapidly shifted from the corner part to the loading position (beneath the pressure-transmitting plate), the soil pressure in the loading area increased obviously, and the diffusion of soil pressure at each layer all around the loading area was reduced. This variation trend became increasingly prominent with the increase in wall height.

Change curves of vertical soil pressure in the loading phase (a) Change curves of vertical soil pressure on the corner bisector (b) Soil pressure development law curves.
The soil pressure values in different parts of the retaining wall were determined and analyzed to plot their development and distribution curves (Figure 11(b)). The soil pressure beneath the loading area changed with the maximum increase in amplitude within the range, and it presented a linear growth trend with the increase in the external load. The vertical soil pressure in the upper part of the retaining wall was influenced greatly by the load, and the difference value before and after loading was relatively large. In the middle–lower part of the retaining wall, the initial soil pressure value was high due to the numerous overlying soil masses. However, the difference value in soil pressure in this part before and after loading was relatively small. The reason is as follows: the geotextiles serving as reinforcement materials improved the stress field of the soil mass inside the retaining wall, and as a result, the vertical soil pressure in the middle–lower part of the retaining wall was evenly dispersed.
Strain characteristics of reinforcement materials and sliding surface characteristics of the retaining wall
The development and evolution trends inside the retaining wall can be revealed by the strain data of reinforcement materials. In this study, FBG strain sensors were arranged at one side of the retaining wall following the symmetry property of the retaining wall model, and the FBG temperature sensors for the function of temperature compensation were arranged near the FBG strain sensor. The concrete sensor layout at each layer is displayed in Figure 12. The FBG sensors were paved layer by layer in a staggered way with the soil pressure sensors at heights of 0.4, 0.7, 1.0, 1.3, and 1.6 m. During the test, the ambient temperature was relatively stable, and the corresponding temperature fluctuation was obtained through the measurement and calculation of the FBG temperature sensors (Figure 13(a)). The strain of the FBG strain sensor with a wall height of 1.6 m under the influence of temperature was shown in Figure 13(b). By performing temperature compensation on the influence of temperature in the strain test, the strain of the FBG sensor without the temperature effect was obtained, as shown in Figure 13(c), the strain of other heights of the retaining wall was obtained by the same method, as shown in Figure 13(d–g). At the layer of 1.6 m high, the geotextile at the rear edge of the loading area develops relatively great strains because it undertakes relatively large vertical loads. This point shall be the rear edge position of the potential rupture plane. The maximum strain on the geotextile at 1.3 m of wall height is at the middle area which is 0.2 m away from the back of the wall corner line. From the middle to lower areas of the retaining wall, the maximum strain is at the back wall area, which is close to the wall corner line. Some negative strain values were observed in the reinforcement materials because in the initial loading phase, the reinforcement materials shrunk due to the uneven compaction. As can be seen in Figure 13(f), the strain of the reinforcement materials at each layer of the retaining wall initially increased and then decreased, and the peak strains occurred at all layers and showed identical strain laws. The peak strain point of the reinforcement materials within the 0.4–0.7 m range under the retaining wall was near 0.57 m from the wall panel, which coincided with the “0.3 H” method specified in the relevant code. 21 The maximum strain appeared right under the top load of the retaining wall. The peak strains at the other layers were gradually close to the retaining wall, and the maximum strain points of all layers were connected through a smooth curve to largely delineate the position of the potential rupture surface. In addition, the strain of the reinforcement materials under the retaining wall was much smaller than the upper strain because the upper soil mass showed a downward motion trend under the loading action. Consequently, the reinforcement materials at the top were subjected to tensile force, and local strain concentration took place. Meanwhile, the upper load was dispersed around the loading area under the effect of the reinforcement materials, and the strain of the lower reinforcement materials was much smaller. Notably, the peak strain of the reinforcement materials in this experiment was 2.1%, which is far from reaching the yield elongation. The tensile strength of these materials should be explored further in subsequent research.

Layout plan of FBG strain sensors.

Microstrain and strain distribution of geotextile along the length in the 120 kPa period. (a) Temperature fluctuations; (b) Microstrain under the influence of temperature; (c) Wall height 1.6 m; (d) Wall height 1.3 m; (e) Wall height 1.0 m; (f) Wall height 0.7 m; (g) Wall height 0.4 m; (h) Strain curves of reinforcement materials.
The key to the structural design of a reinforced soil-retaining wall lies in determining the potential rupture surface, which is crucial for stability evaluation and analysis. The position of the potential rupture surface of the retaining wall can be accurately determined based on the peak strain of reinforcement materials and the deformation of the retaining wall, which is a unique advantage of FBG sensing technology in comparison with strain gauges.
In this study, after loading was finished, a series of confirmatory tests were performed on the corner part of the retaining wall. The corner part was tossed to 2/3 of the height of the retaining wall, and the geotextiles pasted with FBG sensors were taken out to conduct a pull-out test for verification. Meanwhile, the cracking situation of the soil mass was observed. According to the site conditions, the change laws of soil pressure at the different layers, and the position of the peak strain, the potential rupture surface at the corner part had an arc-like shape on the plane. From a 3D perspective, the rupture surface was a curved-through surface that extended from the upper loading position of the retaining wall to the middle–lower part of the corner line and finally intersected with the bilateral wall surfaces. In addition, this rupture surface, which was similar to a “round-backed armchair”-like sliding surface, was symmetrical around the central axis, namely, the corner line (Figure 14). Moreover, it approximated a logarithmic spiral rupture surface in shape and penetrated deep inside the retaining wall; because the scope of influence was enlarged by the increase in load at the wall top, the area of potential rupture surface was also enlarged. 25

Schematic of the potential rupture surface.
The plane force at the corner part of the reinforced soil-retaining wall was analyzed by considering the special structure and symmetry of the corner part. In Figure 15, X and Y represent the horizontal deformation directions of vertical wall surfaces. The bilateral wall surfaces were subjected to an equal vertical pressure E from the soil mass. When the distance from the corner was large, only the horizontal deformation of the vertical wall surfaces existed. When subjected to the component force from the other side at a close distance from the corner, the soil mass began shifting from unidirectional deformation to bidirectional deformation, and the resultant force was gradually enlarged and reached the maximum value at the corner. The maximum resultant force appeared along the corner bisector. Therefore, the corner part generated a larger displacement compared with the other parts of the retaining wall. At the corner part under the effect of forces in X and Y directions, the potential rupture surface was morphologically manifested as a curve intersecting with the bilateral wall surfaces, which is in line with the abovementioned characteristics of the potential sliding surface of the retaining wall.

Schematic of force analysis.
Conclusions
In this study, a physical model testing method for a reinforced soil-retaining wall based on FBG sensing technology was proposed. The method compensates for the defect of traditional monitoring means, that is, insufficient internal monitoring of retaining walls. The deformation laws and characteristics of the retaining wall at different depths under the effect of uniformly distributed load were obtained. From the model test results, the following conclusions were derived:
Deformation was mainly concentrated at the upper part of the reinforced soil-retaining wall due to the special structural form of the corner part. Before loading, the maximum deformation appeared in the vertex area at the corner part of the retaining wall. After loading, the maximum deformation occurred in the loading area, and the deformation at the corner part was larger than that in the bilateral linear segments. In the filling phase, the soil pressure in the corner part of the retaining wall reached the maximum value, and the soil pressure in the internal unreinforced area was slightly larger than that in the reinforcement area. During the loading phase, the maximum force deformation area was transferred from the corner part to the loading area, and the difference in vertical soil pressure in the upper part of the retaining wall was large, whereas that in the middle–lower part was small. Peak strains occurred in the reinforcement materials at all layers of the retaining wall. The peak strain value increased initially and then decreased as the distance from the wall surface increased. Along the wall height, the peak strain gradually penetrated deep inside the retaining wall and distantly from the wall surface. The top reinforcement materials were subjected to local strain concentration, and the strain of the reinforcement materials in the lower part was small. Following the peak strain of the reinforcement materials and the deformation of the retaining wall, the potential rupture surface was determined to be a curved surface intersecting with the bilateral wall surfaces, and it resembled a “round-backed armchair”-like sliding surface with a shape that approximated that of a logarithmic spiral rupture surface.
This study preliminarily revealed through a model experiment that FBG sensing technology can be used to analyze the force deformation and stability at the corner parts of concrete-block, panel-type, single-stage, reinforced, soil-retaining walls, and it has great research potential and broad application prospects. In reality, however, retaining walls, especially step-like reinforced soil-retaining walls, have diverse forms in terms of corner angle, corner form, and wall height, all of which remain to be investigated comprehensively in the future.
Footnotes
Declaration of conflicting interests
The author(s) declared no potential conflicts of interest with respect to the research, authorship, and/or publication of this article.
Funding
The author(s) disclosed receipt of the following financial support for the research, authorship, and/ or publication of this article: This work was supported by the Science and Technology Department of Shanxi Province(No.202103021224112).
Author biographies
Xupeng Li was born in 1996. His research interests relate to the force and deformation monitoring and model test research of reinforced soil retaining walls.
Jianhui Long was born in 1972.He works as associate Professor at the School of Mining Engineering, Taiyuan University of Technology. His research interests include unsaturated loess mechanics, slope monitoring engineering, reinforced soil retaining wall force monitoring and applied basic research.Presided over and completed more than 10 scientific research projects, authored 1 book, published more than 50 papers, and 5 national patents.
Shiyi Guo was born in 1997.His research interests relate to the survey and design of geological hazards.
Manchun Yang was born in 1969.His research interests relate to the geological hazard survey, design and construction.
Tianxing Zhang was born in 1994.His research interests relate to the buckling failure and deformation mechanism of reinforced earth retaining walls.
Chengji An was born in 1999.His research interests relate to the deformation mechanism and stress stability analysis of reinforced earth retaining walls.
Yuanyuan Pei was born in 1998.Her research interests relate to the theoretical mechanism and numerical simulation analysis of reinforced earth retaining walls.