
Abstract
Objective
Prediagnosis of diseases plays a pivotal role in medical triage. However, only surface-level information is available in this medical service. To achieve the prediagnosis challenge for nontraumatic acute abdomen (NTAA) with limited information, an intelligent framework was proposed.
Methods
This research was conducted using retrospective patients with NTAA data from the Affiliated Hospital of Zunyi Medical University. A machine learning framework, which encompassed a series of combined binary classifiers tailored to various NTAA conditions was developed. Within this framework, disease information was recursively inferred across three tiers: primary categories (I-level), disease subtypes (II-level), and specific diseases (III-level). In model training, the REFCV (Recursive Feature Elimination with Cross-Validation) approach was employed for feature refinement, and five algorithms—Logistic Regression, Deep Neural Networks, Support Vector Machine, Random Forest, and eXtreme Gradient Boosting—were assessed. The data was split into training and testing datasets, with five-fold cross-validation and grid search for model optimization. Performance was evaluated using area under the receiver operating characteristic curve, accuracy, precision, specificity, and sensitivity. The Friedman test and Wilcoxon paired test compared algorithm performance.
Results
I-Level disease identification metrics mostly surpassed 0.90. II-Level classification metrics generally exceeded 0.80. For III-level diseases, models maintained high recognition rates for several common conditions. Logistic regression showed consistent performance comparable to other algorithms.
Conclusion
The framework performed admirably in discerning both primary disease categories and their respective subtypes. The objective of NTAA prediagnosis based solely on superficial information could be realized. Logistic regression proves sufficient for this task, with no significant benefits from more complex algorithms.
Keywords
Introduction
Background
Acute abdomen is a group of abdominal diseases that present sudden abdominal pain lasting for seven days or less and require urgent treatment. It is characterized by rapid onset, frequent changes, rapid development, and severe illness. Nontraumatic acute abdomen (NTAA) constitutes the predominant form of acute abdominal conditions, its onset being attributed to a diverse spectrum of etiologies, including pathologies of the digestive, urinary, and reproductive systems, as well as other systemic disorders. It was reported that the percentage of patients admitted to the emergency department with acute abdominal pain ranges from 5% to 10%,1–3 and this proportion is even higher than 20% among individuals over the age of 65. 4 And these patients are mostly diagnosed with NTAA. In hospitalized pregnant women, NTAA accounts for approximately 1.53% of acute abdominal pain cases. 5
Given the diverse etiologies that can lead to NTAA, patients may exhibit varying locations and types of abdominal pain. Accurate prediagnosis and timely treatment are crucial for such patients, as misdiagnosis can lead to delays in treating underlying conditions.
In the Chinese healthcare system and comparable systems worldwide, patients often seek doctors directly at large hospitals. In this medical setting, the primary goal is to obtain a primary assessment of the disease and provide medical guidance services. An accurate prediagnosis result would assist with the quick and accurate arrangement of medical treatment departments. However, under these circumstances, usually only surface-level information, such as physical signs, symptoms, medical history, and basic patient data is available. And accessing more detailed information like laboratory tests and radiological scans can be challenging and time-consuming. Moreover, medical professionals are often required to make rapid prediagnoses based on their clinical experience, so, there are inevitably many triage errors, missed diagnoses, and misdiagnoses.6–8 Additionally, a large volume of manual medical services also places significant pressure on limited medical staff in disease prediagnoses, further increasing triage errors.
Related works
In the field of intelligent NTAA prediagnosis, predicting the severity of the disease is a mainstream objective. Machine learning algorithms were employed to categorize patients with NTAA into those requiring emergency surgery and those who did not. 9 Furthermore, machine learning techniques had the potential to estimate the emergency severity index (ESI-4) score for NTAA emergencies with precision,10,11 and subsequently patients were referred to the intensive care unit, operation rooms, or general treatment areas according to the ESI-4 score.
However, as noted in the background, disease identification in medical triage is also crucial. Particularly in the Chinese healthcare system and similar systems globally, disease classification information is essential for the appropriate allocation of patients to relevant medical departments.
The specific diagnosis of NTAA diseases directly provides disease classification information. Since last century, research about the computer-aid diagnosis of specific NTAA diseases has been conducted.12–18 In most of these studies, Bayesian probability estimations were used.12–16 It was reported that there was a computer-aided diagnosis accuracy rate of 91.8% for NTAA diseases, 12 but most follow-up studies were unable to replicate this result. 18 In the new century, with the development of artificial intelligence technology, machine learning methods were adopted to diagnosis NTAA diseases based on structured data. For example, the decision tree19–23 and support vector machine23–25 algorithms were tested for computer-aided diagnosis of NTAA diseases. A study implemented a scoring voting system that combined seven intelligent algorithms for the diagnosis of NTAA diseases. 26 Furthermore, a study introduced a novel machine learning algorithm, hierarchical structured models, to conduct the computer-aided diagnosis of NTAA diseases, and the performance of other machine learning algorithms, such as support vector machines, neural networks, K-nearest neighbors, was compared to this algorithm. 27
Although the intelligent diagnosis methods mentioned above could obtain precise disease information, they typically relied on structured data containing detailed clinical information, particularly comprehensive laboratory examination results. However, in triage settings, patient information is often incomplete and only surface-level information is available. In these scenarios, these intelligent diagnosis methods are often impractical.
Nonetheless, it is feasible to conduct a prediagnosis and provide an initial grasp of the diseases before medical triage.
The research objective in this article lies between disease risk assessment and definitive diagnosis. Compared to disease risk assessment research, the aim is to gain deeper clinical disease information. Compared to research focused on accurate diagnosis of specific diseases, the objective is only to obtain an understanding of the disease that can facilitate the allocation of patients to appropriate medical treatment departments.
Materials and methods
Aim
A three-tiered disease information system 28 was adopted, encompassing primary disease categories (I-level), disease subtypes (II-level), and specific diseases (III-level).
In the context of medical guidance, accessing information about disease subtypes at the II-level is sufficient. However, the direct inference of disease subtypes (II-level) presents a challenge due to the vast target space. To address this, a hierarchical prediagnosis strategy was investigated.
Though the main purpose was II-level disease information inference, the identification of III-level diseases was also investigated as probing research, with the discussion scope being limited to only a few representative common diseases.
Data collection
Electronic health records of patients with NTAA in the Affiliated Hospital of Zunyi Medical University were collected. Cases were selected based on the following criteria:
Inclusion criteria: Patients who were at least 18 years old, and experienced acute abdominal pain not related to trauma and lasted for less than 7 days were included.
Exclusion criteria: Patients with incomplete clinical data or who did not receive a definite diagnosis at discharge were excluded.
Table 1 provides detailed information regarding the sample sizes for different diagnoses in included cases. As demonstrated in Table 1, the main disease categories include digestive system diseases, obstetrics and gynecology diseases, and urinary system diseases. Disease subtypes consist of pancreas diseases, intestinal tract diseases, biliary tract diseases, gastric diseases, gynecological diseases, diseases of pregnancy and childbirth, kidney diseases, and ureteral diseases. Specific diseases encompass intestinal obstruction, appendicitis, gastric perforation, gallstones, ectopic pregnancy, and so on. Given that patients may have multiple diseases, the count of III-level cases exceeds that of II-level cases, and the count of II-level cases surpasses that of I-level cases in total. And in Table S1, which is put in the supplemental material, collected surface-level features to diagnosis NTAA diseases are displayed.
Sample sizes for different diagnoses
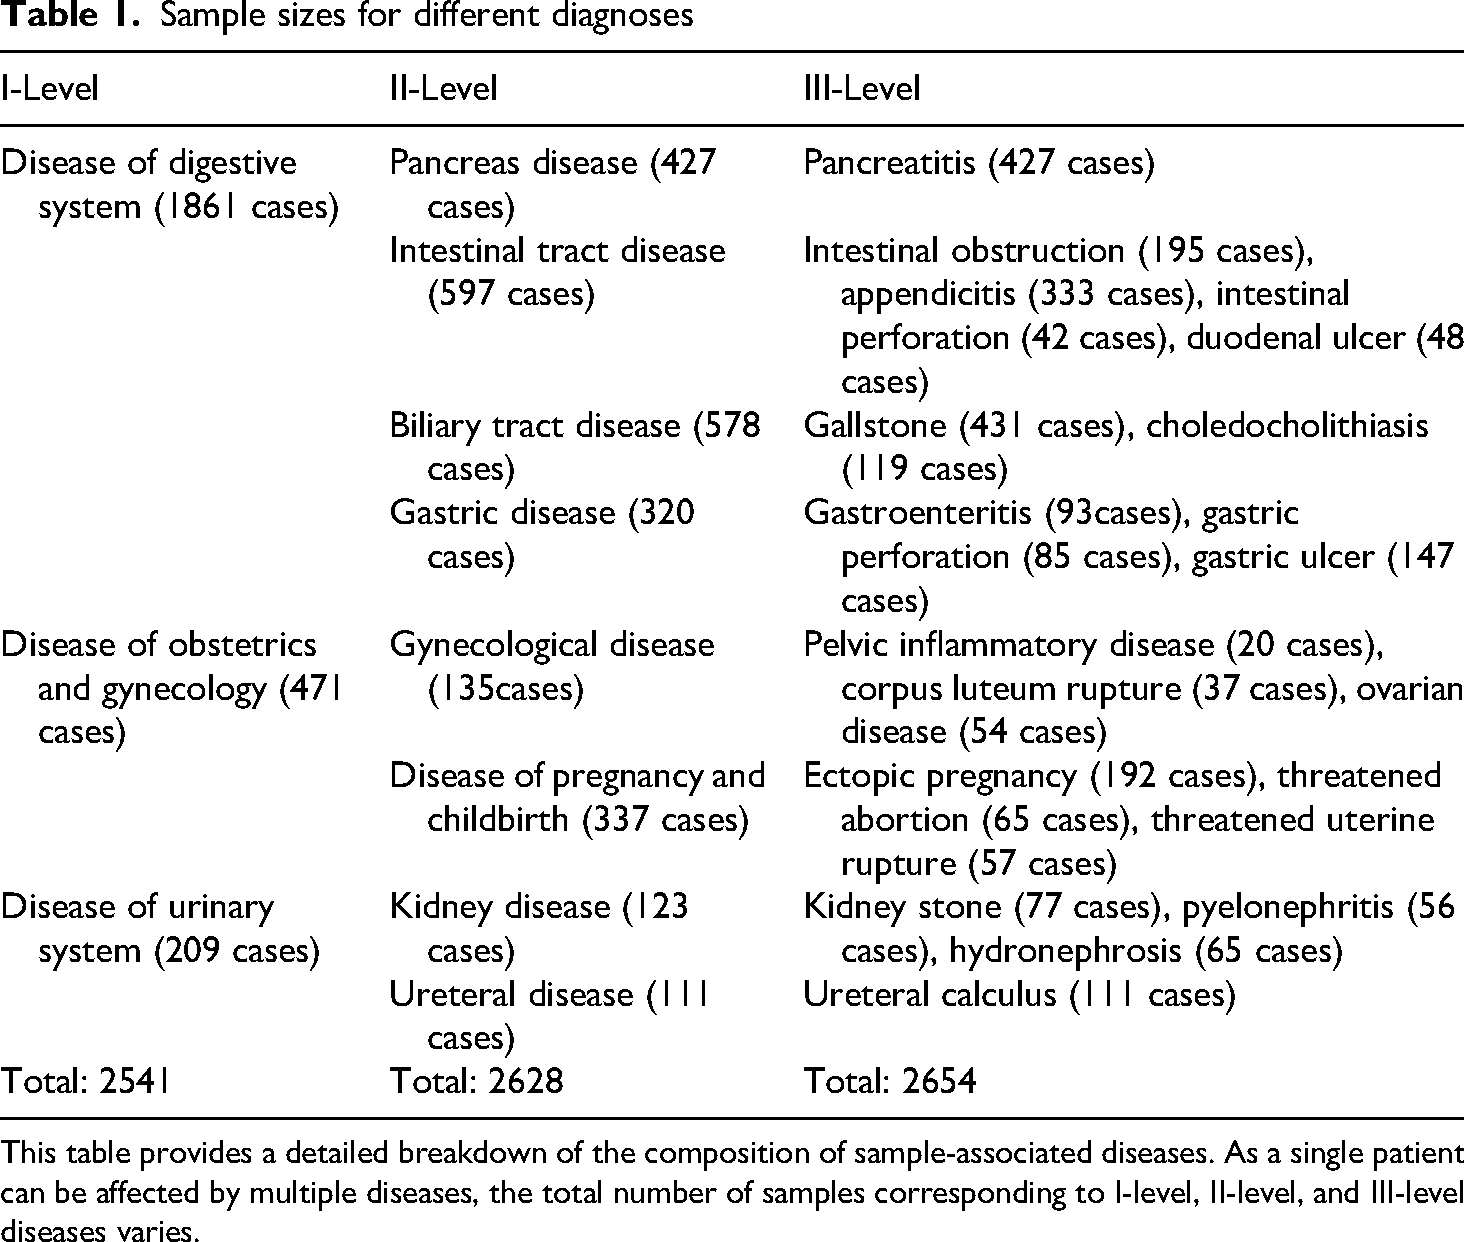
This table provides a detailed breakdown of the composition of sample-associated diseases. As a single patient can be affected by multiple diseases, the total number of samples corresponding to I-level, II-level, and III-level diseases varies.
Data preprocessing
Binary encoding was used to transform binary variables, and multiclass categorical were transformed into one-hot codes.
29
Continuous and ordinal variables were normalized as below:
The prediagnosis framework
Figure 1 displays the proposed machine learning framework. The identification of I-level and II-level diseases was the key points. And the identification of III-level diseases served as a supplementary function solely intended for common diseases. The framework mainly includes components as follows.

The intelligent prediagnosis framework. In this framework, different disease identification models are trained in parallel and independently, while I-level, II-level, and III-level disease information is inferred hierarchically during model utilization.
In alignment with the study diseases, I-level diseases were illnesses of obstetrics and genecology, the digestive system, and the urinary system. As a result, the development of three distinct I-level disease identification models was required. For II-level disease identification, two models were developed to distinguish the gynecological disorders and conditions associated with pregnancy and childbirth, four models were developed to differentiate among the pancreatic, intestinal, biliary, and gastric diseases and two models were developed to distinguish the kidney and ureteral diseases.
Within this framework, the identification of 10 representative common diseases (III-level) was investigated, encompassing intestinal obstruction, appendicitis, gastric perforation, gallstones, ectopic pregnancy, ovarian diseases, rupture of corpus luteum, and pyelonephritis.
Given the large number of initial features collected, feature refinement was essential. The goal was to reduce the input data's dimensionality for model development while retaining informative features relevant to the targeted diseases. To achieve this purpose, the REFCV (Recursive Feature Elimination with Cross-Validation) 30 method was used.
This process could be depicted as below:
To mitigate issues stemming from sample imbalance, an additional “Data partition” step was incorporated into the model development for III-level diseases. The identification model for a III-level disease was developed based on sample data from its parent II-level diseases. And the models for I-level and II-level disease identification were trained on the whole studied samples.
The development of models for identifying I-level, II-level, and III-level diseases was conducted in parallel and independently. Hierarchical prediagnosis was applied during the process of disease identification.
More specifically, five machine learning algorithms, which were LR (Logistic Regression), DNN (Deep Neural Networks), SVM (Support Vector Machine), RF (Random Forest), and XGBoost (Extreme Gradient Boosting) were tested and compared in model development. The aim was to find the optimal base classifier. The machine learning classifiers were developed using the software suite which comprises Python (version 3.8.1) integrated with Scikit-learn (version 1.1.3).
Input features: Surface-level features were extracted from patient's self-reports and simple physical examinations. Deep data, such as detailed physical examinations from expensive professional equipment, laboratory tests and radiological scans were unavailable.
Disease identification module: A hierarchical identification process was designed. The task of the identification model for I-level diseases was to provide an initial classification outcome. Upon obtaining a result for an I-level disease, there were numerous identification models available to further determine the II-level disease within that category. Similarly, if a result for a II-level disease was obtained, there were several identification models accessible to further determine the III-level disease within this disease subtype.
In the disease identification module, “Input alignment” was a step to project the input disease-related features to the input vector of a selected model. Suppose the input feature matrix is 
The recursive traversal approach for hierarchical disease inference is detailed in Table S2 within the supplementary material of this article.
Data flow in model development and validation
Figure 2 shows the data-processing workflow. The dataset was divided into training and testing sets at an 80:20 ratio, ensuring complete separation and consistent class distribution between the two sets. During model training, the five-fold cross-validation was utilized to optimize machine learning classifiers, with grid search employed to fine-tune model parameters. The classifier achieving the highest AUC (area under the receiver operating characteristic curve) during cross-validation was selected as the optimal model for application on the testing dataset. Bootstrap validation was incorporated in the testing phase to evaluate model stability and generalizability.

Classifier training and validation procedure in this study. The methodology depicted in this figure outlines the overall process of classifier development.
For the development of prediction models for level III common diseases, due to the limited number of collected cases, five-fold cross-validation was not employed. However, the remaining processes were identical to those used in the development of models for identifying I-level and II-level disease information.
In the feature refinement process using RFECV, the performance of the feature subset was evaluated based on AUC in experiments, with a cv value set at 5. The base classifier selected in this process was consistent with that used in the subsequent model training procedures.
To assess the overall performance of the prediction models, the initial metrics considered were accuracy and AUC. Precision, specificity, and sensitivity were also evaluated. 31 The specificity and sensitivity values were generated based on the default unbiased threshold of 0.5.
Statistical analysis
Performance metrics were quantified via mean and standard deviation. 32 The Friedman test 33 was employed to assess performance differences of different machine learning algorithms, while the Wilcoxon paired test compared paired metrics across training and testing datasets. Statistical significance was set at a P-value < 0.05.
Results
Table 2 presents the performance of various classifiers in identifying I-level and II-level diseases in the testing dataset. Additionally, to assess model performance during training and evaluate their generalization ability, the performance metrics during the five-fold cross-validation in the training dataset are provided in Table S3 in the supplemental material.
Performance in the identification of I-level and II-level diseases in the testing dataset.

The results in italics are obtained using LR.
AUC: Area Under the Receiver Operating Characteristic Curve; DNN: Deep Neural Networks; LR: Logistic Regression; RF: Random Forest; SVM: Support Vector Machine; XGBoost: Extreme Gradient Boosting.
Table 2 shows that the classifiers perform exceptionally well in identifying I-level diseases, with most metrics exceeding 0.93. For II-level diseases, AUC values are generally above 0.90, except for ureteral disease, where they range from 0.72 to 0.78. Other metrics for gastric and ureteral disease identification occasionally fall below 0.70. Despite these isolated instances, most metrics remain above 0.80, ensuring a commendable overall performance.
The primary objective of this intelligent classification framework was to identify I-level and II-level diseases. Table 3 presents the results of the Friedman test, comparing the performance metrics of various machine learning algorithms in Table 2. Additionally, Figure 3 illustrates the average metric values of different identification models for I-level and II-level diseases.
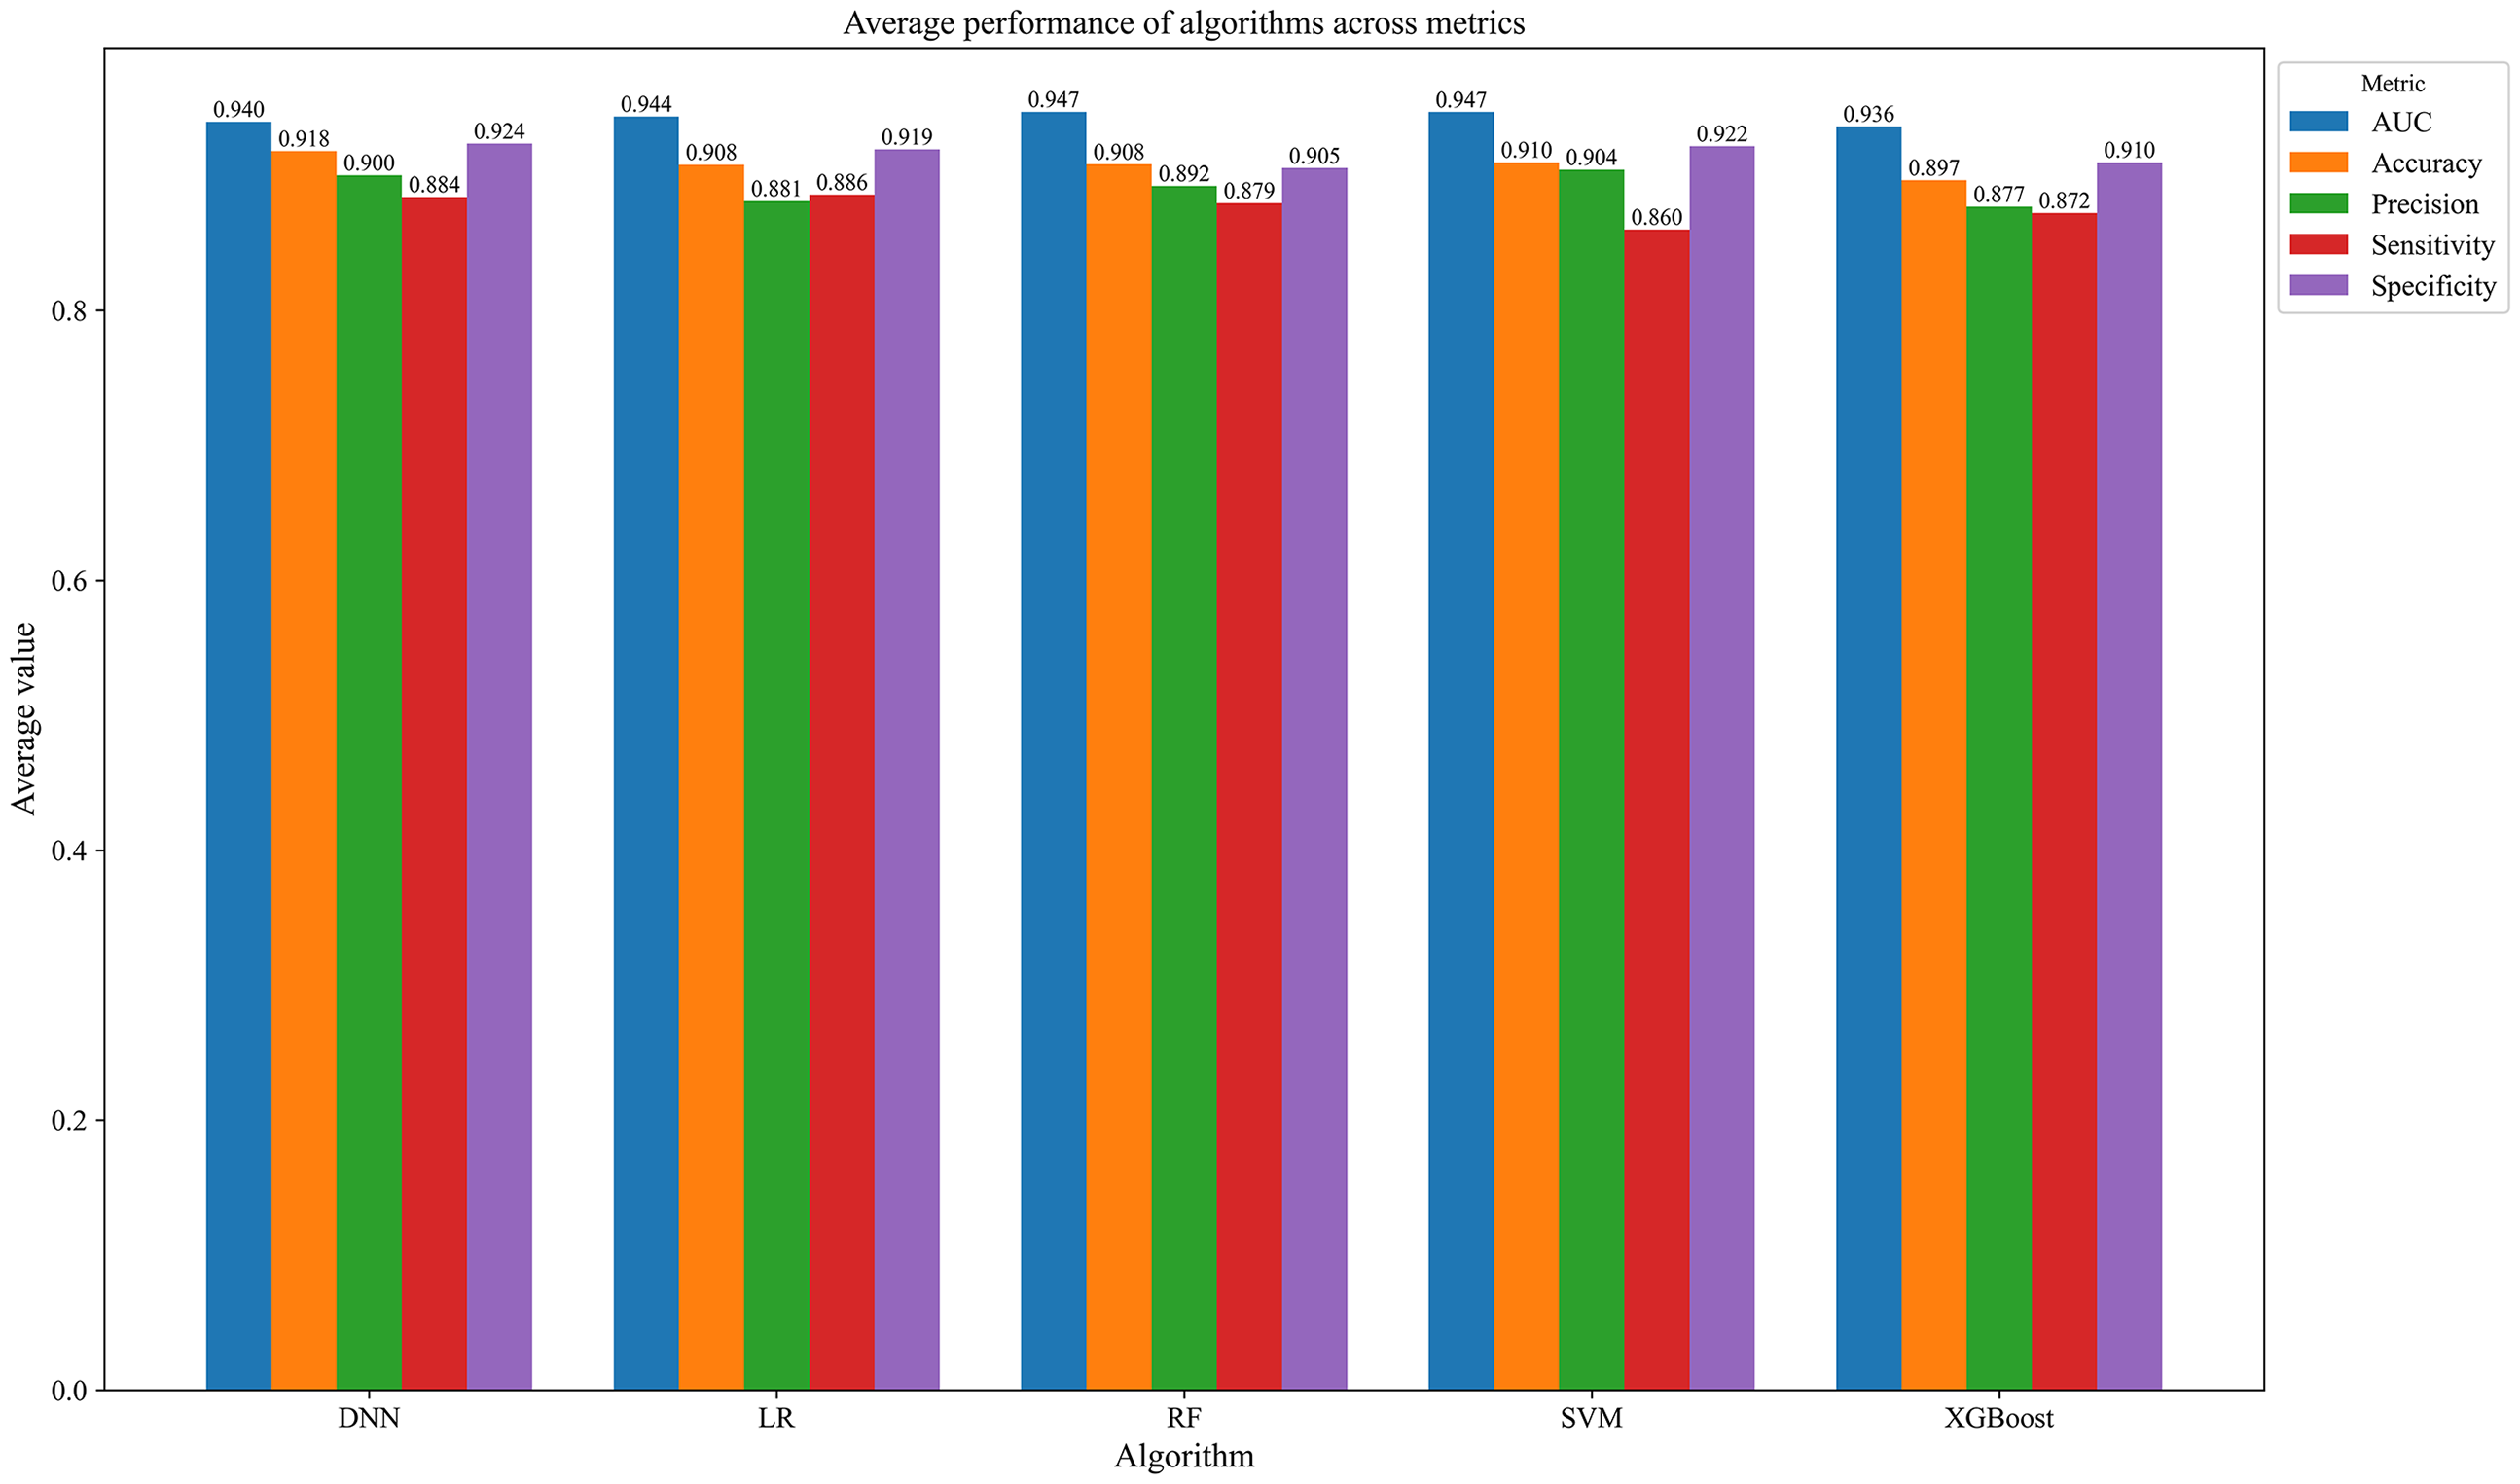
Performance comparation of different machine learning models. This figure showcases the comparative performance of various machine learning models across different disease identification tasks.
Performance comparison in statistical tests across metrics.

This table presents the results of statistical comparisons, including the evaluation of different machine learning algorithms for the identification of different diseases using the Friedman test, as well as the performance comparison of LR models across training and testing datasets. A P-value < 0.05 was considered statistically significant.
AUC: Area Under the Receiver Operating Characteristic Curve; LR: Logistic Regression.
Table 3 indicates that there were no significant differences in performance among different machine learning algorithms, as all P-values exceeded 0.05 across the observed metrics. Figure 3 also demonstrates comparable performance among these machine learning models.
Although LR was not the top-performing model, it exhibited consistent and reliable performance. Its interpretability is notably superior to that of other classifiers, particularly black-box models. The Wilcoxon paired test results in Table 3 indicates no significant differences (P > 0.05) between the LR models’ performance on the training and testing datasets. This implies the LR models had strong generalization capability. Therefore, LR's stability and interpretability render it an ideal base classifier for the proposed framework.
Additionally, Supplemental Tables S4 and S5 detail the feature selection outcomes for identifying I-level and II-level diseases using the REFCV approach with LR in model development. Since the variables were normalized according to formula (1), feature importance was assessed using the regression coefficients from the LR models fitted to the training datasets. The top 20 features with the highest absolute coefficient values for identifying II-level diseases are presented in Figures S1 to S8 in the supplemental material.
LR coefficients reflect the influence of independent variables on the log-odds of the dependent variable. Positive coefficients signify positive correlations, while negative coefficients indicate negative correlations.
Table 4 presents the results for III-level disease identification, which served as an exploratory function. The results indicate a decline in the performance of machine learning algorithms in pinpointing these diseases, with certain performance metrics dipping below 0.50 in some instances. Nonetheless, the models maintain a commendable level of performance for several common diseases. For example, in diagnosing intestinal obstruction, appendicitis, and gastric perforation, most metrics are above 0.90.
Performance of the identification of III-level diseases.

This table lists the numerical performance of different machine learning algorithms in the identification of different III-level disease. These experiment cases are just some attempts. The results in italics are obtained using LR.
AUC: Area Under the Receiver Operating Characteristic Curve; DNN: Deep Neural Networks; LR: Logistic Regression; RF: Random Forest; SVM: Support Vector Machine; XGBoost: Extreme Gradient Boosting.
Discussion
Previous research has established the effectiveness of utilizing machine learning for the computer-aid diagnosis of nontraumatic acute abdomen with structured data.19–27 This article provides further evidence to underscore the ability of machine learning in gaining a certain depth understanding of a variety of NTAA diseases, even when working with limited surface-level information.
The identification of I-level diseases demonstrated exceptional performance, which is intuitively expected given that I-level disease information is inherently more superficial and readily identifiable. The commendable performance was further extended to the recognition of II-level diseases, suggesting the potential of the proposed framework in extracting disease information at a more profound level.
As inferred from Supplemental Table S5, most II-level diseases possess their own significant symptoms. A notable exception was observed in kidney and ureteral diseases, which had far fewer significant features. This may suggest that precise diagnoses of II-level diseases in urinary system require more extensive laboratory examinations.
Without the support of detailed pathological examinations, the diagnosis of specific diseases is prone to errors; hence the attempt in this study was to diagnose some common diseases. In Table 4, the findings reveal that in certain instances, such as the detection of intestinal obstruction and appendicitis, high-accuracy diagnoses were achieved even without the aid of detailed laboratory tests. But, for the identification of III-level diseases, this study only presented localized solution outcomes, with the study samples confined to II-level parent diseases. Whether these diseases can be accurately diagnosed solely based on surface-level information warrants further investigation within a broader context.
Selecting LR as the benchmark classifier may not guarantee optimal performance across all scenarios, yet it offered the advantage of stability and superior interpretability when compared to other algorithms.
For different classifiers, the importance of features was generally not consistent, so the feature regiment processing in our study was intricately linked to diverse classifiers, and the REFCV method was adopted.
The features shown in Supplemental Tables S4 and S5 were notable for their discriminative power in distinguishing between diseases. And the coefficients in Supplemental Figures S1 to S8 indicate the roles of features in disease prediagnosis. A feature with a negative coefficient predicted a higher likelihood of a negative outcome. For example, in the identification of intestinal disease, pancreatic disease history was a significant feature, meaning that if a patient with NTAA has a pancreatic disease history, there is a high probability that the NTAA disease is not the intestinal disease. Further causal analysis is needed to explore the deeper correlations between these features and the target diseases.
It is noteworthy that although Supplemental Tables S4 and S5 list numerous features, only a few questions are required to cover these features during consultations in practice. Moreover, current natural language processing technology 34 can efficiently and intelligently extract these features.
This study specified the location of pain based on the anatomical structure of the human abdomen and detailed the types and nature of pain. These improvements enhanced the diagnostic accuracy of II-level diseases to some extent.
This was a preliminary study, and as such, several limitations were present. Firstly, the study was conducted in a single medical center and the study data was limited to the local population, thereby restricting its generalizability. Secondly, the sample size was limited, particularly in the identification of III-level diseases. Thirdly, only features assisting in disease differentiation were listed, the feature attributes requiring further investigation. Fourthly, NTAA can stem from a multitude of I-level diseases. This study focuses on common situations covering digestive system disorders, urinary system ailments, and diseases of obstetrics and gynecology. So, the trained models cannot be directly applied to other different settings. Nevertheless, the proposed framework and methods are generalizable to alternative medical contexts and hold the potential to achieve comparable outcomes.
This study's most notable contribution was showing that NTAA prediagnosis is possible using only superficial information through the proposed framework and methods. And the proposed framework can also be used in conjunction with the medical triage system predicting the severity of diseases, simultaneously achieving precise medical departmental allocation and patient priority scheduling.
Conclusions
This study presented a machine learning framework designed to prediagnose NTAA diseases using only surface-level patient information. The results showed that the framework, using machine learning classifiers, effectively identified main NTAA disease categories and subtypes based on surface-level information. It has the potential to aid in the swift and accurate allocation of medical treatment departments in triage settings.
Supplemental Material
sj-doc-1-sci-10.1177_00368504251350763 - Supplemental material for Intelligent prediagnosis for nontraumatic acute abdomen with surface-level information using machine learning
Supplemental material, sj-doc-1-sci-10.1177_00368504251350763 for Intelligent prediagnosis for nontraumatic acute abdomen with surface-level information using machine learning by Zhichen Liu, Qingping Ran and Xu Luo in Science Progress
Footnotes
List of abbreviations
Ethics approval and consent to participate
The present study has been registered with the ethics committee of the Affiliated Hospital of Zunyi Medical University (KLLY-2021-060) and conducted in accordance with the Declaration of Helsinki. In view of the retrospective nature of this research, the Ethics Committee has waived the requirement for informed consent. Prior to the analysis, the patients’ data underwent anonymization and de-identification procedures.
Authors’ contributions
ZL contributed to the data acquisition and study design, while QR and XL primarily undertook the data analysis and interpretation. The initial draft of the manuscript was collaboratively composed by ZL, QR, and XL, with subsequent significant revisions. All authors have perused and sanctioned the final version of the manuscript.
Funding
The authors disclosed receipt of the following financial support for the research, authorship, and/or publication of this article: This work was supported by the National Natural Science Foundation of China, Science and Technology Program of Guizhou Province, Science and Technology Program of The Guizhou Provincial Health Commission (grant number 61861047, CXTD (2023) 028, gzwkj2024-283).
Declaration of conflicting interests
The authors declared no potential conflicts of interest with respect to the research, authorship, and/or publication of this article.
Data availability
The study data are available upon request to the corresponding author.
Supplemental material
Supplemental material for this article is available online.
References
Supplementary Material
Please find the following supplemental material available below.
For Open Access articles published under a Creative Commons License, all supplemental material carries the same license as the article it is associated with.
For non-Open Access articles published, all supplemental material carries a non-exclusive license, and permission requests for re-use of supplemental material or any part of supplemental material shall be sent directly to the copyright owner as specified in the copyright notice associated with the article.