
Abstract
Objective
Water quality plays a pivotal role in environmental health, with direct implications for ecosystems and human populations. This study offers a novel and comprehensive evaluation of four distinct water sources in northeastern Algeria raw wastewater (RWW), treated wastewater (TWW), Oued surface water (OSW) from Oued El Azzabi, and groundwater (GW) addressing a significant research gap in integrated water quality monitoring in semiarid regions. Unlike previous studies, this work integrates both physicochemical and microbiological indicators over a full annual cycle to assess the effectiveness of wastewater treatment and its environmental impact.
Methods
A cross-sectional analysis was conducted using monthly samples collected from January 2023 to January 2024. Physicochemical parameters such as pH, turbidity, electrical conductivity, nutrients, and organic matter (5-day biological oxygen demand), along with microbiological indicators (total coliforms, fecal coliforms, fecal streptococci, sulfite-reducing clostridia, and aerobic mesophilic bacteria), were assessed. The water quality index (WQI) was used to synthesize the results and evaluate the overall water quality across sources.
Results
TWW met national and international standards, demonstrating the effectiveness of the Ain Beida treatment plant. In contrast, RWW showed high contamination levels, highlighting critical health risks. OSW displayed seasonal pollution patterns, especially during summer, due to runoff and human activities. GW exhibited relatively stable quality but indicated persistent low-level contamination. The WQI scores confirmed these findings, offering a comprehensive overview of spatial and temporal quality variations.
Conclusions
This study contributes valuable insights into water resource management in semiarid regions, emphasizing the importance of systematic monitoring and effective wastewater treatment. The results highlight the need for adaptive management strategies and underscore the potential of TWW as a safe alternative for agricultural or industrial reuse. These findings serve as a foundation for policy development and future research in similar ecological contexts.
Keywords
Introduction
Water resources are essential for human survival, economic development, and ecosystem stability.1,2 However, increasing pressure from population growth, urban expansion, and climate change has made water scarcity a pressing global concern.3–5 Agriculture, as the largest consumer of water worldwide, intensifies this challenge, especially in arid and semiarid regions where freshwater availability is naturally limited. 6 To ensure sustainable water management, there is growing interest in the use of alternative water sources, particularly treated wastewater (TWW), for agricultural purposes.7,8
Reusing TWW not only helps preserve freshwater reserves but also reduces environmental pollution and enhances food security.8,9 This practice is gaining global attention as a viable strategy to address water shortages, especially under climate variability. 10 The United Nations, through its sustainable development goals, advocates for the safe reuse of wastewater by 2030 to strengthen resilience in water-scarce regions. 11
In Algeria, water scarcity has worsened due to declining precipitation and overexploitation of conventional water sources.12,13 Agriculture remains the dominant sector in water consumption, and about 80% of the population resides in arid and semiarid areas with limited surface water availability. 14 To address this challenge, the country has developed policies promoting the treatment and reuse of wastewater in agriculture.13,15 The National Office of Sanitation (ONA) oversees numerous treatment plants designed to produce effluents of suitable quality for irrigation, thereby contributing to sustainable water resource management. 16
Water quality assessment is essential for evaluating the suitability of TWW, and it involves measuring both physicochemical and bacteriological parameters that indicate pollution levels.17,18 Common pollution indicators include parameters such as electrical conductivity (EC), total dissolved solids (TDSs), 5-day biochemical oxygen demand (BOD5), chemical oxygen demand (COD), total suspended solids (TSSs), nutrients such as nitrate (NO₃−), ammonium (NH₄+), phosphate (PO₄³−), heavy metals, and the presence of pathogenic microorganisms such as total coliforms (TC) and fecal coliforms (FC).19,20 These indicators are critical for determining the environmental and health risks associated with wastewater reuse and are often influenced by seasonal fluctuations, treatment performance, and anthropogenic activities.21,22
Previous studies have explored the feasibility of using TWW for irrigation in various contexts. For instance, Badr et al. 7 and Haider et al. 23 in Saudi Arabia, as well as Santos et al. 8 in Leiria, demonstrated that the use of reclaimed water can support agricultural activity in semiarid areas without significantly affecting soil quality In Zahedan, 10 Belgium, 5 and Egypt, 24 the authors found that the suitability of TWW depends on the level of treatment and the monitoring of key physicochemical and bacteriological parameters. In Algeria, studies such as12,14,25,26 assessed the quality of TWW at selected plants, but often focused solely on physicochemical characteristics or lacked evaluation of seasonal dynamics and did not employ integrated tools such as the water quality index (WQI).
This study aims to provide a comprehensive evaluation of the physicochemical and bacteriological quality of different water sources, namely TWW, surface water (from Wadis), and well water, in the city of Ain Beida, northeastern Algeria. It also investigates seasonal and spatial variations and assesses the potential of treated effluent from the Ain Beida wastewater treatment plant for irrigation purposes. The WQI is used as a decision-support tool to classify water suitability and to explore the interrelation between water parameters and microbial indicators. The originality of this study lies in its integrated approach, combining seasonal analysis, WQI application, and microbial assessment to support sustainable agricultural practices in water-scarce regions. The findings of this research are expected to support local decision-makers in optimizing water reuse strategies and in promoting environmentally safe irrigation practices that contribute to sustainable agriculture in semiarid regions.
Materials and methods
Study area
This study was carried out in the town of Ain Beida, located in northeastern Algeria, at a latitude of 35.77930°N and a longitude of 7.55971°E, at an elevation of 1060 m above sea level. 27 The Ain Beida wastewater treatment plant is located around 3 km northwest of the town, on the right bank of the Oued El Azzabi, to the left of national road no. 5 toward Oum El Bouaghi. Commissioned in 2015, it is equipped with an activated sludge system and is designed to treat the wastewater generated by a population equivalent to 140,000, with a capacity that can be extended to 210,000 population equivalents. 12 Wastewater is treated through two separate processes: for the water, there is the raw water inlet, pretreatment, biological treatment, secondary decanters, and chlorination; for the sludge, there is the primary thickener, aerobic digester, secondary thickener, and drying beds. 27 The Ain Beida region has a semiarid climate, characterized by hot summers with temperatures that can reach 40°C and relatively cool winters with minimum temperatures that can drop to around 5°C. 12 Average annual rainfall is low, often <400 mm, concentrated mainly in the winter months. The soil in the region is generally shallow and well-drained, often composed of sands and silts with a low organic matter content. 28 These characteristics reduce its capacity to retain water, which in turn affects its suitability for certain water-related uses, particularly in agriculture. 29
Water sampling
Sampling of the various water sources was carried out according to rigorous protocols in order to assess their quality. Sampling was carried out on four types of water, from three separate sites: raw wastewater (RWW) and TWW were collected at the Ain Beida wastewater treatment plant (35°47′22.24″N, 07°20′27.18″E); the Oued surface water (OSW) was collected from the Oued El Azzabi (35°47′18″ N, 07°20′11″E), downstream of the plant; and the GW was collected from a well located within the plant (35°47′15″N, 07°20′22″E). These locations were selected to assess the impact of water treatment, the quality of the receiving water after discharge, and potential interactions with groundwater (GW). A total of 48 water samples were collected for physicochemical analyses, with 12 samples per water type—one collected monthly over a full year from RWW, TWW, OSW, and GW. For bacteriological analyses, four samples per water type were taken seasonally, totaling 16 samples. Samples for physicochemical analysis were collected in 500 mL polyethylene bottles, while samples for bacteriological analysis were taken in 250 mL sterile glass bottles and sterilized at 170°C for 1 h.30,31 To preserve sample integrity, all bottles were hermetically sealed, kept at 4°C in the dark, and promptly transported to the laboratory for analysis.
Physicochemical parameters
The water samples were analyzed using standardized protocols to determine a comprehensive set of physicochemical parameters relevant to water quality assessment. 31 In situ measurements of pH, EC, salinity, and dissolved oxygen (DO) were carried out using a multiparameter meter (Multi 360i, WTW GmbH, Germany). The concentration of suspended solids (SSs) was determined by centrifugation, while total hardness (TH) was measured by complexometric titration with ethylenediaminetetraacetic acid. BOD5 was assessed using the respirometric method via the OxiTop® system (WTW GmbH, Germany), which continuously records oxygen consumption during the oxidation of organic matter. BOD5 values were expressed in mg O₂/L. NH₄+ and nitrite (NO₂−) levels were quantified using an ultraviolet-visible spectrophotometer (DR6000, Hach Company, USA), whereas NO₃− concentrations were determined using the sodium salicylate method, according to standard T90-012. Sodium (Na+) and potassium (K+) were measured by flame photometry (PFP7, Jenway, UK), following ISO 9964/3. Orthophosphates (P-PO₄³−) and sulfates (SO₄²−) were also analyzed spectrophotometrically using the same spectrophotometer. Chloride (Cl−) was quantified using Mohr's method, involving silver nitrate (AgNO₃) and potassium chromate (K₂CrO₄) as indicators. Total nitrogen was determined by the Kjeldahl method, and total phosphorus was analyzed using the colorimetric phosphomolybdenum blue method. 31
To ensure the reliability of the analytical results, all measurements were performed in triplicate. Calibration of instruments was regularly conducted using certified standard solutions. Blanks and reference samples were included in each batch of analyses to monitor accuracy and precision. The laboratory followed internal quality control protocols consistent with ISO/IEC 17025 standards.
Bacteriological analysis
Bacteriological analyses were carried out in accordance with standardized protocols to detect and quantify a range of microbial indicators of water sanitary quality, chosen based on their relevance in indicating fecal contamination and overall microbiological safety. 32 The parameters assessed included TC, FC, fecal streptococci (FS), sulfite-reducing clostridia (SRC), and total aerobic mesophilic bacteria (TAMB).
TC and FC were analyzed according to ISO standard 9308-2 using the membrane filtration method. After filtration, membranes were incubated on Chromocult® Coliform Agar (Merck KGaA, Germany) at 37°C for TC and at 44°C for FC. FS and SRC were determined using membrane filtration followed by incubation on Kenner Fecal-Streptococcus Agar (Biokar Diagnostics, France) and Sulfite Polymyxin Sulfadiazine Agar (Biokar Diagnostics, France), respectively, following the French standard NA766. 31 TAMB were quantified by surface plating on Plate Count Agar (Biokar Diagnostics, France), incubated at 30°C for 72 h.
To ensure methodological reliability, all samples were collected in presterilized 250 mL borosilicate glass vials, and sterilized at 170°C for 1 h.30,31 Negative controls (blanks) were processed alongside to monitor contamination during transport and handling. Samples were stored at 4°C in the dark and transported to the laboratory within 6 h of collection to preserve microbial integrity. The analyses were repeated in triplicate to enhance precision and support statistical validity.
Water quality index (WQI)
WQI is a crucial tool for assessing the quality of various water sources. 33 In this study, WQI is applied to TWW, RWW, OSW, and GW. Based on a set of physicochemical and bacteriological parameters, the WQI allows these complex data to be synthesized into a single indicator, thus facilitating informed decision-making regarding water resource management. 34 The WQI was calculated using the method proposed by Yidana and Yidana. 35 In this approach, each parameter is associated with a numerical weight (wi), ranging from 1 to 5, reflecting its impact on water quality.36–38 The highest weights, with a value of 5, were assigned to NO₃–, NO₂–, and NH₄+. A weight of 4 was assigned to EC, Na+, P-PO₄³−, Pt, DO, and 5-day biological oxygen demand (BOD5), wi = 3 for TSS, TH, Ca2+, Mg2+, SO₄²− and chloride (Cl–), wi = 2 for pH, and total alkalinity concentration (TAC), and finally, a minimum weight of 1 was given to temperature. 39 Table 1 details the weights assigned to the different physicochemical parameters.
Physicochemical parameters and their relative weighting for calculating water quality index (WQI). The standards (Si) correspond to the accepted reference values, and the weights (Wi) indicate the relative importance of each parameter.

The relative weight (Wi) is calculated by the following equation (1):

To calculate the WQI, the subindex is the first index to be determined (equation (3)). From the sum of the subindices for each parameter, we determine the WQI for each sample (equation (4)):

According to Nadjai et al., 42 five quality classes can be identified according to the values of WQI (Table 2). The assessment of WQI was based on water quality standards established by FAO 40 and updated with national law related to the reuse of TWW for irrigation purposes, 41 which makes it possible to judge the suitability for irrigation of different water sources. 43 By consolidating data from various parameters the WQI offers an accessible and integrated approach to monitoring water quality, contributing to more effective management decisions and the protection of public health and the environment in the study region. 44
Water quality index (WQI) classification and ranges (Nadjai et al. 42 ). Each WQI class indicates the quality of the water and its suitability for different uses, including irrigation.

Statistical analysis
Statistical analyses were conducted using the R statistical software. 45 All data were processed to obtain descriptive statistics, including means, standard deviations, minimums, and maximums, offering a comprehensive overview of the variability in the data collected. To examine the effects of water type and season on the measured physicochemical parameters, two-way analysis of variance (ANOVA) tests were performed. Where significant effects were identified, Tukey's post-hoc test was applied to determine which groups differed significantly. To further explore the variation in WQI and bacteriological parameters, generalized linear models (GLMs) were implemented. These models incorporated both water type and season as main effects, as well as their interaction. GLMs were fitted with a Gaussian distribution and identity link function for WQI and with a Poisson distribution and log link function for bacterial group densities (TC, FC, FS, SRC, and TAMB). In addition, to analyze the potential influence of water quality on bacteriological contamination, Gaussian GLMs were used to assess the effect of WQI on bacterial densities across the different water types (OSW, RWW, and TWW). Finally, principal component analysis (PCA) was used to identify correlations and patterns among the measured physicochemical parameters and WQI values. PCA served as a dimensionality reduction tool, facilitating the interpretation of complex multivariate relationships. Separate PCA analyses were performed for each water source (GW, OSW, RWW, and TWW) to better understand the structure of variation within each group. 23
A formal a priori sample size calculation was not performed. However, the sampling design was structured to ensure adequate temporal and spatial representation: a total of 48 samples were collected for physicochemical analyses (12 per water type, sampled monthly over one year), and 16 samples for bacteriological analyses (4 per water type, sampled seasonally). This design supports robust seasonal and comparative analysis, although it may limit the statistical power for detecting small effect sizes.
Results
Seasonal patterns in water physicochemical parameters
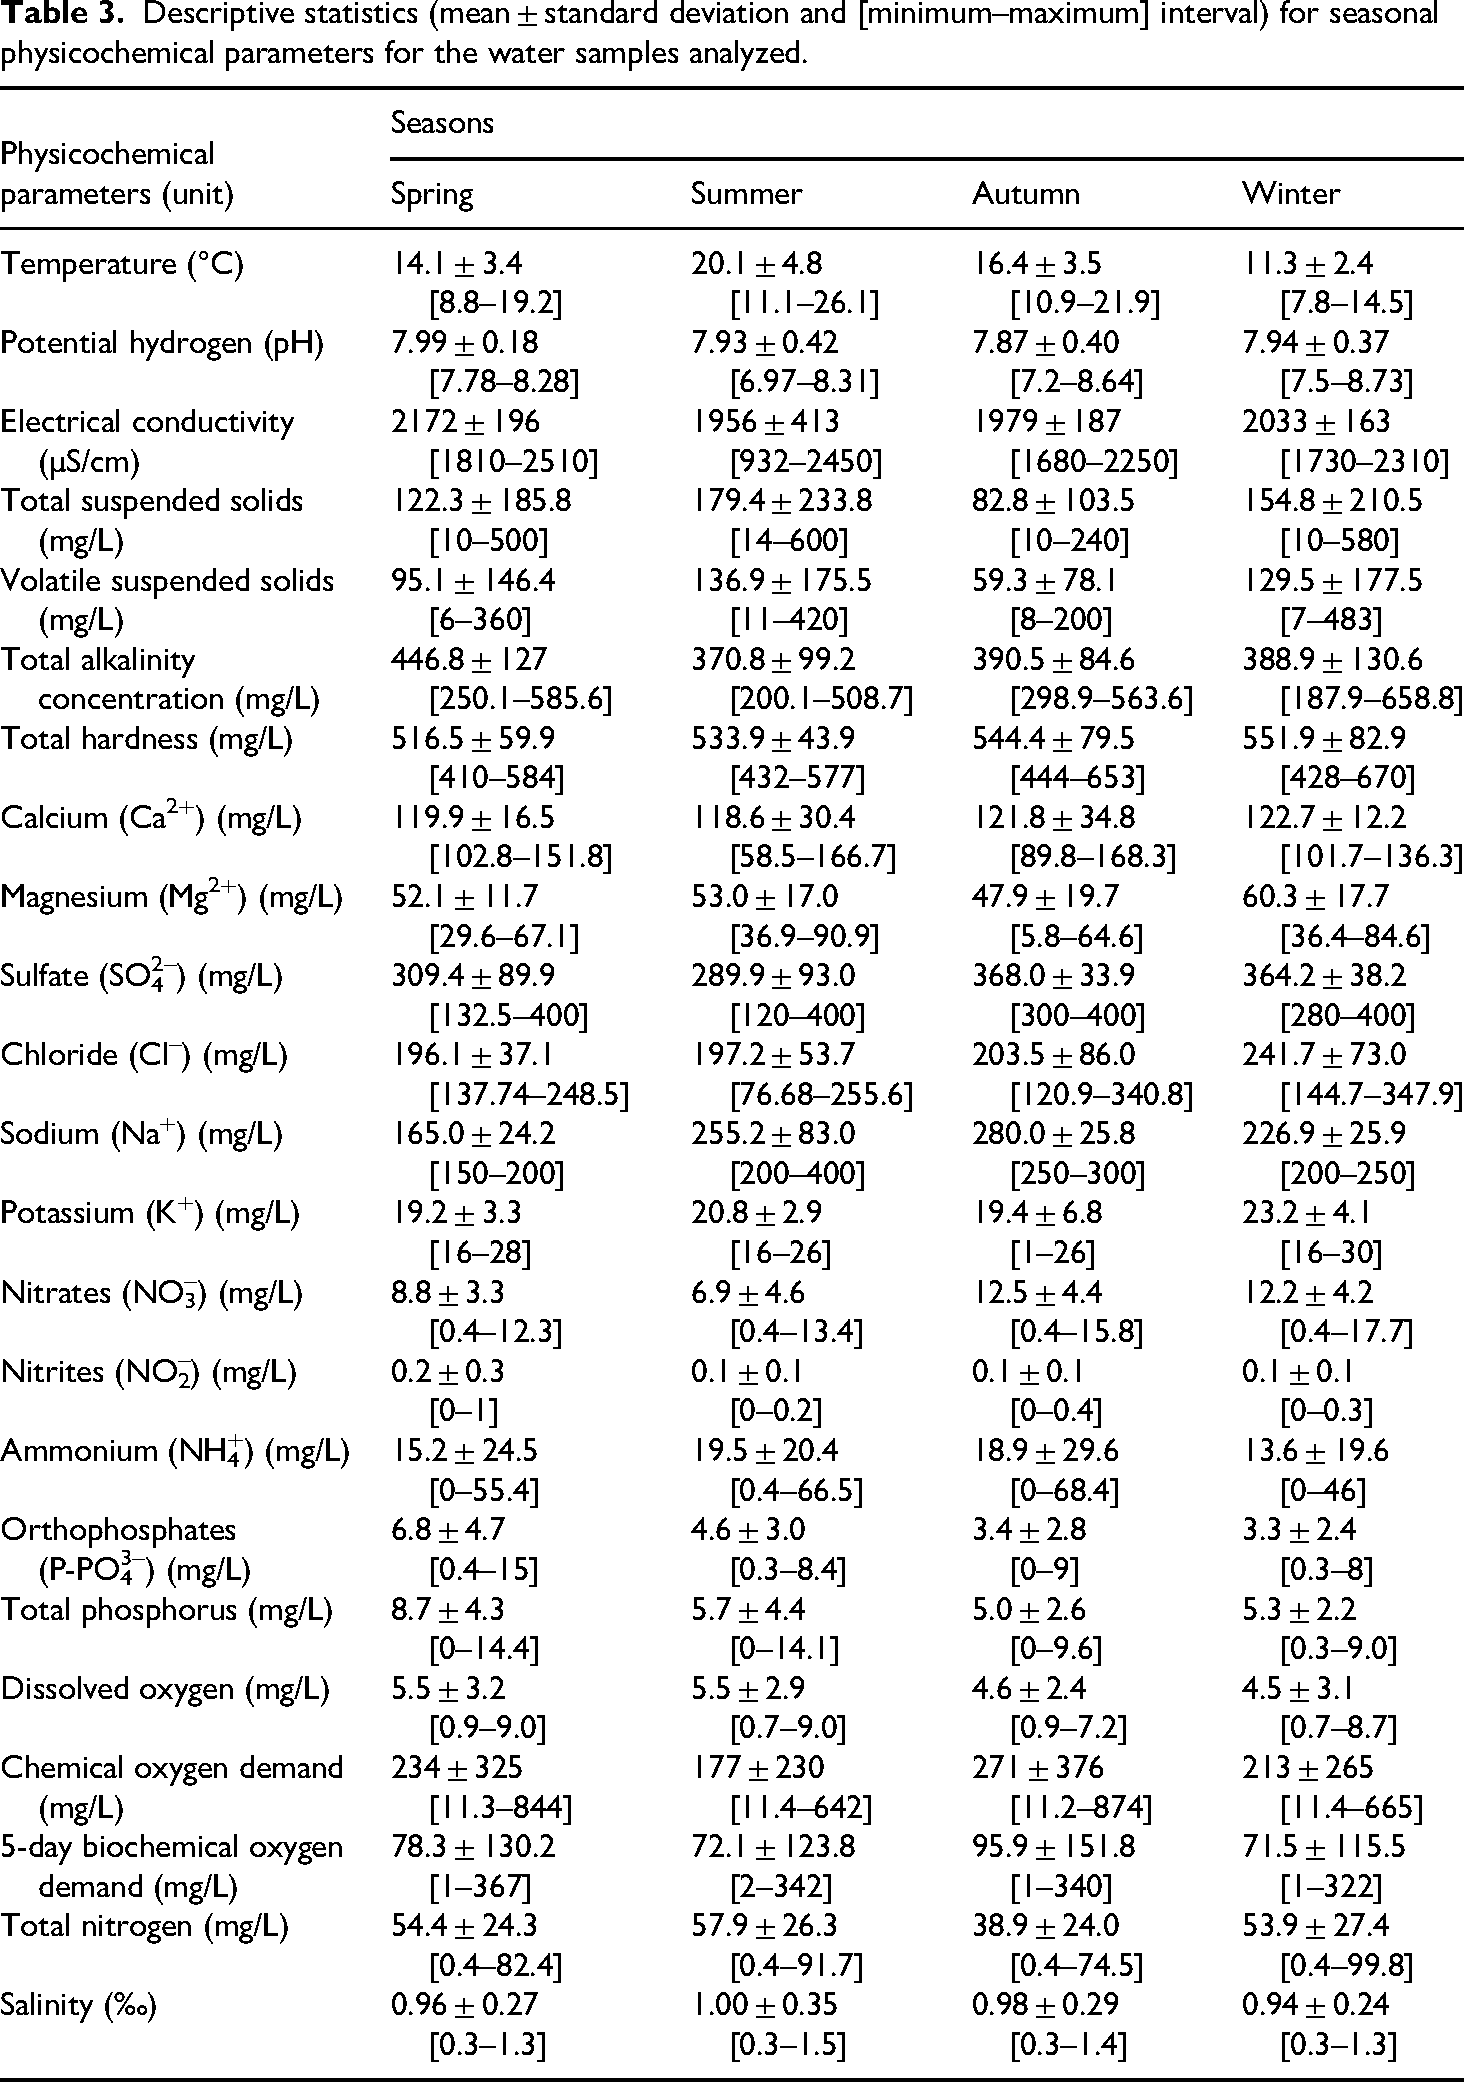
The physicochemical parameters of the water show significant variations over the seasons. In summer, temperature rises significantly, accompanied by an increase in EC in spring, indicating a higher concentration of dissolved minerals. There is also an increase in SSs and volatile matter in summer. NO3– and NH4+ concentrations are higher, particularly in winter, autumn, and summer. DO peaked in spring. Other parameters such as pH, Ca2+, Mg2+, TAC, and salinity remained relatively stable throughout the year (Table 3).
Descriptive statistics (mean ± standard deviation and [minimum–maximum] interval) for seasonal physicochemical parameters for the water samples analyzed.
Physicochemical parameters of water types
Significant variations were observed in several water quality parameters (Figure 1). The highest temperature was recorded in the OSW with an average of 17.1 ± 3.6°C, while it decreased in the TWW. The pH varied between 7.7 and 8.1 for all types of water, and the EC was significantly higher in the RWW, reaching 2241.5 ± 156.2 µS/cm, while it was lower in the TWW. TSS was highest in RWW (370.8 ± 147.1 mg/L) and remained low in TWW. Concerning TH, GW showed a high value of 597.3 ± 33.1 mg/L, while it was much lower in RWW. Ca2+ varied between 110.2 and 151.1 mg/L, with lower values in OSW. Mg2+ was highest in OSW with an average of 58.9 ± 15.9 mg/L. As for NO₃–, it was concentrated in RWW with values between 13 ± 3.3 mg/L, while NO₂– displayed a higher average in RWW (0.27 ± 0.24 mg/L). P-PO₄ was highest in RWW, with values between 6.6 ± 4 mg/L. DO decreased sharply in RWW, reaching 1.6 ± 1.6 mg/L, but increased in OSW and GW. For COD, it reached a maximum in RWW (635.7 ± 184.3 mg/L), while it decreased sharply in TWW and GW. As for BOD5, the lowest value was recorded in GW (1.8 ± 0.5 mg/L), compared with a maximum of 254.6 ± 85 mg/L in RWW.
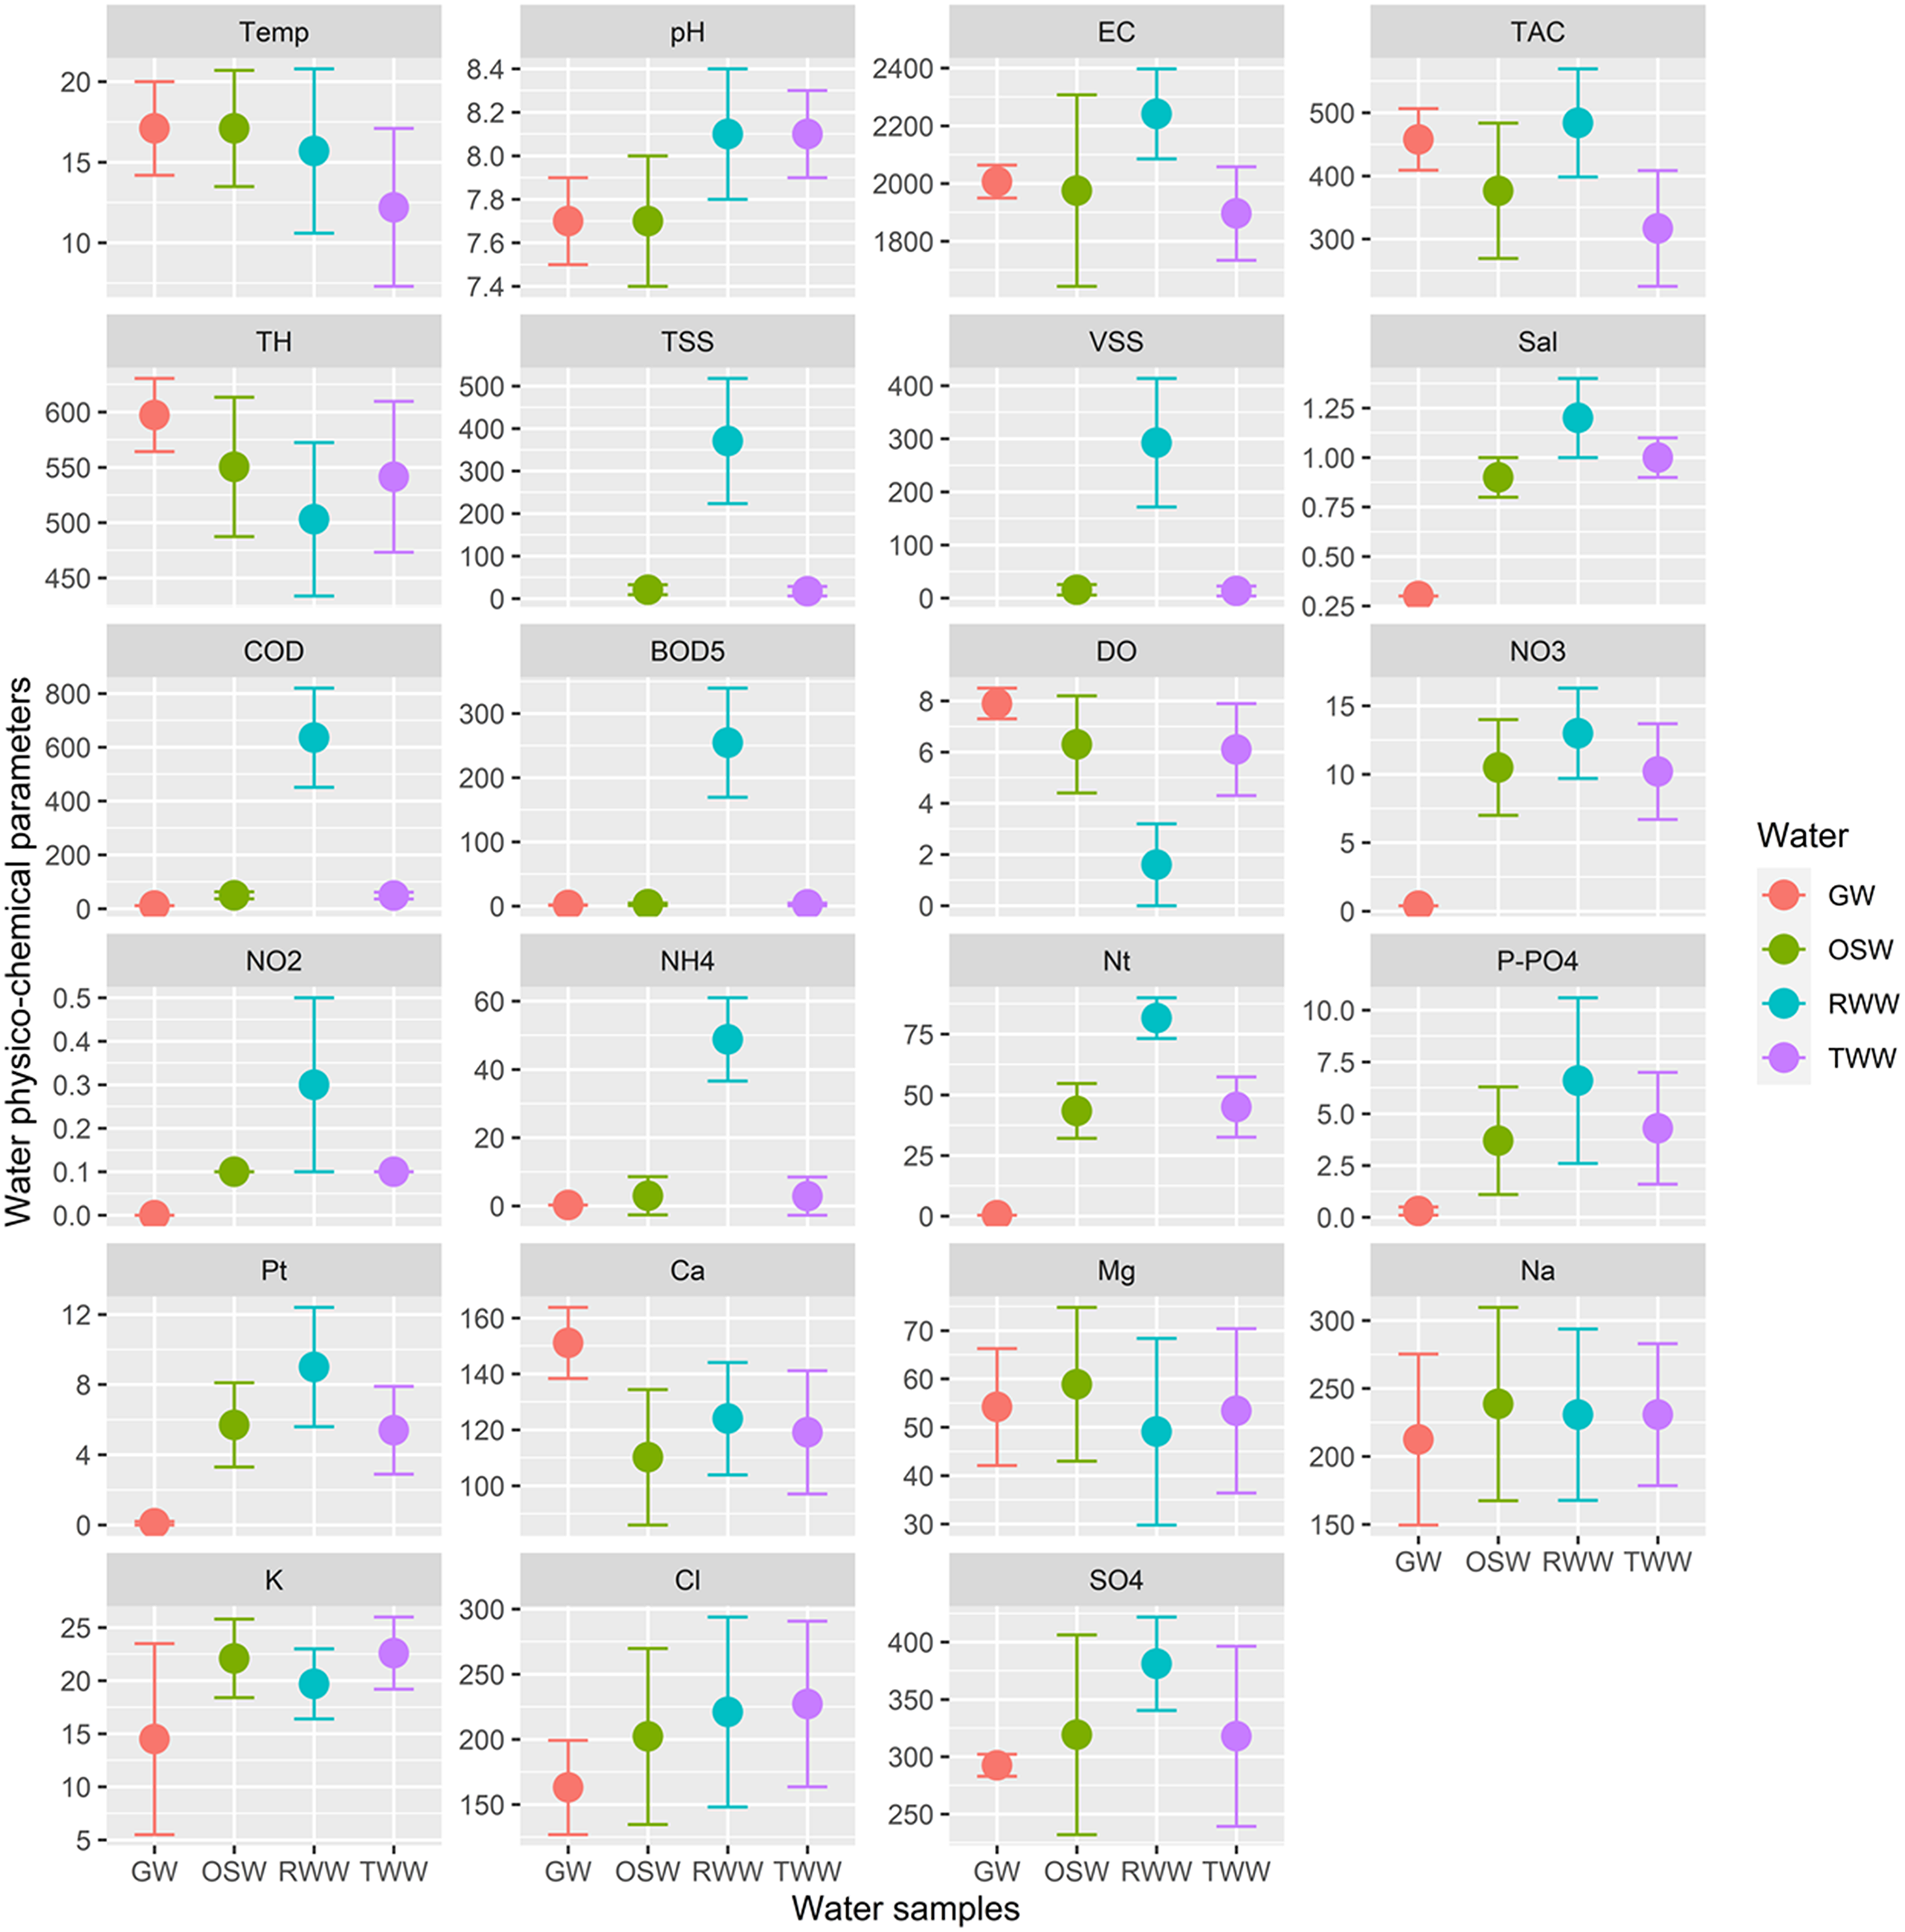
Plot of means (colored solid circles) with standard deviation (vertical bars) of the physicochemical parameters measured for different types of water (GW, OSW, RWW, and TWW). Water parameter abbreviations are listed in Table 1.
ANOVA revealed significant variations in physicochemical parameters according to water type, season, and interactions between these two factors (Table 4). Significant variation between water types was observed for the following parameters: temperature, pH, EC, TSS, volatile SS (VSS), TAC, Ca²+, K+, NO₃–, NO2–, NH₄+, SO₄²–, COD, DO, BOD5, P-PO₄³–, Pt, Nt, and salinity (p < 0.05). Regarding significant variation between seasons, affected parameters included temperature, TSS, VSS, SO₄²–, Na+, K+, NO₃–, P-PO₄³−, Pt, and Nt (p < 0.05). Finally, significant variations according to interactions between water types and seasons were observed for VSS and K+ (p < 0.05)
ANOVA testing the variation of physicochemical parameters between different types of water and studied seasons. The abbreviations of the water parameters are presented in Table 1.

ANOVA: analysis of variance; BOD5: 5-day biological oxygen demand; Ca2+: calcium; Cl–: chloride; COD: chemical oxygen demand; df: degrees of freedom; DO: dissolved oxygen; EC: electrical conductivity; F: F-statistics; K+: potassium; Mg2+: magnesium; Na+: sodium; NH4+: ammonium; NO2–: nitrites; Nt: total nitrogen; pH: potential of hydrogen; P-PO43–: orthophosphates; Pt: total phosphorus; p-value: probability value; S: season; SO42–: sulfate; TAC: total alkalinity concentration; TH: total hardness; TSS: total suspended solid; VSS: volatile suspended solid; W: water.
Water quality index (WQI)
The WQI results show significant variations depending on the type of water and the season (Figure 2). For GW, the index averages 42.3, while for OSW it is 195.7. RWWs show the highest values with an average of 857.2, and TWWs, after treatment, show a clear improvement with an average of 96.6. Seasonal trends indicate a general increase in WQI values during warmer months, with summer showing the highest index levels across all water types, likely due to enhanced evaporation and reduced dilution. Winter generally exhibits lower WQI values, reflecting reduced pollutant inputs and cooler temperatures. These seasonal patterns highlight the influence of climatic variability on water quality.

Boxplot representing a distribution of WQI values for different types of water (GW, OSW, RWW, and TWW) as a function of the four seasons.
The GLM results on the variation in WQI as a function of water type and season are shown in Table 5. They indicate a significant variation in WQI between water types with a highly significant effect (p < 0.001) for RWW. However, no significant variation was observed between seasons or in water–season interactions. The parameters of the interaction between water types and seasons showed no statistically significant effect, as indicated by the high p values and the absence of marked effects in the estimated coefficients.
Summary of GLM testing the variation of the WQI between different types of water (OSW; Oued surface water; RWW: raw wastewater, and TWW: treated wastewater) and seasons.

2.5% CI and 97.5% CI: lower and upper 95% confidence intervals, respectively; Sig.: significance of probability value (p-value); NS: not significant (p > 0.05); ***: p < 0.001; OSW: Oued surface water; RWW: raw wastewater; TWW: treated wastewater.
Variation in WQI values between seasons and water types
A breakdown of water quality results by water type and season is presented in Figure 3. Overall, RWW was characterized by completely unsuitable quality, while TWW showed clear improvement. GW had the best quality. In contrast, OSW had slightly lower quality. Regarding seasonal variations, spring and autumn recorded the highest proportions of good-quality samples, while a decline was observed in the summer. Winter presented an intermediate profile.

Distribution of water samples over water quality classes (%) according to the WQI classification for different studies seasons (left plot) and water types (right plot). The studied water types are GW, OSW, RWW, and TWW.
Interrelations of PPC with WQI
The PCA illustrated in Figure 4A to D highlights the distribution and correlations between the various physicochemical water parameters along four main axes. In Figure 4A, the PCA captured 42.8% of the total variance on the first axis (PCA1) and 37.4% on the second axis (PCA2), showing a marked positive correlation between COD, P-PO₄³−, Cl−, K+, as well as NO2– and NH4+. In Figure 4B, which explains 24.9% of the variance on PCA1 and 16.3% on PCA2, a close relationship is observed between TAC, COD, Na+, and Mg2+. This group of elements shows a strong interaction, while DO and P-PO₄³− are less influential in this dimension. Figure 4C shows a wider dispersion of variables, with PCA1 explaining 22% of the total variance and PCA2 covering 17.1%. VSS and TAC dominate, but appear weakly correlated with other chemical parameters such as pH and temperature. P-PO₄ and TSS reveal a slight positive correlation. In Figure 4D, with PCA1 explaining 23.9% and PCA2 covering 21.3%, group variables such as NO₃–, NO₂–, pH, and total phosphorus (Pt), which are distributed according to the different water sources.

PCA of the physicochemical parameters and WQI of samples collected from different types of water (A: groundwater; B: OSW; C: raw wastewater; D: treated wastewater). The abbreviations of water parameters are reported in Table 1.
Bacterial abundance in various types of water according to season
Seasonal variations in bacterial groups (TC, FC, FS, SRC, and TAMB) in the different types of water are shown in Figure 5. Overall, RWWs show the highest concentrations for all bacterial groups, with peaks in summer, such as TC (up to 180,000 colony-forming units (CFU)/100 mL) and TAMB (32,000 CFU/100 mL). OSW showed moderate variations, but was always higher than TWW, with higher values in spring and summer, for example, for TC (up to 47,000 CFU/100 mL). TWW, on the other hand, shows the lowest concentrations and is relatively stable throughout the year, illustrating the effectiveness of the treatment, with values often below 100 CFU/100 mL for FS and SRC.

Bar plots of mean concentrations of bacterial groups in different water sources (OSW, RWW, and TWW) sampled over the four seasons.
The GLM results (Table 6) show significant increases in bacterial concentrations in the RWW for all bacterial groups (TC, FC, FS, SRC, and TAMB; p < 0.001). In addition, the concentrations of TC, FC, and SRC increased significantly during the summer (p < 0.001). Conversely, significant decreases were observed in autumn and winter compared with spring for TC, FC, and FS. On the other hand, TWW did not show significant variations for all bacterial groups (p = 1.000). Finally, the interactions between RWW and summer showed an increase in TC and FS (p = 0.001).
Results of GLMs testing the variation of loads of bacterial groups (TC, FC, FS, SRC, and TAMB) among the water type (OSW (included in the intercept of the models), RWW, and TWW) and the studied seasons.

Est.: estimate; FC: fecal coliforms; FS: fecal streptococci; GLM: generalized linear model; OSW: Oued surface water; RWW: raw wastewater; SRC: sulfite-reducing clostridia; TAMB: total aerobic mesophilic bacteria; TC: total coliforms; TWW: treated wastewater; Z: Z-statistics.
Interrelationships between bacterial groups
The relationships between the bacterial groups are illustrated in Figure 6. TC show a strong linear relationship with FC (p < 0.001), FS (p < 0.001), and SRC (p < 0.001). A strong correlation is also observed between FC and FS (p < 0.001), revealing a close association between these bacterial groups in the studied samples. FS also show a significant correlation with SRC (p < 0.001) and TAMB (p < 0.001). Moreover, SRC show significant correlations with other bacterial groups, although slightly weaker in intensity. Finally, TAMB displays a high correlation with TC (p < 0.001), FC (p < 0.001), and FS (p < 0.001).
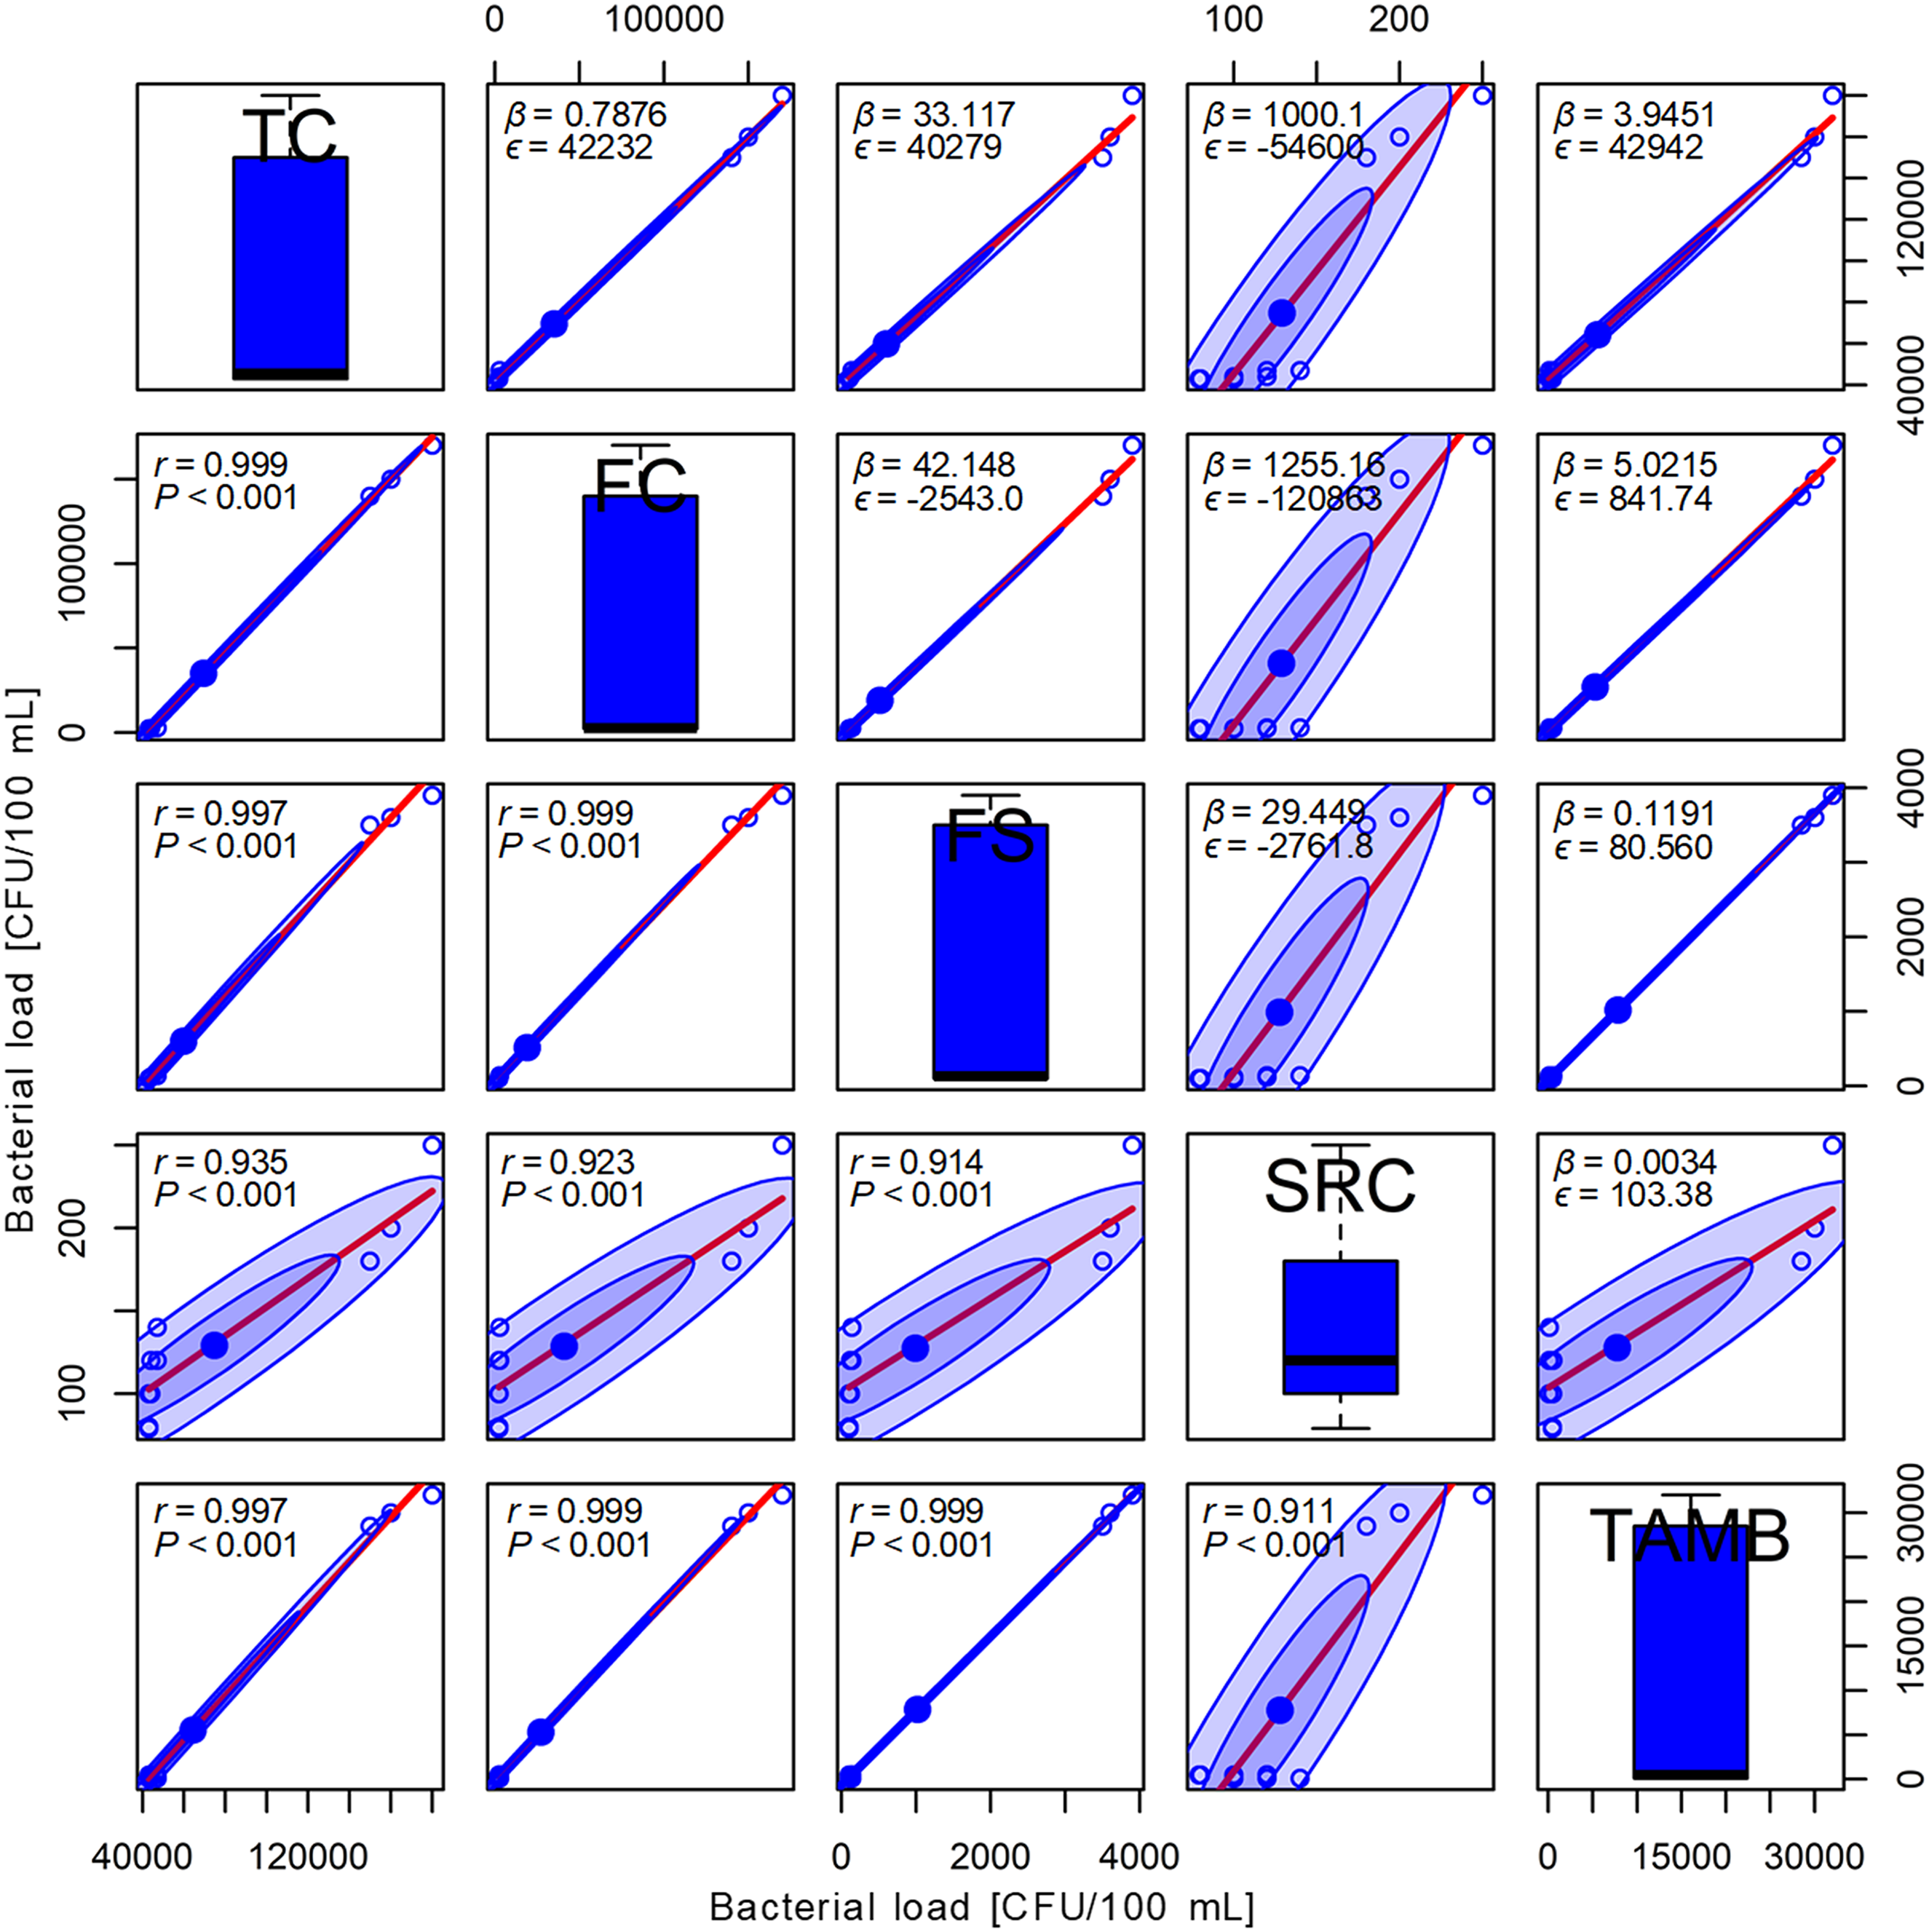
Scatterplot matrix illustrating the interrelationships between densities of bacterial groups (TC, FC, FS, SRC, and TAMB). Thick red lines represent linear regressions (Y = βX + ɛ) with parameters of the linear model (β) and error terms (ɛ) are given at the top of plots above the diagonal. Pearson correlation tests (r = correlation coefficient value and P = p-value) between bacteria densities are displayed in plots below the diagonal. Light blue ellipses represent 50% and 90% concentration levels of observations with the centers in blue solid circles.
Effects of WQI on BG
The relationships between WQI and different bacterial groups in three types of water: OSW, RWW, and TWW are illustrated in Figure 7. For OSW, the results show a trend toward an increase in TC with a rise in WQI, particularly noticeable in autumn, when concentrations reach 160 CFU/100 mL. On the other hand, for RWW, a decrease in bacterial concentrations is observed with an increase in WQI, especially in spring and summer, when TC and FS levels are high. For TWWs, TC levels are relatively low, fluctuating around 30 CFU/100 mL, and vary slightly with the seasons, while SRC and TAMB also show seasonal trends, with higher concentrations in RWWs in summer.

Scatter plot showing the relationships between water quality index (WQI) and loads of bacterial groups in different water types. Each water sample was mapped to the sampled seasons using different colors of the points, and WQI classes using different point shapes.
The influence of WQI on bacterial loads is summarized in Table 7. The results show significant variations in bacterial groups based on WQI for the different water types. TC, FC, FS, and SRC concentrations are significantly influenced by WQI in OSW and TWW (p < 0.05). However, in RWW, the effect of WQI on TC, FC, FS, and SRC is not significant (p > 0.05). TAMB shows similar results, with a significant effect of WQI on TWW (p = 0.024), but not on OSW (p = 0.095) and RWW (p > 0.05).
Estimates from the GLM show the influence of WQI on the variations of densities of bacterial groups (TC, FC, FS, SRC, and TAMB) across different water types (OSW, RWW, and TWW).

2.5% CI and 97.5% CI: lower and upper 95% confidence intervals, respectively; FC: fecal coliforms; FS: fecal streptococci; GLM: generalized linear model; NS: not significant (p > 0.05); OSW: Oued surface water; RWW: raw wastewater; SE: standard error; Sig.: significance of probability value (p-value); SRC: sulfite-reducing clostridia; TAMB: total aerobic mesophilic bacteria; TC: total coliforms; TWW: treated wastewater; WQI: water quality index; *: p < 0.05; **: p < 0.01; ***: p < 0.001.
Discussion
Water quality, essential for human and environmental health, is shaped by both physicochemical and bacteriological parameters that vary by source and season.3,46 In this study, four types of water: RWW, TWW, OSW, and GW were assessed throughout the year. The results, aligned with local 41 and international 40 standards, confirm the effectiveness of the Aïn Beida treatment plant (Table 8). The use of the WQI provided a clear overview of water quality variation across types and seasons.33,47,48 Seasonal variations in physicochemical parameters were statistically significant and reflect the dynamic interaction between environmental conditions and anthropogenic influences. For instance, elevated temperatures during summer likely enhanced microbial metabolism and accelerated biochemical reactions, which in turn influenced key indicators such as DO and COD. These seasonal thermal effects are consistent with patterns observed by Ababsa et al. 49 and Obougou et al. 50
Comparative analysis between the present study and two recent works in 2024.
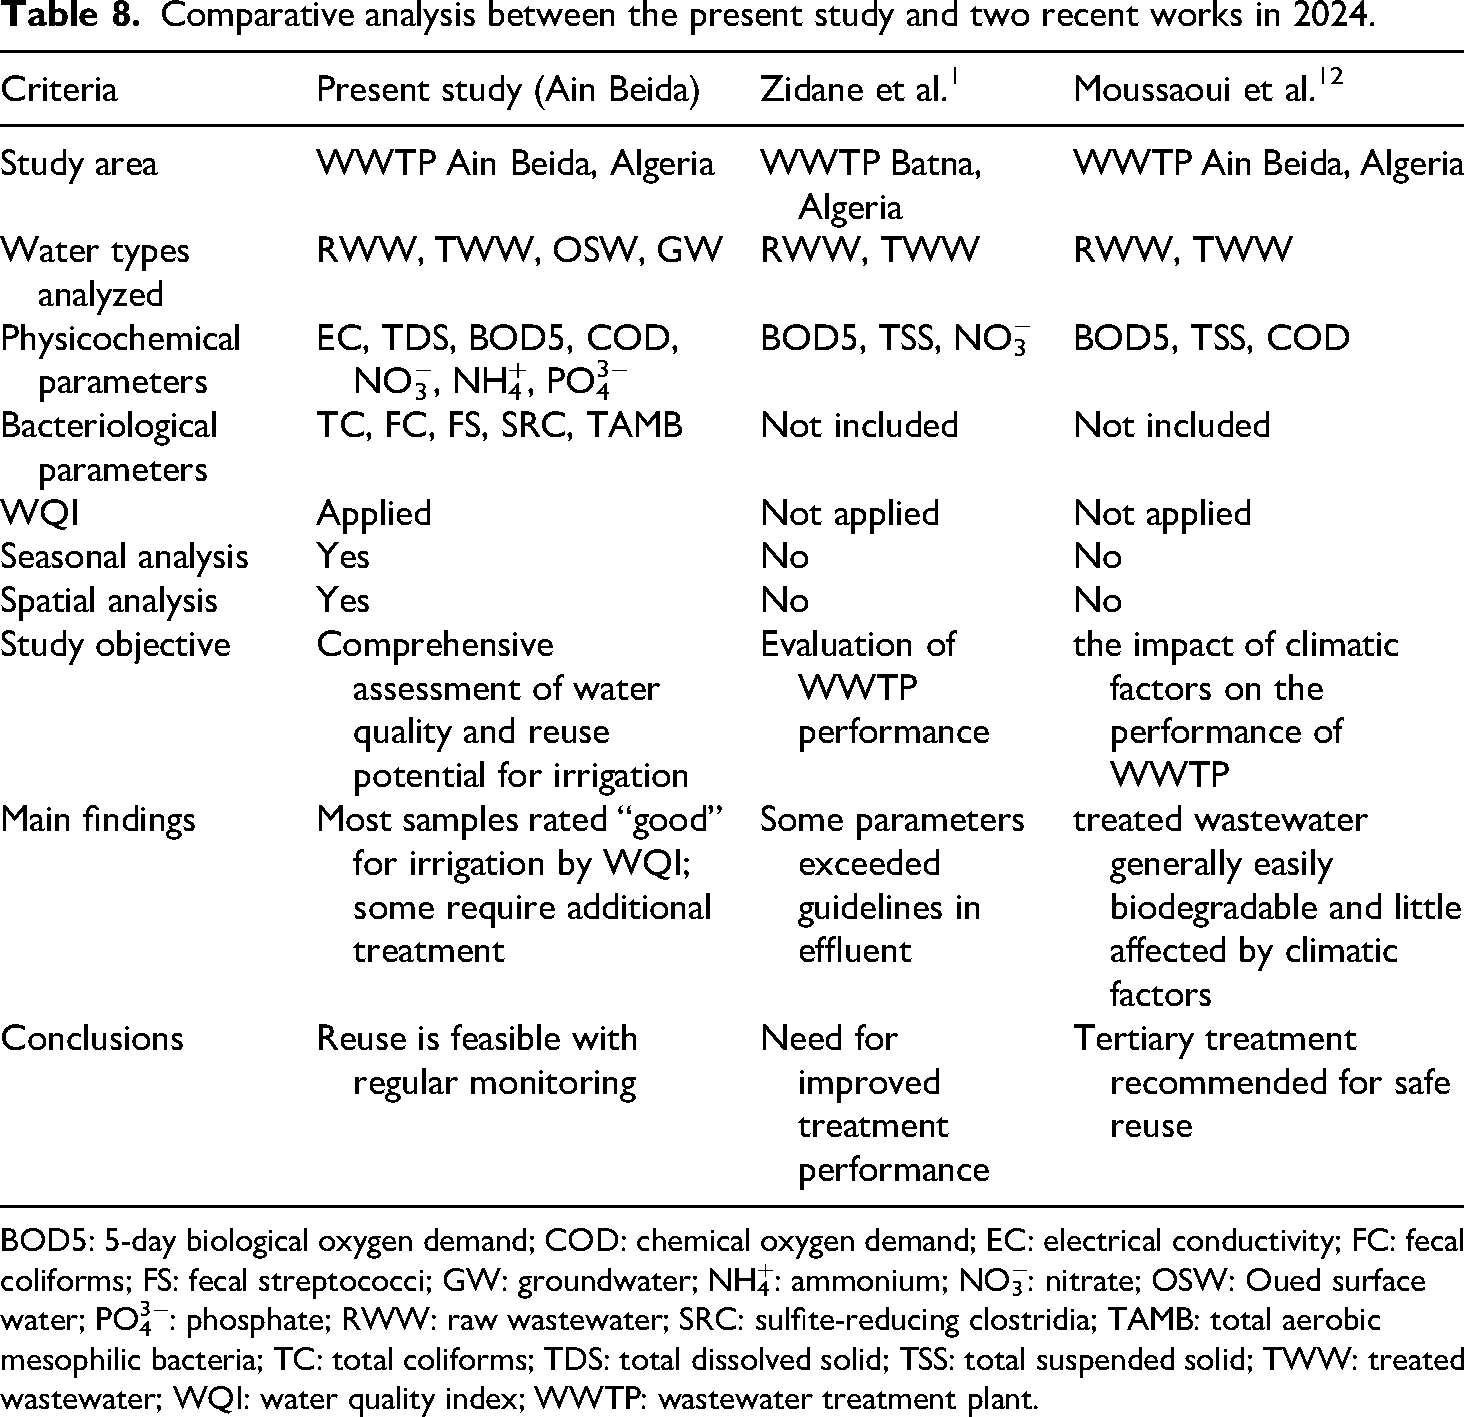
BOD5: 5-day biological oxygen demand; COD: chemical oxygen demand; EC: electrical conductivity; FC: fecal coliforms; FS: fecal streptococci; GW: groundwater; NH4+: ammonium; NO3−: nitrate; OSW: Oued surface water; PO43−: phosphate; RWW: raw wastewater; SRC: sulfite-reducing clostridia; TAMB: total aerobic mesophilic bacteria; TC: total coliforms; TDS: total dissolved solid; TSS: total suspended solid; TWW: treated wastewater; WQI: water quality index; WWTP: wastewater treatment plant.
EC, which indicates the ionic strength of water, did not follow a uniform seasonal pattern and may have been affected by local variations in inflow sources, evaporation rates, and water management practices. While some semiarid regions typically report increased EC in dry seasons due to concentration effects,51,52 our findings suggest additional site-specific controls such as dilution from TWW.
The marked rise in TSS and VSS during summer likely resulted from enhanced surface runoff, erosion, and agricultural activity,1,53 reported similar trends, linking increased solids load to soil disturbance and fertilizer application during irrigation periods. This increase poses potential risks for sedimentation and turbidity in receiving waters.
A decline in alkalinity from spring to summer reflects a diminished buffering capacity, potentially due to acidifying runoff or dilution by rainfall. 54 Similarly observed reduced alkalinity under high precipitation conditions. Conversely, TH increased slightly, likely due to the accumulation of calcium and magnesium ions via evaporation or geological leaching during hot seasons, 19 which may affect the suitability of water for domestic and agricultural uses.
The observed rise in Na+ and NO₃− levels toward autumn highlights the influence of anthropogenic sources such as fertilizer runoff and RWW discharges. These trends mirror findings by Lencha et al. 55 and Negm et al. 56 and raise concerns about potential risks to soil structure (from Na+) and eutrophication (from NO₃−). Moderate increases in P-PO₄³− and NH₄+ support this interpretation, indicating persistent nutrient loading possibly linked to suboptimal treatment or agricultural return flows, as also reported by Dobbin et al. 8
DO levels showed a mild decline from spring to autumn, a pattern likely driven by increased biological activity and oxygen demand under warmer conditions. This is in line with Benites-Alfaro et al. 57 and Putro and Hadiyanto, 58 who noted that oxygen solubility decreases with rising temperature, especially in nutrient-rich waters. COD increased during autumn, signaling greater organic pollution, while BOD5 remained relatively stable, which may reflect a balance between input loads and microbial degradation efficiency.
Other parameters such as pH, calcium, magnesium, sulfates, and salinity showed relatively minor seasonal variations. This chemical stability may be attributed to buffering processes or steady GW inputs, as suggested by Loucif and Chenchouni, 46 which help maintain equilibrium despite external stressors. When comparing the different water sources, distinct trends emerge that align with their respective origins and treatment levels. The elevated temperatures recorded in OSW, for example, result from direct solar exposure in open channels, unlike GW and TWW, which benefit from subsurface insulation or temperature control during treatment. 12
The more basic pH in RWW is likely due to the presence of alkaline substances, such as detergents and industrial effluents, while TWW and GW show moderated pH levels maintained through chemical conditioning. 59 Higher EC values observed in GW and RWW indicate a greater concentration of dissolved ions, either from mineral-rich formations or pollutant infiltration. In contrast, lower EC values in OSW and TWW reflect better salinity control through natural dilution and treatment efficiency. 8
TSS levels were especially high in RWW and OSW, pointing to limited filtration and significant surface runoff contributions, consistent with Moussaoui et al. 60 Alkalinity was notably higher in TWW, likely a result of pH stabilization efforts during the treatment process. 61 GW samples exhibited the highest hardness values, attributable to carbonate rock dissolution, while OSW and RWW showed more variable hardness due to mixed sources of contamination. Fluctuations in calcium and sulfate concentrations in GW reinforce the geogenic origin of many dissolved constituents, whereas high Na+ levels across all sources particularly in OSW underscore the impact of anthropogenic activities such as wastewater reuse and fertilizer leaching. 9 Elevated levels of NO₃− and NO₂− in OSW and RWW further reflect agricultural runoff and insufficiently treated discharges, 62 especially during rainy seasons that promote infiltration. Similarly, PO₄³− accumulation in RWW and OSW is associated with household and agricultural waste inputs, as seen in Bisimwa et al. 63
The consistently low DO levels in RWW are indicative of intense microbial decomposition, while high COD and BOD5 confirm significant organic pollution.7,12,53 Elevated salinity in RWW and OSW suggests both geogenic and anthropogenic influences, with relatively stable seasonal trends pointing to persistent pollution sources rather than climatic fluctuations. 64
The calculated WQI values exhibited distinct spatial and temporal variations, reflecting both seasonal influences and the inherent characteristics of each water type. OSW registered the highest WQI values during summer, likely due to reduced river flow, elevated temperatures, and evaporation-driven concentration of pollutants. 65 In contrast, the relatively lower WQI values observed in spring and autumn may be attributed to increased dilution from rainfall and reduced agricultural activity. However, the absence of statistical significance across seasons suggests that these variations require further investigation through longer-term monitoring.
RWW consistently exhibited poor WQI values throughout the study period, directly reflecting its untreated nature and high organic and chemical pollutant loads. This finding aligns with previous studies such as Ustaoğlu et al., 66 which highlighted the elevated risk of pollution in untreated municipal effluents. GW, on the other hand, maintained consistently low WQI scores, with limited seasonal fluctuation. Its relative stability is likely due to natural subsurface protection, although minor increases during the rainy season may indicate infiltration of contaminated surface water. 67 TWW showed a more moderate and stable profile, with slightly better WQI values during winter. However, the variations observed were not statistically linked solely to the treatment process, implying that residual contamination, operational variability, or seasonal fluctuations in influent quality may also play a role.
Seasonal trends in WQI classification offer further insight. Spring emerged as the season with the highest proportion of samples classified as good quality, likely due to lower runoff and reduced pollutant input during dry conditions. 68 In contrast, water quality declined during winter, with a higher percentage of samples classified as questionable or unsuitable possibly due to accumulation of pollutants and reduced microbial degradation at lower temperatures. 69 GW maintained consistent good-quality ratings, while OSW showed greater vulnerability to diffuse pollution from agriculture and surface erosion. 70 As expected, RWW was consistently classified as unsuitable for use, whereas TWW showed marked improvements, with most samples meeting good-quality criteria following treatment.
The PCA revealed strong associations between specific water quality parameters and WQI scores, underscoring the interdependence of organic and inorganic pollution indicators. Nitrogen-based compounds (NO₃−, NO₂−, and NH₄+) showed strong positive correlations with BOD5 and COD, confirming their role as reliable markers of organic pollution primarily from domestic wastewater and agricultural runoff. 7 Salinity-related parameters including EC, Na+, Cl−, and SO₄²− also clustered together, indicating shared sources such as geological inputs and the reuse of TWW for irrigation. 34 In contrast, divalent cations such as Ca²+ and Mg²+ exhibited limited contribution to overall variance, likely due to their more stable behavior across sites. Notably, NO₃− and Pt were closely associated with RWW and OSW, emphasizing the persistent vulnerability of these water types to nutrient and organic contamination, particularly in regions influenced by agricultural and industrial activities. 37 Together, these findings highlight the utility of WQI as an integrative tool that synthesizes complex water quality data and supports informed decision-making. The multivariate analysis reinforces that both natural and anthropogenic factors contribute to water quality degradation, and that comprehensive monitoring—especially in transition zones such as surface water bodies is essential for effective management.
Bacteriological analysis revealed clear spatial and seasonal variations among the water types. RWW exhibited the highest concentrations of bacterial indicators including TC, FC, FS, and SRC primarily due to the absence of treatment and the discharge of untreated domestic and industrial effluents.5,62 OSW showed elevated bacterial levels, albeit lower than RWW, likely due to surface runoff and the proximity of urban settlements. 71 In contrast, TWW demonstrated significantly lower bacterial loads, reflecting the effectiveness of disinfection and filtration processes within the treatment system. 72 Seasonal trends were evident, with bacterial concentrations peaking in summer, driven by elevated temperatures that favor microbial proliferation, while winter conditions suppressed bacterial activity. 50 GLM results confirmed statistically significant increases in all bacterial groups in RWW (p < 0.001), particularly during the warmest months. 73
Strong correlations were observed among the bacterial indicators, suggesting shared sources of fecal contamination. TC was highly correlated with both FC and FS (p < 0.001), indicating a likely common origin such as domestic wastewater discharges. 74 FS also showed significant associations with SRC and TAMB, which are typically favored by organic matter-rich environments.52,75 These interrelationships point to eutrophic conditions and anthropogenic inputs, particularly from agricultural and household sources.
The relationship between bacterial indicators and the WQI further emphasized the complexity of microbial pollution. In OSW and TWW, TC levels were relatively comparable, though slightly lower in TWW, likely due to treatment. RWW showed markedly higher TC and FC values due to direct exposure to pollution. 76 Interestingly, a weak positive correlation was found between WQI and TC, possibly reflecting the nuanced balance between physical–chemical improvements and residual microbial risks. 77 FC concentrations were consistently high in both RWW and OSW, attributed to direct fecal contamination, whereas the absence of significant FC trends in TWW reaffirms the effectiveness of treatment. FS and SRC patterns followed a similar trend, particularly in RWW, where higher WQI scores still coincided with notable fecal contamination. 62 Lastly, TAMB showed a significant correlation with WQI in surface water, suggesting that better oxygenation and moderate nutrient levels support the proliferation of aerobic heterotrophic flora. 78 In summary, WQI proved to be a valuable complementary tool for understanding bacteriological variation in OSW and RWW, although its sensitivity is limited in TWW due to the success of treatment processes in suppressing microbial contaminants.
This study has some limitations. First, no formal a priori sample size calculation was performed, which may affect the statistical power and the ability to detect smaller differences between water types or seasons. Second, the number of bacteriological samples was limited to seasonal points, which may reduce the resolution of microbial dynamics across months. Third, although the study covered a full annual cycle, variations across multiple years were not assessed, limiting the generalizability of the results to other climatic or hydrological conditions. Finally, logistical constraints influenced the frequency of some measurements and access to certain sampling locations. Despite these limitations, the study provides valuable insights into water quality dynamics in semiarid regions and forms a basis for more extensive future research.
Conclusion
This study offered a comprehensive evaluation of the physicochemical and bacteriological quality of four types of water RWW, TWW, OSW, and GW in the semiarid region of Ain Beida. The results clearly demonstrated the effectiveness of wastewater treatment in significantly reducing microbial contamination, particularly TC and FC, with TWW achieving near-compliance with international standards. In contrast, RWW exhibited high pollutant loads, underscoring the risks associated with untreated discharges. Physicochemical parameters revealed notable spatial and seasonal variations, especially in OSW, which was highly sensitive to summer conditions and anthropogenic influences such as agricultural runoff. The WQI proved to be an effective tool for synthesizing water quality data: TWW consistently fell within the “excellent” category, while RWW was deemed unsuitable for any use. GW generally maintained good quality but showed signs of occasional contamination, requiring continuous monitoring. This research contributes novel insights into the seasonal dynamics and spatial variability of water quality in northeastern Algeria, with particular emphasis on the role of advanced wastewater treatment systems. It highlights the urgent need to strengthen water quality management for surface and GW resources, particularly during vulnerable periods. The findings support the integration of TWW into local irrigation strategies, while emphasizing the importance of regulatory oversight and long-term monitoring to ensure environmental sustainability and public health protection.
Footnotes
Abbreviations
Acknowledgements
We thank Mr Rafik Ilihoum and Mr Hamza Bougoufa (Ain Beida wastewater treatment plant, National Sanitation Office) for their invaluable support and assistance in carrying out this research.
ORCID iDs
Ethical considerations
This is not an animal/human study.
Author contributions
Funding
The authors received no financial support for the research, authorship, and/or publication of this article.
Declaration of conflicting interests
The authors declared no potential conflicts of interest with respect to the research, authorship, and/or publication of this article.
Data availability statement
The datasets used and/or analyzed during the current study are available from the corresponding author upon reasonable request.