
Abstract
Measuring the low carbon performance of buildings is a crucial method for achieving the construction industry's strategic goal of “double carbon.” The carbon emission factor calculation approach proposed by the IPCC is utilized to create a carbon emission calculation model for a steel-concrete composite structure bridge across its whole life cycle. The discount rate is used to determine the dynamic carbon emissions of the steel-concrete composite structural bridge, which are then compared to the static carbon emissions. The carbon strength of the bridge is evaluated using a fuzzy comprehensive technique. The application analysis is conducted on the basis of a steel-concrete composite construction bridge in Beijing. According to the findings, carbon emissions are primarily concentrated during the preparation, production, and operation of building materials. The bridge's static and dynamic carbon emissions are 103.966 and 1378.674 ktCO2e, respectively. After material recovery, the values are 95.141 ktCO2e and 1107.751 ktCO2e, respectively. The ratio of dynamic and static carbon emissions ranges from 7 to 34, highlighting the significance of temporal value. After recycling the components, the bridge's static carbon strength dropped from 2.565 to 2.353, while its dynamic carbon strength fell from 2.422 to 2.210, both of which were medium carbon strengths. The model proposed in this study can successfully examine the carbon emissions and strength of bridges from both environmental and economic perspectives, and it can be used to select more environmentally friendly building materials and construction methods to increase bridge efficiency. It also provides valuable data assistance for the establishment and execution of environmental protection measures, thereby promoting the industry's long-term sustainable development.
Keywords
Introduction
The current rate of global warming is unprecedented, 1 and the construction industry accounts for 21% of total greenhouse gas emissions, or around 9.8 GtCO2e. 2 In recent years, China has continued to invest and grow quickly in construction infrastructure. 3 Given the growing number of steel-concrete composite bridges, energy conservation and emission reduction efforts are underway, and a carbon emission intensity calculation model and thorough evaluation index for such bridges have been developed. The development of green transportation results in internal management and reduction of external carbon emissions in the transportation business, as well as feedback on green design and manufacture across the entire industry. 4 The transition from a high-carbon industry to a strategic emerging industry is beneficial to the building industry's ability to accomplish the goals 5 of “carbon peak” and “carbon neutralization,” allowing world temperatures to remain within the 1.5 °C rise barrier. 6
Environmental effect and economic feasibility should be taken into account while assessing the bridge's sustainability. 7 Huber et al. used life cycle assessment (LCA) to calculate the carbon emissions and pricing of four different bridge maintenance and reinforcement methods while taking inflation into account. 8 Xia et al. assessed carbon emissions from steel bridges, included the idea of dynamic LCA, and examined the impact of different time periods on carbon intensity. 9 Liu et al., substituting the discount rate, estimated the expected values of carbon dioxide emissions and carbon emission intensity (kg/yuan) of China's bridges in the next 20 years, investigated the gap between the 2040 targets, and developed emission reduction targets. 10 Peng provided a framework to minimize the economic, social, and environmental advantages while taking the discount rate into account in order to maximize the long-term development of bridge maintenance. 11 Martínez-Muñoz evaluated the LCA and economic impact of building activities for concrete and steel-concrete composite bridges with the same span to determine their sustainability. 12
Given the ambiguity of the grade data for low-carbon bridges, the fuzzy comprehensive evaluation method is employed to convert the qualitative evaluation into quantitative evaluation via the membership degree of fuzzy mathematics. Zhang et al. used the analytic hierarchy process to calculate the road transportation index, the fuzzy comprehensive evaluation method to assess the low-carbon level of road transportation, and the low-carbon development of Shanghai's road network as “good” or “general.” 13 Zhu et al. used the fuzzy comprehensive evaluation approach and linear programming to assess and evaluate emission reduction solutions in public buildings based on three aspects: contribution, carbon emission intensity, and economic impact. 14 Zhou et al. analyzed the carbon emission and rating of the whole stage of the bridge by using the whole life carbon emission software and Yates higher fuzzy mathematics theory. The contribution of the operation and maintenance stage to the environmental emission reached 55.57%, which was rated as “significant effect” on the environment. 15 Niu et al. investigated overall carbon emissions, per capita carbon emissions, and per capita living carbon emissions using a fuzzy comprehensive algorithm to develop a low-carbon environmental protection economic system. 16 The research findings can serve as theoretical foundation for the development of regulations and emission reduction policies based on energy conservation and reduction.
In conclusion, the life cycle theory 17 states that the steel-concrete composite structure bridge has five stages: design, construction, operation and maintenance, building material preparation and manufacturing, and removal and treatment of construction scrap.18,19 The carbon emission is computed using the cash flow theory and the five-carbon footprint sources of material consumption, transportation, construction machinery, operation machinery, and office space. The carbon footprints of every phase of the steel-concrete composite structure bridge are abstracted into carbon emission flow values, considering the impact of time value. Static and dynamic carbon emission flow values are then calculated, accounting for the recycling of certain elements. 20 The multi-level fuzzy thorough assessment21,22 of the steel-concrete composite structure bridge is conducted using the fuzzy analytic hierarchy technique, taking into account both the overall construction cost and the flow of carbon emissions.
The goal of this research is to assess the sustainability of steel-concrete composite bridges using LCA and fuzzy comprehensive evaluation techniques. To attain this goal, it is anticipated that the bridge's service life reaches its design life of 100 years, and that all replaceable components be replaced on a regular basis. The anti-collision guardrail is replaced once, whereas the bridge deck pavement, expansion device, and steel bearing are replaced six times. This page solely discusses the primary building materials, such as steel, concrete, and asphalt. 23 According to the full life cycle theory, 24 the steel-concrete composite structure bridge has five stages: design phase, building materials preparation and production phase, construction phase, and operational maintenance phase.25–27 Carbon emissions are calculated using the five carbon footprint sources: material consumption, transportation, construction machinery, operating machinery, and office space. The cash flow theory calculates carbon emissions without taking the discount rate into account, resulting in static carbon emissions. Taking into account the influence of time value, the carbon emissions of each stage of the bridge are abstracted into carbon emission flow value, also known as dynamic carbon emissions, and the recycling of some materials is considered when calculating the environmental impact of bridge building. To assess the carbon emission intensity of the case bridge, a multi-level fuzzy comprehensive evaluation of the bridge low-carbon strength index is conducted using fuzzy mathematics. In summary, the goal of this research is to assess the environmental performance index of steel-concrete composite bridges from both an environmental and economic standpoint, as well as to compute and empirically analyze actual situations in order to achieve sustainable bridge building.
Carbon strength index of steel-concrete composite bridge
Definition of carbon emission flow intensity
To objectively evaluate the carbon emission of a steel-concrete composite structure bridge, the static and dynamic carbon emissions corresponding to unit project cost are defined as static and dynamic carbon intensity indexes, respectively.
Carbon emission flow model
The following is the equation (1)
19
procedure for the steel-concrete composite bridge's static carbon emission: (1) Carbon emissions during the design phase are calculated (2) Carbon emissions during building materials preparation and production stage (3) Calculation of carbon emissions in construction stage
Equation (2)
19
shows that throughout the design phase, office space energy usage accounts for the majority of carbon emissions.
Carbon emissions from material manufacture and transportation to the construction site are contained in the stage of preparation and production of building materials.
29
Table 1 can be obtained by referring to the “Building Carbon Emission Calculation Standard” GB/T 51366-2019 Specification
30
for the carbon emission factors for the manufacture of building materials in equations (3) and (4).
19


Carbon emission factors in the primary raw material production process.

Note: The carbon emission factors of C20 and C40 concrete are derived using the linear interpolation approach.
Carbon emissions that occurred during the construction phase are mostly caused by two factors: one of which is the usage of construction equipment, and the other is office-related activities related to the construction process.
31
The following are the carbon emissions during the building phase (5).
19
(4) Calculation of carbon emissions in the operation stage (5) Calculation of carbon emissions in the scrapping stage of demolition
Bridge carbon emissions during operation include carbon emissions from frequent bridge repair, carbon emissions from building materials and equipment, and carbon emissions from road lights and cars on the bridge.
32
Equation (6) displays the phase's carbon emissions.
The main origins of carbon emissions throughout the demolition and scrapping phase are the construction waste transportation process and the operation of demolition machinery.
33
The following are the carbon emissions at this stage (7).
33

Dynamic carbon emission flow model
The steel-concrete composite bridge's dynamic carbon emission flow value
34
is computed using the following method (8).
35

Comprehensive evaluation model of carbon emissions intensity index
Establish alternative set and construct membership function
The evaluation factors are determined by looking at the carbon emission of the steel-concrete composite bridge across its whole life cycle using the fuzzy comprehensive hierarchy technique. To estimate the varied carbon emission intensity of the bridge, the evaluation factors of each layer are determined by the evaluation factors of the lower layer. The evaluation factors of the entire process are divided into n distinct subsets v. Therefore, the bridge state is divided into low carbon intensity m1, lower carbon intensity m2, medium carbon intensity m3, higher carbon intensity 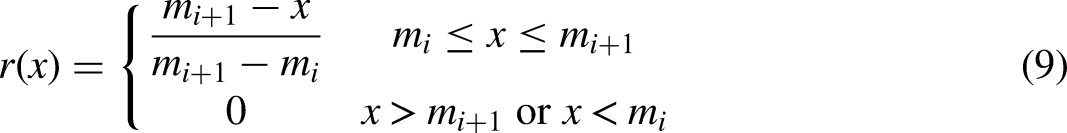

Weight determination of evaluation factors
Judgment matrix A
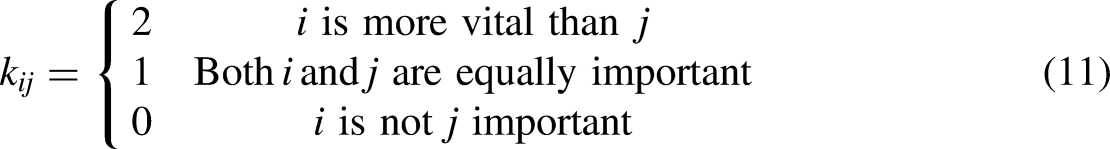
To assess the pairwise significance of every assessment element at the same level, the comparison matrix K is created,
35
and the matching judgment matrix A is created. The following formulas (11), (12), and (13) are used to generate the matrix of judgment and determine the magnitude of the assessment element.
36


Advanced matrix D
The judgment matrix is normalized by the row vector, such as formula (14),
35
that is, the element value of each row in the matrix is divided by the sum of the rows, so as to standardize the weight.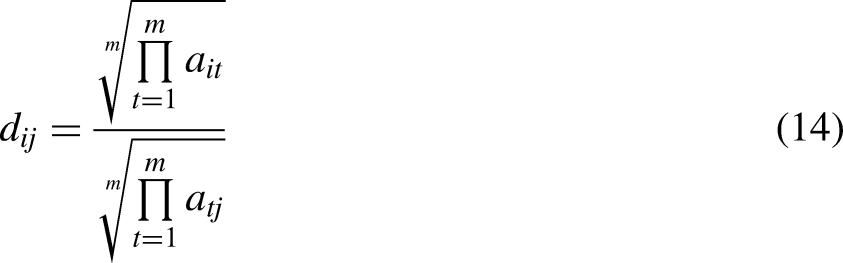
Evaluation factor weight
Find the independent weight value for each evaluation index, such as equations (15) and (16),
35
and standardize it so that the total of the weights equals.

Multi-level comprehensive evaluation model of carbon intensity index
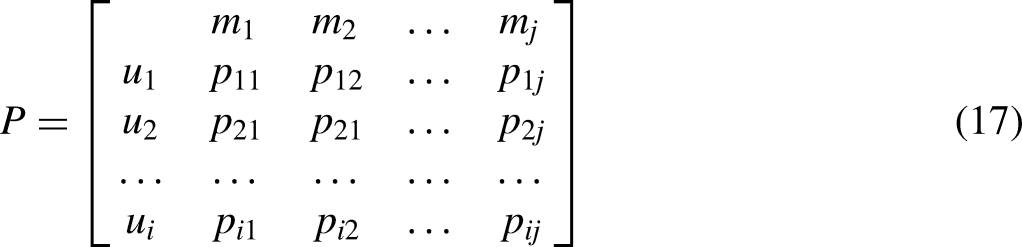
The relationship matrix P is constructed,
36
which includes the relationship between the evaluation factor V and the alternative scheme M, such as equation (17), and the fuzzy evaluation is calculated as equation (18).
36

Assessing indicators
Using the stage of the bridge's entire life cycle as the index category, five first-level evaluation indexes are developed to assess the bridge's low-carbon level. According to the aforesaid method, 13 secondary evaluation indices are generated based on the various types of carbon emissions in each stage, as illustrated in Table 2.
Life cycle carbon strength index list of steel-concrete composite bridge.

Secondary evaluation
The secondary weight set Wi of the bridge can be found using Formulas (11) through (16). According to the carbon intensity of each stage of a bridge in Beijing, the second-order fuzzy relation matrix Ri is established by equation (17). Calculate the second-level comprehensive evaluation vector B as follows (21). The second-level evaluation score Li as follows (22):
36


Overall merit
The bridge's first-level weight set C is determined using Formulas (11) through (16). The first-order fuzzy relation matrix is defined using the second-order evaluation vector, and the matrix P is created through combination. Formula (21) illustrates how the first-level fuzzy evaluation vector S is calculated. The steel-concrete composite bridge shown in type (22) has a first-level comprehensive score of μ, indicating its low carbon level.

Case analysis
Carbon emissions calculation
This research uses a steel-concrete composite girder bridge in Beijing as an example to determine the life cycle strength index, static carbon emission, and dynamic carbon emission. The reuse of resources like steel is taken into account when preparing and transporting building components. 37
Table 3 displays the statistics of various materials and energy at each step based on the bridge's design and construction data, a list of on-site construction machines, and the design traffic volume. Table 4 illustrates the carbon footprint of various carbon emission sources at each stage of the bridge's life cycle in Beijing, while Table 5 displays the carbon intensity index for the bridge's whole life cycle. These computations rely on statistical data (Figure 1).

Life cycle carbon emissions of a steel-concrete bridge in Beijing. Note: The blue data in Figure (1) is the dynamic carbon emission flow value, and the black data on the upper side is the static carbon emissions.
List of life cycle materials and energy of a bridge in Beijing.

Life cycle carbon emissions of a bridge in Beijing.
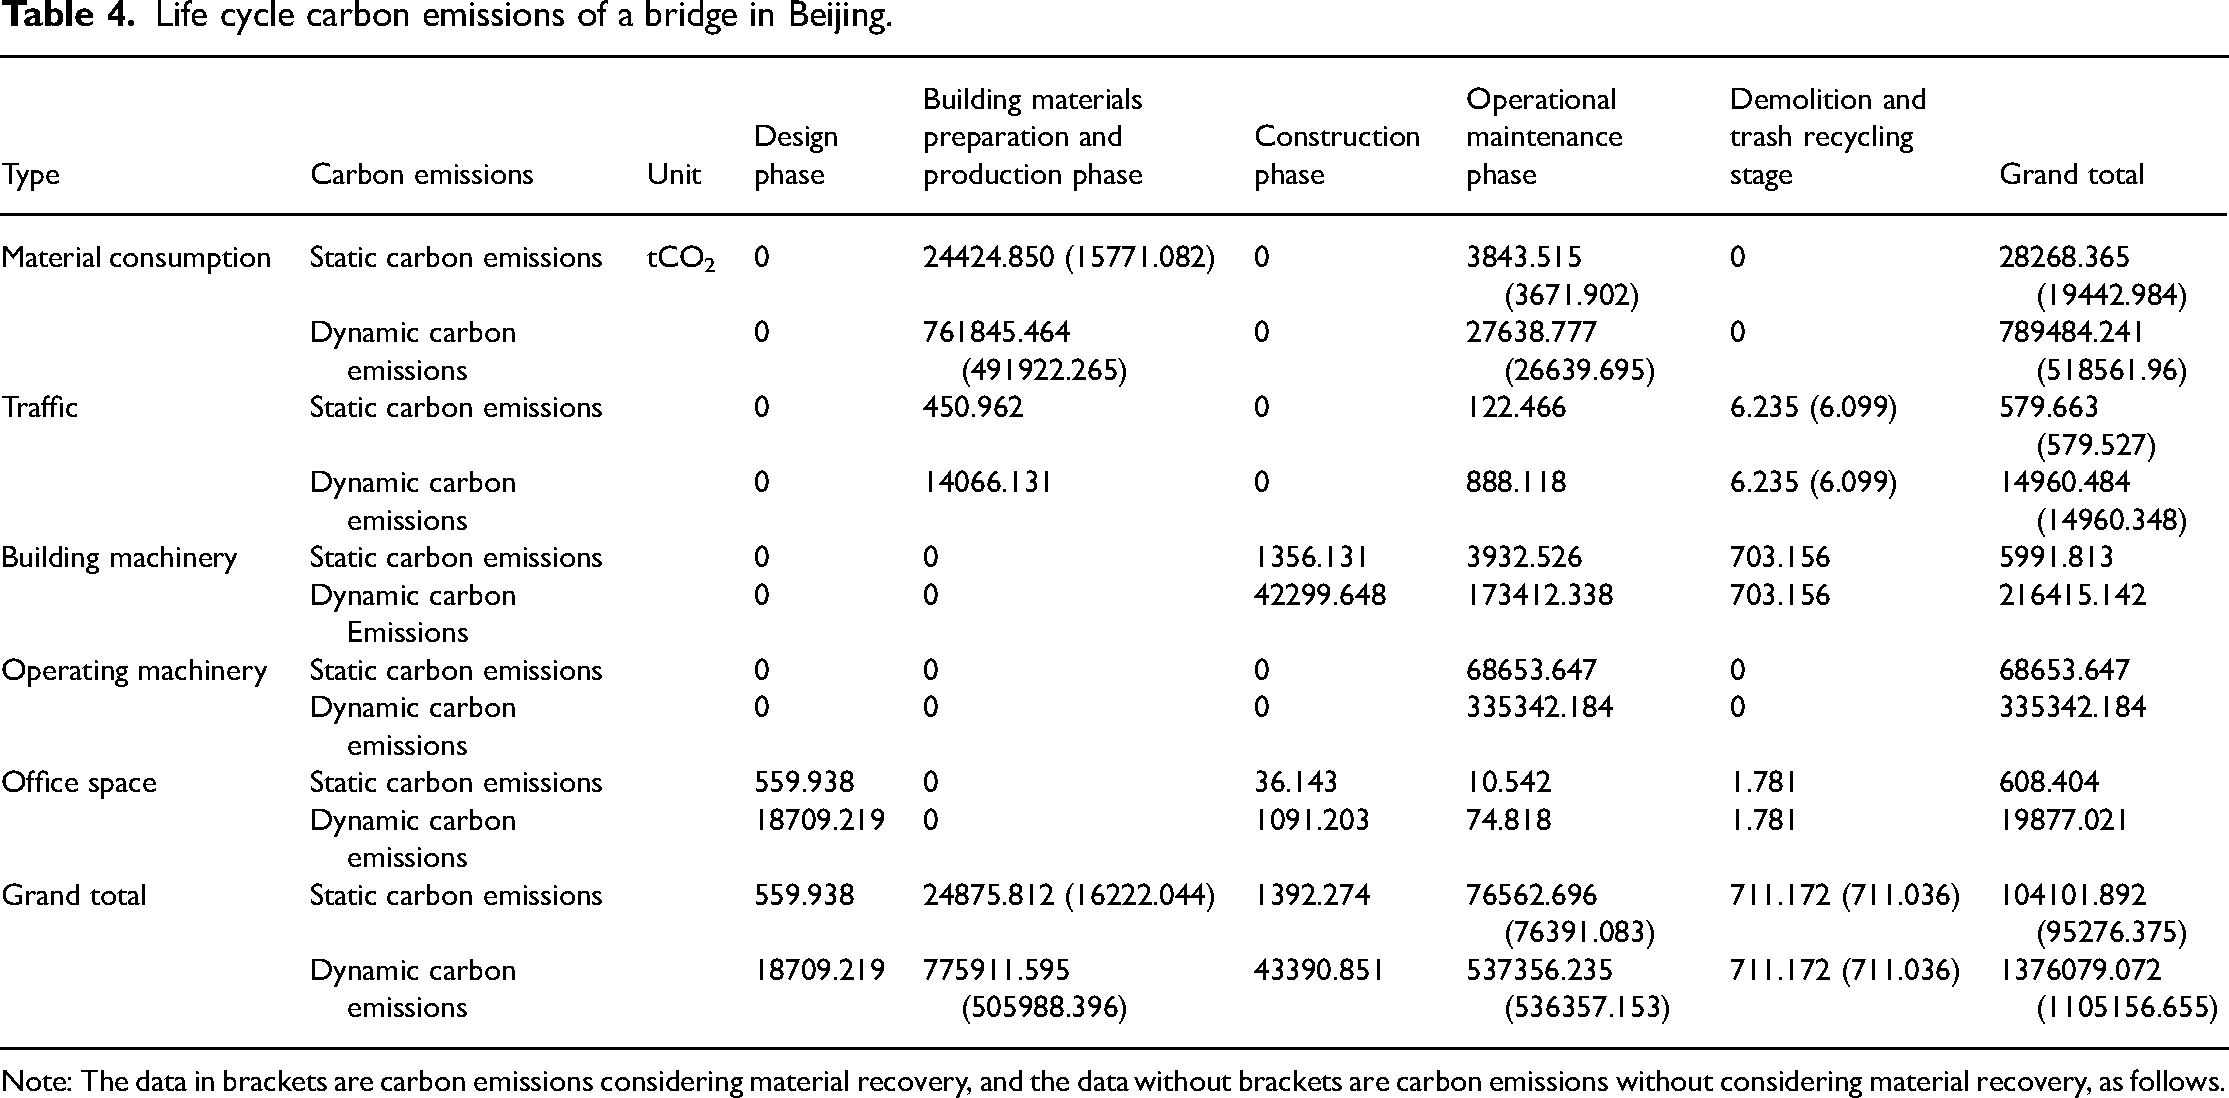
Note: The data in brackets are carbon emissions considering material recovery, and the data without brackets are carbon emissions without considering material recovery, as follows.
Statistics of life cycle carbon intensity index of a bridge in Beijing.

Recycling bridge building materials is a key strategy for creating low-carbon and sustainable buildings. The carbon emissions of a bridge in Beijing over its complete life cycle, without taking into account the influence of time value, are 104.102 ktCO2e and 95.276 ktCO2e without recycling materials and recycling materials, respectively. A bridge in Beijing has carbon emissions of 1376.079 ktCO2e with time value taken into account, and 1105.157 ktCO2e with recycling materials and without recycling materials. By comparing the carbon emissions, it is evident that material recycling lowers both the static and dynamic carbon emissions from the raw material preparation and transportation stages, from 24.876 ktCO2e to 16.222 ktCO2e and 775.912 ktCO2e to 505.988 ktCO2e. The carbon emissions during the phase of abandonment range from 711.172 tCO2e to 711.036 tCO2e. Since this is the final stage of the cycle, the effect of time value on carbon emissions in this stage is not taken into account. The bridge has significantly decreased its overall carbon emissions as a result of material recycling, particularly steel recycling.
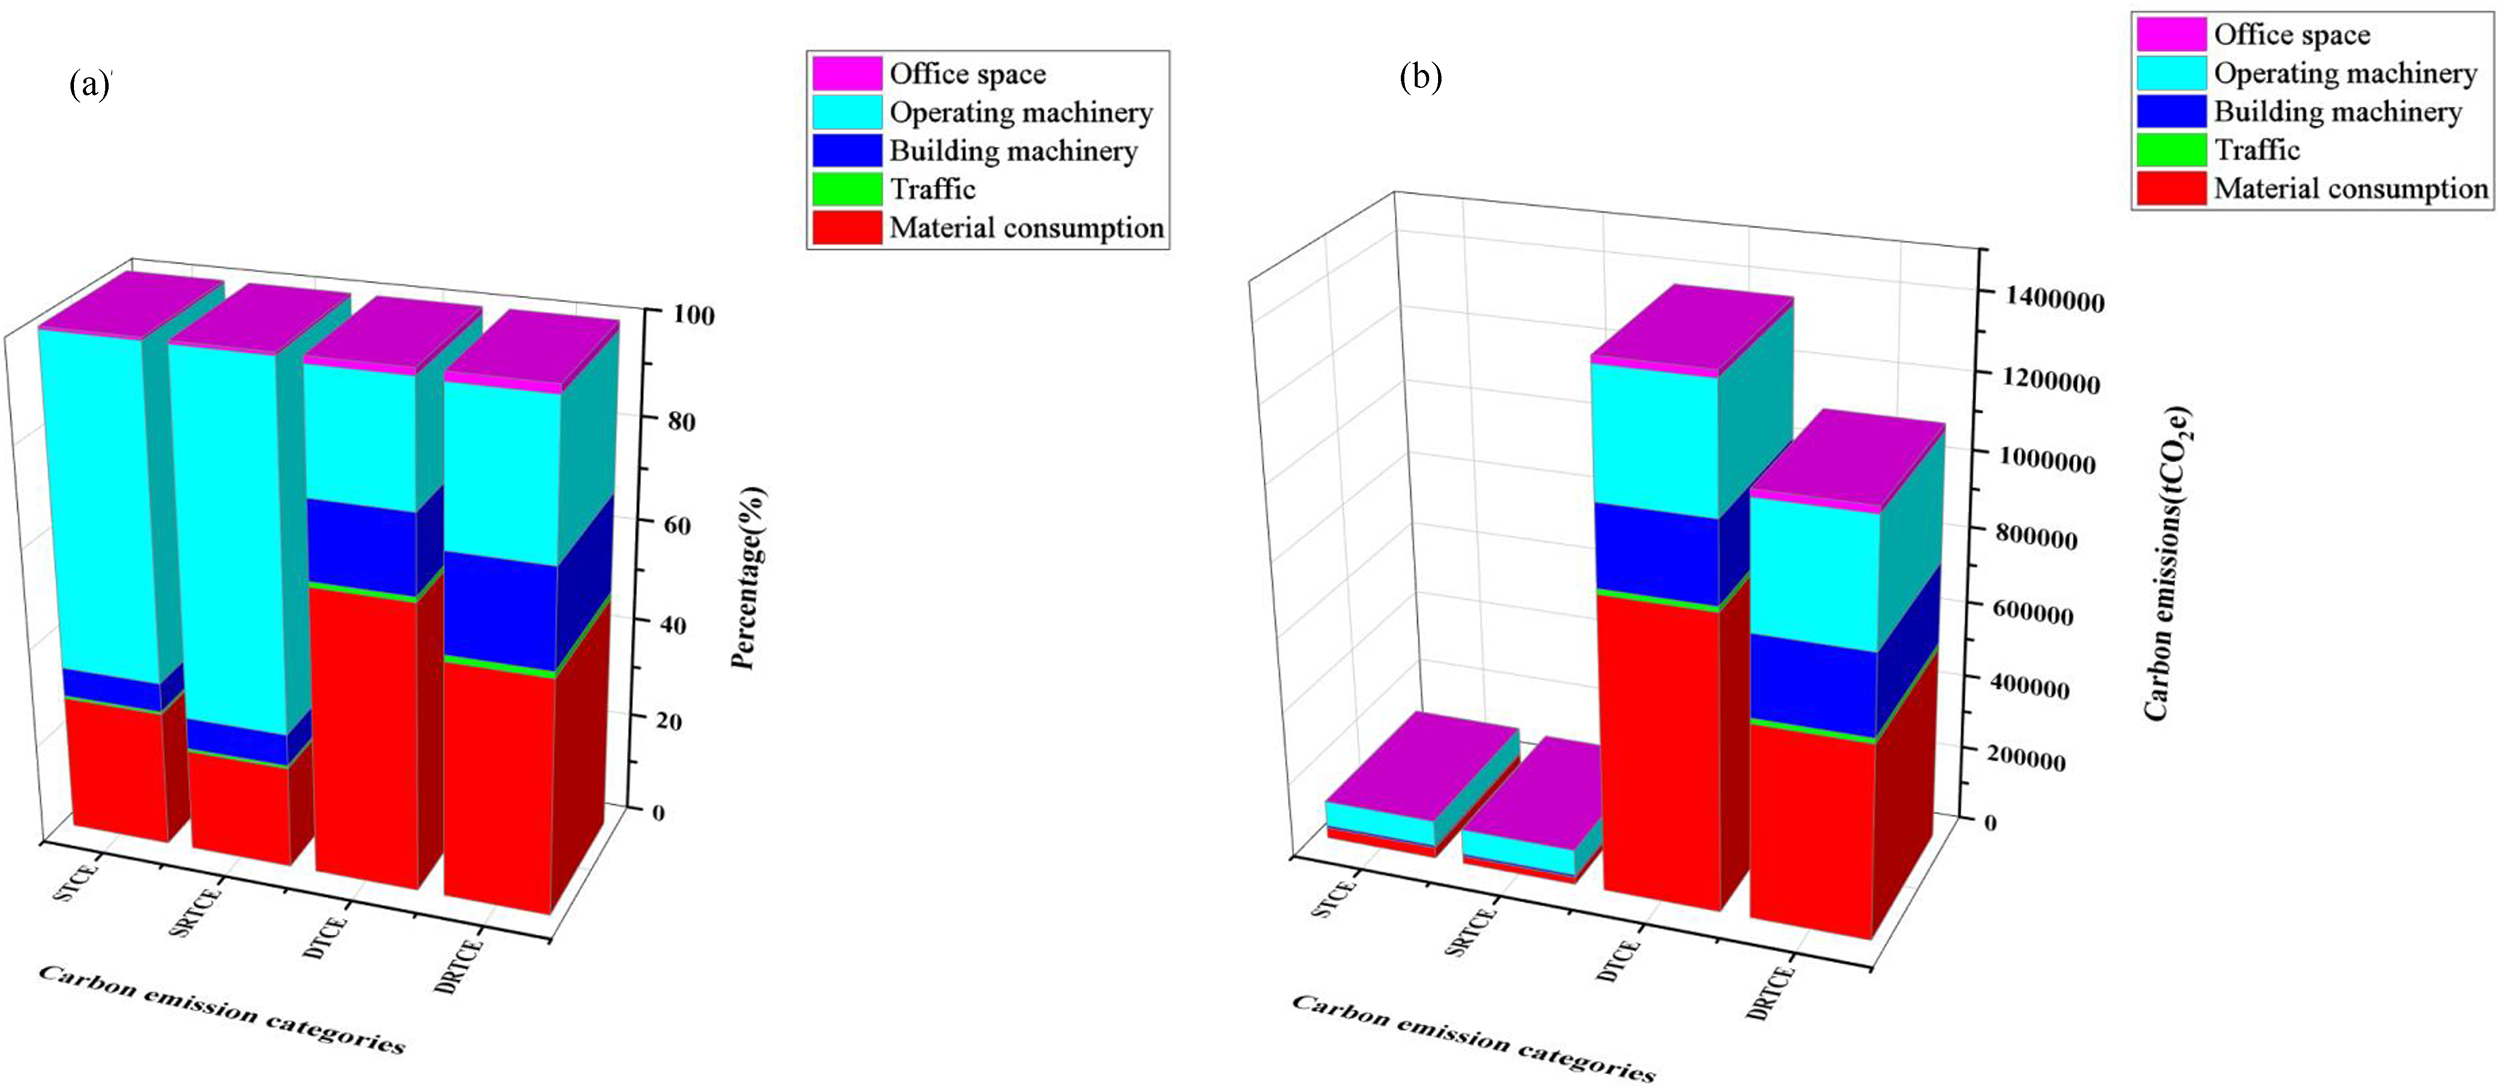
Figure 2 depicts the carbon emission and carbon emission ratio for the design stage, the building materials preparation and production stage, the construction stage, the operation stage, and the demolition and trash recycling stage of the case bridge using the four carbon emission categories of static total carbon emission (STCE), static recovery total carbon emission (SRTCE), dynamic total carbon emission (DTCE), and dynamic recovery total carbon emission (DRTCE). Figure 3 depicts the carbon emissions and carbon emission ratios of various sources, including office space, operation machinery, construction machinery, transportation, and material consumption, across four carbon emission categories: STCE, SRTCE, DTCE, and DRTCE of the case bridge. Essentially, materials that have a substantial impact on carbon emissions can be reduced by using less of them or using more environmentally friendly low-carbon materials. 38

Carbon emissions in different stages of different carbon emissions categories. (a)The proportion the bridge of carbon emissions in each stage of cycle between static and dynamic carbon emission categories. (b) The carbon emissions at every stage of the static and dynamic carbon emission cycle.
Various sources of carbon emissions in different carbon emissions categories. (a)The percentage of carbon emissions from carbon sources in the dynamic and static carbon emission categories. (b) The dynamic and static carbon emissions from various carbon sources.
The project's energy consumption structure includes 79808.549 MWh of electricity, 499.826 t of diesel, and 2182.422 t of gasoline. In short, carbon reduction efforts at this stage should focus on the building's machinery, such as rollers, crawler excavators, truck cranes, cargo machines, and power equipment. The government promotes construction enterprises to employ low-carbon machinery such as electric or hybrid machinery, as well as to alter machinery's energy use to make it more efficient and low-carbon. 39
Comprehensive evaluation of bridge carbon strength grade
Secondary weight set W
Equations (11) through (13) show that the Beijing steel-concrete composite stage's five life cycles have the following judgment matrix:
The matching judgment matrix, as determined by formula (14) is: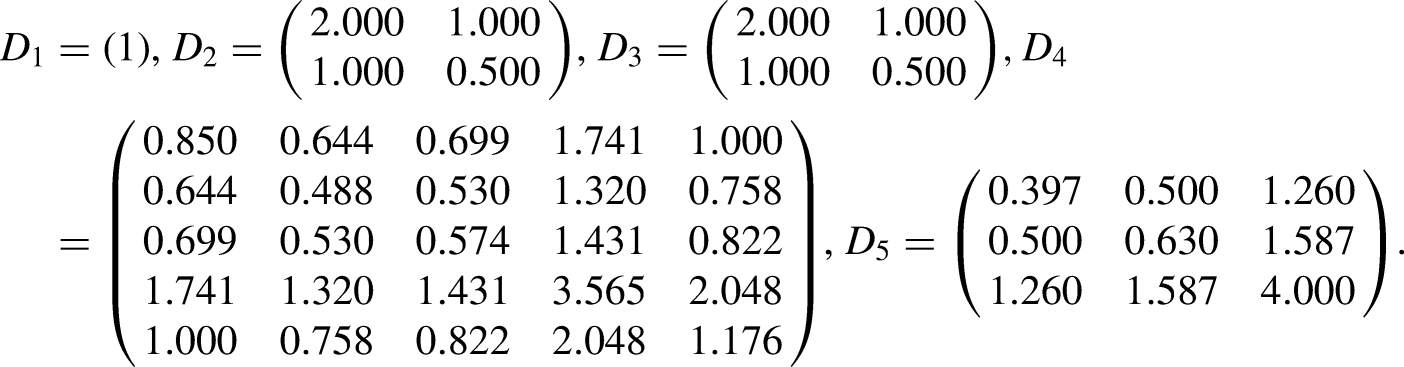

Two-level fuzzy relation matrix R
The quadratic relation matrix can be created using formula (16).
(1) Design phase (2) Building materials preparation and production stage (3) Construction phase (4) Operational maintenance phase (5) Demolition and trash recycling stage
Time value and material recovery are not taken into account: 
This stage does not involve material recovery, so consider the value of time:
Time value and material recovery are not taken into account:
Material recovery is not considered:
The second-level comprehensive evaluation vector B
Equation (21) gives us the second-level complete evaluation vector.
(1) Design phase (2) Building materials preparation and production phase (3) Construction phase (4) Operational maintenance phase (5) Demolition and trash recycling stage
The static and dynamic evaluation vectors of non-recycling raw materials: 
Regardless of whether recycling or time impact is considered, the evaluation vector at this stage is
Time value and material recovery are not taken into account:
Material recovery is not considered
Figure 4 shows the carbon intensity indicators for multiple carbon emission categories at different stages.

Carbon intensity indexes of different carbon emissions categories at different stages.
The comprehensive score of secondary evaluation
According to the formula (22), the carbon emission intensity in the design stage is 2.421, which is a medium carbon emission intensity; in the raw material production and transportation stages, the static and dynamic non-recycling carbon emission intensity is 2.862, and the static and dynamic recycling carbon emission intensity is 2.090, both of which are medium carbon intensity levels. In the building stage, the carbon emission intensity is 2.404, which is considered medium. During the operation stage, the static recovery and non-recovery is 2.509, while the dynamic recovery and non-recovery is 2.211. The waste stage ignores the impact of time value, does not recover the carbon emission intensity of 2.199, and recovers the carbon emission intensity of 2.207, which is medium carbon intensity.
First-level weight set
Applying the analytic hierarchy process, by determining the weight of the evaluation factor, the comparison matrix
First-order fuzzy relation matrix R
The second-level evaluation vector is used to define the first-level fuzzy relation matrix. Static non-recovery correspondence:
Considering the recycling of waste, without considering the influence of time:
First-level comprehensive evaluation vector S
Formula (23) does not take into account material recovery or time value:
First-level comprehensive score
Equation (24) is used to calculate bridge carbon strength when material recovery and time value are not taken into account during the lifecycle. When time value and material recovery are not considered, the comprehensive score of bridge carbon strength is

Low carbon level under different calculation of carbon emission categories.
The primary purpose of the sustainable bridge construction idea is to foster harmonious economic, social, and environmental development. Recycling and reusing construction waste can effectively reduce the bridge's carbon emissions and environmental impact, without the need for large financial resources to compensate for the damage caused by the bridge construction to the city and the surrounding ecological environment; this also helps to reduce resource over-exploitation and use, promoting the implementation of energy-saving and environmental protection construction models.40,41
Conclusion
A Beijing bridge's life cycle carbon emission flow is computed using the cash flow and life cycle theories. The following results are reached after a quantitative analysis of the carbon intensity using the fuzzy comprehensive evaluation theory.
According to the four different carbon emission calculations of static non-recovery, static recovery, dynamic non-recovery, and dynamic recovery, the proportion of total carbon emission flow in building materials preparation and production is 23.89%, 17.03%, 56.39%, and 45.78%, respectively, and the proportion in operation is 73.55%, 80.18%, 39.05%, and 48.53%. Carbon emissions are considerable throughout the operation period, particularly due to bridge traffic. A Beijing bridge's total value of dynamic carbon emissions (recovery or non-recovery) far above its total flow of static carbon emissions. In addition to the abandonment stage, the ratio range is [7: 34], and the importance of time value should not be overlooked. When calculating the carbon intensity index, whether or not the impact of recycling is taken into account, the error between static carbon intensity and dynamic carbon intensity is less than 0.1, which intuitively reflects the fluctuation of carbon emissions during the process of economic growth and more accurately evaluates the strength of carbon emissions. Carbon emissions totaled 104.102 ktCO2 due to the high energy consumption of building material manufacturing and an energy structure dominated by fossil fuels. Because of the limited variety and low efficiency of recycled construction waste, the carbon negative value brought by recycling is only 8.826 ktCO2, indicating that the recovered carbon negative value is insufficient to offset overall carbon emissions, thus failing to achieve the strategic goal of “carbon neutrality.”
Based on the research findings and conversations, this paper makes the following recommendations about carbon reduction demand and decision-making: building materials are prepared using environmental protection construction materials and recyclable materials to reduce energy consumption and carbon emissions in accordance with design criteria. In terms of national policy formulation, encouraging the use of modern energy machinery rather than traditional fuel machinery to minimize reliance on fossil fuels benefits the environment and saves money. Improve recycling technology to increase the recycling rate of construction waste, hence increasing the negative carbon value provided by recycling.
42
Furthermore, there are currently few investigations on steel-concrete bridges. The outcomes of the analysis may be limited because it is based on current ideas and facts; therefore, extensive case studies must be conducted to further verify and optimize the findings.
Footnotes
Data availability
The data that has been used is confidential.
Declaration of conflicting interests
The authors declared no potential conflicts of interest with respect to the research, authorship, and/or publication of this article.
Funding
The authors disclosed receipt of the following financial support for the research, authorship, and/or publication of this article: This work was supported by the Natural Science Foundation of Shaanxi Province and key research and development project of Shaanxi Province (grant numbers 2024JC-YBMS-427, 2024JC-YBMS-446, and 2024SF-YBXM-618).