
Abstract
Introduction
Eye tracking has a number of clinical applications, including diagnosing neurological disorders, assessing cognitive functioning, studying attention and memory, and aiding in the diagnosis and treatment of certain mental health issues.1–3 It can also be used to monitor eye movements and diagnose conditions such as strabismus, amblyopia, and nystagmus. Additionally, eye tracking can be used to assess visual acuity, detect eye diseases, and measure hand-eye coordination. Eye tracking can be used in cognitive sciences to study attention, memory, decision-making, and problem solving.4–6
Clinically speaking, eye tracking is a relatively inexpensive tool to provide a clinical diagnosis, depending on the type of technology used and the clinical tasks it can address. For example, alexithymic patients display slower decision latencies compared to non-alexithymic subjects in a face search (e.g., the face-in-the-crowd task). 7 Crutcher et al. demonstrated the usefulness of eye tracking to assess memory function in Alzheimer's disease and to differentiate it from Parkinson's disease. 8
Another important implication of eye-tracking systems is related to human–computer interaction because some new technologies, such as cost-effective brain–computer interfaces and virtual/augmented reality applications9–11 can also be used with eye tracking. A possible branch of investigation would lie in user interface through eye movement tracking.12, 13 Such systems can be instrumental in evaluating the readability of programming code through eye-tracking studies or examining unconventional software tool usage, thereby facilitating assessments of cognitive load or the readability of tools designed for algorithm description.14, 15
Reading is one of the most common areas of the eye-tracking application. Eye movements can be good predictors of an individuals’ reading skills. Multiple studies demonstrated that there are significant differences between faster and slower readers.16, 17 Slow readers make longer fixations, shorter saccades, and more regressions than fast readers. Eye movements can also predict the presence or absence of a specific language deficit. Evidence suggests that dyslexic individuals have visual-spatial and language-processing deficits. 18 Importantly, eye movements are not the cause of these deficits, but, rather, a reflection of underlying reading problems.
There is a connection between human eye movements and attention, 19 which means that individuals usually process information they look at. Some researchers started using eye-tracking for understanding and influencing students’ learning processes. For example, it was used by capturing the attention of individuals to study the underlying mechanisms for positive learning outcomes. 20 Importantly, Mézière et al. showed that eye-tracking could predict speed and comprehension of reading better than traditional tests. 21 However, they emphasize that these eye-tracking measures are not straightforward predictors of comprehension on their own. Instead, their predictive power lies in their combined interpretation within the context of the reader's overall reading strategy and the specific demands of the text.
While eye-tracking data can provide insight into the user's focus and attention, EEG data can provide information about the user's mental state. By combining the two, researchers can gain a better understanding of how the user interacts with their environment. In this vein, Kang et al. elaborated a very precise model (the area under curve = 0.93) that permitted them to differentiate children with autistic spectrum disorder from typically developing children during face perception based on both eye movements and EEG from 62 electrodes. 22 In another study of autistic subjects, Vettori et al. found similar results suggesting a high correlation between eye movements and EEG properties. 23 Szajerman et al. also revealed a coherence between EEG and eye-tracking while watching videos. 24 Henke et al. demonstrated that distinct rhythms in EEG activity are associated with different patterns of eye movements: word-locked saccades at 4–5 Hz correlated with whole-head theta-band activity, while fixation durations fluctuated rhythmically at 1 Hz, correlated with occipital delta-band activity. 25
This study was developed to explore how eye movements and EEG activity are interrelated, whether one can be predicted from the other and which has better quality to predict reading efficiency. The aim was to test if all these measures are interchangeable, that is, practically speaking, whether we can decrease the number of measurements in, for instance, field studies. For this purpose, we measured eye movements and EEG from a limited number of leads while subjects were reading a novel. Following this, we applied several machine learning models (CatBoost, KNN, linear regression) to predict EEG from eye movements, eye movements from EEG, and reading efficiency from both biological sources.
Materials and methods
Sample
As for sample size selection, we referred to a recent meta-analysis of EEG metrics during cognitive workload, 26 which showed a mean sample size of 30 and a recent meta-analysis of eye-tracking studies on music reading, 27 where the mean sample size was 43. Therefore, our sample consisted of 40 participants (80% of females, mean age = 22.47, SD = 4.99). All of the participants were from a common sample, recruited via social networks. The inclusion criteria were normal or corrected to normal vision and the absence of any psychiatric or neurological diseases. The study was conducted in accordance with the Helsinki Declaration of 1975 as revised in 2013. Each participant signed the informed consent, and the study was approved by the HSE Committee on Interuniversity Surveys and Ethical Assessment of Empirical Research (№80, 07.02.2022). Before the beginning of the experiment, they were asked to take a test on reading efficiency. The test evaluates participants’ reading speed and comprehension quality by giving the same fragment of a text and comprehension questions to it. At the end of the experiment, they were given a reward (20 USD at purchasing power parity).
Stimuli
Participants were asked to read in Russian a fragment of the novel “Le Ventre de Paris” (by E. Zola; translated by N. Gnedina; length in symbols = 22,776). The text was presented on a tablet PC (screen size = 160 × 229 mm; line count = 26) placed in front of the participants. The design of the experiment is as follows: the first part of the fragment was presented on the screen (7 pages), followed by a 3-minute break. The participant then continued reading the second part of the same fragment (6 pages). Following the reading task, participants were administered a comprehension test designed to evaluate their understanding of the plot, characters, and the relationships between them. The test consisted of 10 multiple-choice and open-ended questions, specifically tailored to assess the following aspects of literal and inferential comprehension. Literal comprehension included questions about explicit details in the text, such as character names, settings, and key events (for example, “What is the name of the main protagonist?”). Inferential comprehension required participants to infer information that was not directly stated in the text (for example, “Why do you think Florent decided to go to the market?”). Each answer was assessed dichotomously (correct\incorrect), building a 10-point scale of comprehension. Reading speed was also measured (words per minute).
Data recording
To record the EEG data, we placed 12 electrodes located on the frontal (Fp1 and Fp2), central (C3 and C4), temporal (FT7, FT8, TP7, and TP8), and posterior (P3, P4, O1, and O2) sites with earlobe references. We used the NVX-136 amplifier (MCS, Russia) according to the international 10–20 system (sampling rate = 1000 Hz; impedance ≤10 kΩ).
Eye-tracking data were recorded using Gazepoint GP3 HD at 150 Hz. Prior to the reading task, the eye tracker was calibrated using a 9-point calibration grid. This calibration process involves having the participant fixate on a series of nine points arranged in a grid pattern on the screen. The calibration ensures that the eye tracker accurately captures the participant's gaze position across different areas of the visual field.
The text was presented on the tablet at 2388 × 1668 resolution placed on the screen of the computer in order for the experiment to be as ecologically valid as possible. Participants used a slider to read the next pages. EEG and eye-tracking data collection was synchronized using a photodiode placed on the screen. The photodiode was attached to the screen where the text was presented. The visual stimuli displayed on the screen included brief changes in luminance every minute during the task. These changes were imperceptible to the participants but detectable by the photodiode. The photodiode detected these luminance changes and generated corresponding electrical signals.
The photodiode was plugged into the EEG system as an additional channel. This allowed the EEG recording to include precise timestamps of the reading task. During data analysis, these timestamps were used to align the EEG data with the eye-tracking data, ensuring that both datasets were synchronized to the exact moments when the visual stimuli were presented and when specific eye movements occurred.
Data preprocessing
The EEG signal was processed in order to remove interference and leave frequencies related to brain activity using a 0.05–30 Hz FIR filter, after which the EEG data were divided into 10-s intervals. Then, using the yasa python library, 28 theta-, alpha- and beta-power and the engagement index as β/(α + θ) and β/α29, 30 were extracted for each epoch in each channel with the correction for a 4-minute baseline rest.
Eye artifacts, which may include noise in the EEG signal generated by both blinks and eye movements (vertical and horizontal movements) were not deleted in our study. Eye artifacts were intentionally kept in the data to maintain a stronger consistency between eye tracking and EEG recordings and to allow the data to more accurately reflect natural reading conditions. As previously demonstrated, eye artifacts interfere with EEG signals at approximately 3 Hz.31, 32 In other words, eye artifacts persisted in the EEG signal, introducing noise generally in the theta band (around 3 Hz) in the prefrontal electrodes, without affecting other bands and regions. Maintaining eye artifacts can enhance the correlation between eye-tracking data and EEG recordings. This consistency is crucial for analyzing how eye movements and brain activity interact during reading tasks.
As for eye activity features, we extracted mean, standard deviation and sum of fixation duration, and saccade magnitude (forward and regressive saccades combined) as well as the fixation number from 10-second epochs. Thus, the number of entries was 2528 that we supposed enough to test predictive models. Reading efficiency was measured as speed (words per minute) and comprehension (0–10; 10 questions = 10 points).
Prediction models
Apart from well-known KNN and linear regression models, we also applied the CatBoost Regressor. 33 This machine learning algorithm uses gradient boosting on decision trees, which improves resistance to overfitting on small datasets and also provides categorical features. CatBoost in some cases is better than similar algorithms like XGBoost and lightGBM and is not inferior to the rest. 34 As a categorical feature for the CatBoost algorithm, the ID of subjects was chosen. The predictive quality of the models was carried out using cross-validation divided into training and test sets (70/30). First, we predicted each EEG feature from the eye movements. Second, we predicted each eye movement feature from the EEG activity. Third, we predicted speed and comprehension of reading from eye movements, EEG activity and eye movements and EEG activity together. As measures of prediction quality, R2, mean absolute prediction error (MAPE) and Pearson correlation coefficients (r) between predicted and observed values were calculated. Within each correlation analysis, Bonferroni correction was applied.
Results
Prediction of the EEG activity based on eye movements
First, we predicted each EEG feature to see which one is predicted better from the eye movements. CatBoost Regressor turned out to be the best predictive model. Table 1 represents the values of the model quality averaged across leads.
The prediction quality of the EEG activity based on eye movements.

Note: * P < .0008 (after Bonferroni correction)
Figure 1 shows the topoplots of correlation coefficients between the predicted with CatBoost and true EEG values of engagement indices and theta-, alpha-, beta-power (all ps < 0.0001). Curiously, the best predictions for theta- and alpha-power were found for posterior leads, while beta-power and engagement indices were predicted better in frontal leads. Overall, alpha-activity was the best predicted, primarily in posterior leads.
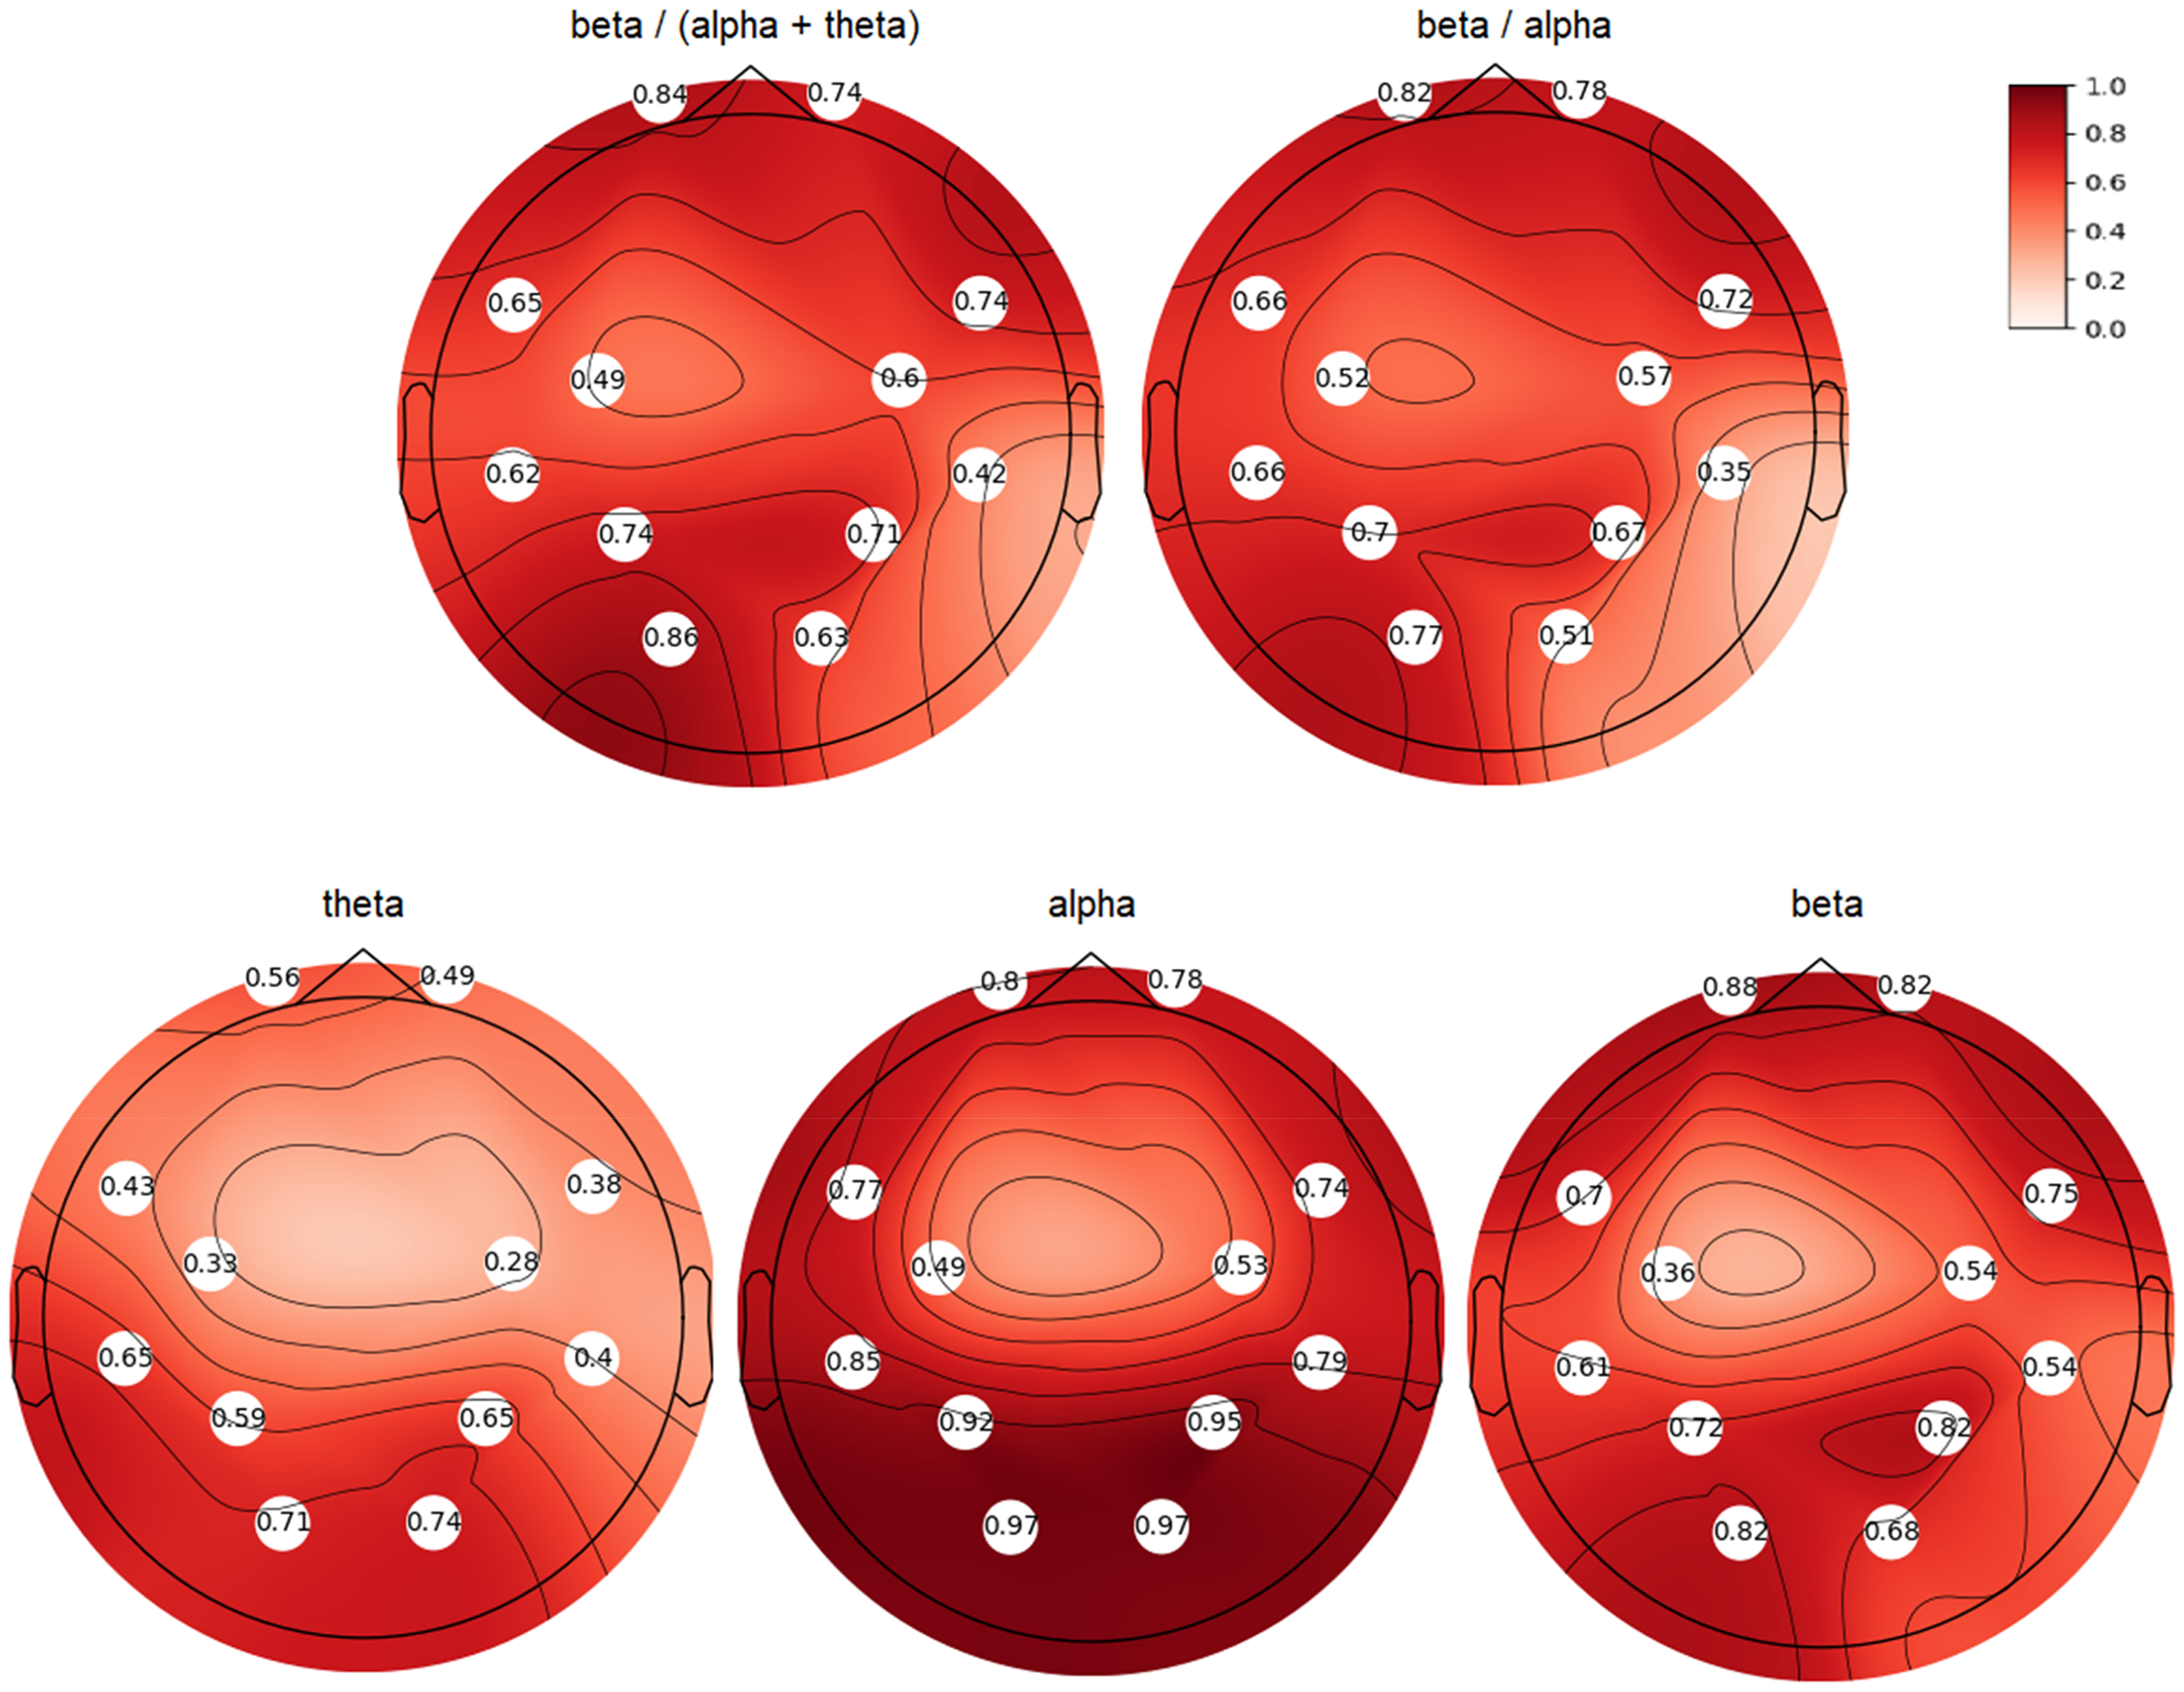
The topoplots of correlation coefficients between the predicted with CatBoost and true EEG values of engagement indices and theta-, alpha-, beta-power.
Prediction of eye movements based on EEG activity
Second, we predicted each eye movement feature to see which one was predicted better from the EEG activity. Table 2 represents the values of the model quality. CatBoost Regressor again was the best predictive model. Fixation number was the best-predicted eye movement feature.
The prediction quality of the eye movements based on the EEG activity.

Note: * P < .007 (after Bonferroni correction)
Prediction of reading speed and comprehension
Finally, we predicted the speed and comprehension of reading from (1) eye movements, (2) EEG activity, and (3) eye movements and EEG activity together. Table 3 represents correlations between predicted and observed values. Again, CatBoost yielded the best predictive scores. EEG data predicted both speed and comprehension (the maximum correlation between predicted and observed values equaled .97) much better than eye movements (the maximum correlation between predicted and observed values equaled .38). Of note, the addition of eye movements did not help to increase the prediction quality, and even decreased it in the case of KNN models.
The prediction quality of reading speed and comprehension based eye movements and EEG activity.

Note: * P < .0001.
Discussion
The presented study explored how eye movements and EEG activity are interrelated, if we can predict one from the other and which method has better quality to predict reading efficiency. For this purpose, we recruited 40 subjects who were reading a novel, while we measured eye movements and EEG from a limited number of leads. Following this, we applied several machine learning models (CatBoost, KNN, linear regression) to predict EEG from eye movements, eye movements from EEG, and reading efficiency from both biological sources.
Initially, we analyzed each EEG feature to determine which could be best predicted by eye movements. The CatBoost Regressor emerged as the most effective predictive model to demonstrate significant predictive power for EEG values of engagement indices and theta, alpha, and beta power. Interestingly, the predictions for theta and alpha power were most accurate for posterior leads, while beta power and engagement indices were better predicted using frontal leads. Overall, alpha activity was the most accurately predicted feature, particularly in the posterior leads.
The role of posterior alpha band has been well established in vision,35–37 in general, and in reading,38, 39 in particular. As for the frontal beta band and engagement indices, beta/alpha and beta/(alpha + theta), previous studies also found their relation to visual attention and general arousal. 40 The engagement index correlated, for example, to film ratings 41 and was higher during watching negative videos. 42 We highlight that eye artifacts persisted in the EEG signal, introducing some noise specifically in the theta band (around 3 Hz),31, 32 but not affecting the other bands. Given that the posterior alpha band, which is crucial for predictions and generally free from artifacts, we can infer that this key feature (posterior alpha) accurately represents visual processes. Nonetheless, we acknowledge that future studies, specifically designed and with the help of electrooculography, could clarify the technical influence of eye artifacts on the prediction of prefrontal EEG activity during reading.
Next, we evaluated each eye movement feature to see which was best predicted by EEG activity. The CatBoost Regressor again proved to be the top predictive model. Among the eye movement features, the number of fixations was the most accurately predicted.
Finally, we assessed reading speed and comprehension based on eye movements, EEG activity, and a combination of both eye movements and EEG activity. Once more, CatBoost provided the highest predictive scores. EEG data significantly outperformed eye movements in predicting both speed and comprehension, with the highest correlation between predicted and observed values reaching .97, compared to a maximum of .38 for eye movements. Notably, incorporating eye movements did not enhance prediction quality and, in fact, reduced it for some models.
A limitation of our study lies in a sparse electrode location of the EEG. We used only 14 electrodes in order to check the possibility to predict eye movements and reading quality using this humble amount of electrodes. Instead, a high-resolution EEG (e.g., 64 electrodes) could have yielded much precise predictive quality. However, this is a question for future studies.
A similar limitation relates to the temporal resolution of eye-tracking data (150 Hz). According to Holmqvist et al., higher sampling rates (e.g., 500 Hz or more) provide more precise temporal resolution, allowing for better detection of subtle and rapid eye movements that occur during reading. 4 This increased precision can enhance the accuracy of fixation detection and the measurement of saccade dynamics, leading to more reliable correlations between eye movement parameters and cognitive processes. Future studies could benefit from using eye trackers with higher sampling rates to capture more detailed information about the dynamics of eye movements during reading, thereby improving the robustness of the findings. We also acknowledge that combining forward and regressive saccades into a single category may obscure distinct cognitive processes associated with each type of saccades.
Another curious direction of research could encompass texts of different affective valence (negative, neutral, and positive texts) or texts inducing different basic emotions (e.g., sad, happy, fearful stories, etc.). We applied only one text, which limits the generalization of our results.
Conclusions
First, from the three machine learning models (CatBoost, KNN, linear regression) CatBoost showed the best predictive quality. Second, when we predicted EEG activity based on eye movements, alpha-activity was found to be the most accurately predicted. In general, theta- and alpha-power were best predicted in posterior leads, while beta-power and engagement indices were best predicted in frontal leads. Third, when we predicted eye movements based on EEG activity, fixation number was the best-predicted eye movement feature. Finally, EEG activity predicted reading efficiency much better than eye movements. To conclude, EEG activity and eye movements are revealed to be interchangeable, that is, practically speaking, one can reduce the number of measurements in studies where only one measure is available.
Footnotes
Author contribution
VK—conceptualization, methodology, writing—original draft, review, and editing; NR—formal analysis, writing—review and editing; PS—data curation, investigation, writing—review and editing. All authors contributed to the manuscript revision and approved the submitted version.
Data availability
All the data could be provided upon request to the corresponding author.
Declaration of conflicting interests
The authors declare that the research was conducted in the absence of any commercial or financial relationships that could be construed as a potential conflict of interest.
Ethical approval
The HSE Committee on Interuniversity Surveys and Ethical Assessment of Empirical Research Board approved the study (№80, 07.02.2022).
Funding
The article was prepared within the framework of the Basic Research Program at HSE University.