
Abstract
Background
The pressure fluctuation in the volute can be effectively reduced when the impeller of the double-suction pump is staggered, but the mechanism of this reduction is still unclear. At the same time, the traditional analysis method cannot realize the visualization of pressure fluctuation.
Objective
The purpose of this article is to explore the spatial distribution, propagation, and attenuation law of pressure fluctuation, and on this basis, to research the reason why staggered impeller reduce pressure fluctuation.
Methods
A new method called Pulse tracking network (PTN) was used in this article. Compared with the traditional method, which only analyzes the pressure fluctuation at scattered points, this method greatly improves the spatial resolution of the pressure fluctuation. In particular, the phase analysis is a major highlight of the method.
Results
Staggered impeller significantly reduced the pressure fluctuation intensity dominated by blade passing frequency. At the same time, the propagation of the pressure fluctuation in the volute changed from radial to circumferential in the volute cross-section.
Conclusions
Staggered impeller can effectively reduce pressure fluctuation, and the circumferential propagation caused by it is considered to be the main reason for it.
Keywords
Introduction
Double suction centrifugal pump is a type of pump that combines high head and large flow. 1 It reduces the axial force of the entire machine by placing the water inlet on both sides and arranging the impellers back-to-back. Although the double suction centrifugal pump uses a semispiral suction chamber, it still maintains a high level of efficiency through good design. Therefore, there are applications of double suction centrifugal pumps in current large-scale water transfer projects, municipal water supply projects, nuclear industry, and other fields.2–4
In the engineering problems of double suction centrifugal pumps, a key point has always been mentioned, that is, the pressure fluctuation problem in the volute. The essence of pressure fluctuation is the periodic fluctuation of the fluid in the pump. In addition to pressure, other physical fields such as velocity, turbulent kinetic energy, and so on are also constantly fluctuating.5,6 In engineering, pressure fluctuations are often used as an important criterion for unit operation due to their ease of measurement. 7 Due to the periodic rotation of the impeller and the complexity and disorder of the turbulent changes, the fluctuation of pressure presents a complex superposition of periodicity and chaos. 8 For a double suction centrifugal pump, the continuous pumping of water by symmetric impellers on both sides will trigger severe pressure fluctuations related to the impeller rotation frequency, blade frequency, and so on in the volute. 9 The pressure fluctuation is too strong, which creates a significant burden on the bearings of the unit and poses an accident risk during long-term operation. 10
Many researchers have conducted research on the pressure fluctuation of double suction centrifugal pumps, and the pressure fluctuation in the volute is the most concerned. The key points are as follows: (1) characteristics of pressure fluctuations in the spiral case, (2) the influence of impeller symmetry and staggered arrangement on pressure fluctuation, and (3) the influence of impeller outlet edge inclination on pressure fluctuation. Parrondo et al. 11 monitored the pressure fluctuation in the volute of a centrifugal pump and found that the magnitude of the pressure fluctuation mainly depends on the intensity of dynamic and static interference between the spacer and the impeller. At the same time, when the operating condition deviates from the rated condition, the amplitude of the pressure fluctuation significantly increases. Jia et al. 12 tested the pressure fluctuation on the volute wall of a variable flow pump, and the results showed that the blade passing frequency and high-frequency components were the main components of the pressure fluctuation under small flow, while the rotating frequency and low-frequency components were the main components under large flow. Peng et al. 13 analyzed the flow in the volute of a double-suction pump by using the Omega vortex method. It is found that strong static and dynamic interference in the intertongue region is the main reason for the dominant pressure fluctuation. Liu et al. 14 conducted numerical simulations of centrifugal pumps with different impeller arrangements using the large eddy simulation method, and found that staggered impeller arrangements can significantly reduce the level of pressure fluctuation. Yu et al. 15 passed RNG (Re-Normalization Group) k-ε model analyzed the flow in the volute of a double suction centrifugal pump with different impeller stagger angles, and found that the pressure fluctuation in most regions of the volute was caused by the superposition of the pressures of two impellers. Fu et al. 16 monitored the impact of five different impeller stagger angles on pressure fluctuation through experimental methods, and found that the semistaggered impeller has the best effect in reducing pressure fluctuation. Jiang et al. 17 studied the effect of blade outlet inclination angle on pressure fluctuations in the volute through numerical simulation, and found that in centrifugal pumps with small blade outlet inclination angles, the amplitude of pressure fluctuations in the volute decreases, and the high-frequency fluctuation components become less. Sonawat et al. 18 studied a double-suction centrifugal pump with staggered impeller and split volute, and found that the optimal hydraulic performance can be obtained at a staggered impeller angle of 30°, while greatly reducing pressure fluctuation. Li et al. 19 also analyzed the pressure fluctuation of a double-suction centrifugal pump with a staggered impeller, and found that the staggered impeller could effectively reduce the amplitude corresponding to the blade passing frequency and its harmonic frequency.
In general, many researchers have studied the phenomenon that the staggered impeller reduces the pressure fluctuation in the volute of the double suction centrifugal pump, and can determine that this is a satisfactory treatment. However, most of the researches in this area focus on changing the impeller interleaving angle and arrangement mode, so as to verify whether the pressure fluctuation is indeed reduced and the degree of reduction, and the research on the mechanism behind this reduction is rarely mentioned. This is because in conventional studies, only the pressure fluctuation information obtained at a limited number of monitoring points is usually concerned. Discrete and sparse monitoring points can only generally describe the propagation and attenuation of pressure fluctuations. 20 However, it is difficult to obtain specific information about the pressure fluctuations, such as the location of the strongest fluctuations, specific attenuation patterns, and propagation paths.
Pulse tracking network (PTN) method 21 makes it possible to achieve this goal. Since the monitoring points can be arranged arbitrarily in the numerical simulation, a large number of monitoring points are arranged in the flow field by using PTN method. This greatly improves the spatial resolution of pressure fluctuation information. Lu et al. 22 used this method to analyze the pressure fluctuation in the vortex shedding flow of hydrofoil with different trailing edge shapes, and proved the effectiveness of this method in identifying the propagation law of pressure fluctuation under different working conditions. In this article, the PTN method is introduced into the field of three-dimensional (3D) hydrodynamic pressure fluctuation for the first time. The pressure fluctuation in the volute of double suction centrifugal pump with different impeller arrangement is analyzed, and its propagation and attenuation rule are studied. Therefore, the mechanism of staggered impeller to reduce pressure fluctuation is discussed.
In the study of pressure fluctuations, most researchers now take time-frequency conversion as the basis. Fast Fourier transform (FFT) is a classical method,23,24 but it is not suitable for nonstationary nonlinear signals. The commonly used method for unstable signals is wavelet transform.25,26 However, wavelet transform is limited by the selection of basis functions and the Heisenberg uncertainty principle. The empirical mode decomposition (EMD) algorithm 27 is not limited by the Heisenberg uncertainty principle. According to the characteristics of the signal, a recursive method is used to decompose the signal with high resolution on an adaptive expansion basis. Empirical wavelet transform is proposed by combining EMD algorithm with wavelet transform. 28 This algorithm combines the adaptability of EMD algorithm with the characteristics of complete theory, simple and fast calculation. However, this method has the problems of endpoint effects and modal component aliasing, and it takes a long time to calculate. Variational Mode Decomposition 29 is a completely nonrecursive algorithm based on Wiener filters, Hilbert transforms, and variational constrained optimization. This method reduces endpoint effects and modal component aliasing and is not limited by the uncertainty principle.
This article took a type of double suction centrifugal pump as the research object. The PTN method was used to analyze the spatial distribution of pressure fluctuation in the volute for the first time. The main frequency, amplitude, and phase of pressure fluctuations were studied, including symmetric and staggered impellers. Computational fluid dynamics (CFD) was used for numerical simulations. The propagation mode of pressure fluctuation under different impeller arrangement was analyzed from the phase, and the mechanism of reducing pressure fluctuation with staggered impeller was studied accordingly.
Research object
In this article, the research object is a certain type of double suction centrifugal pump. The main parameters are shown in Table 1. Figure 1 shows the 3D models of the suction chamber, impellers, and volute.

Three-dimensional model of each component of the pump.
Main parameters of the pump.

In the original model, the impellers are symmetric. In this article, the pressure fluctuations in the volute with symmetric and staggered impellers are investigated. When the impellers are staggered, the staggered angle is half of the included angle between two adjacent blades, which equals to 0.5 × 360°/7 ≈ 25.714°.
Method
CFD simulation setup
The Navier-Stokes equation is often used to solve continuous incompressible fluids and is composed of the continuity equation and the momentum equation. They are shown below equations (1) and (2).
30


In engineering applications, Reynold's mean is often used to solve Navier-Stokes equations. The velocity term and pressure term are decomposed into time mean and fluctuation values to obtain Reynolds-averaged Navier-Stokes equation (RANS) as shown below equations (3) and (4):

The SST (Shear Stress Transport) turbulence model is used for steady and unsteady calculations. The SST turbulence model
31
combines the advantages of standard k-ε model and standard k-ω model. It considers the effect of turbulent shear stress on the turbulent viscosity equation, using k-ε model in the mainstream region and k-ω model near the wall to analyze the flow of the viscous bottom layer.32,33 So, it can accurately predict the starting point of flow separation from a smooth surface and the size of the separation zone. The SST turbulence model equations are shown in equations (5) and (6).
31


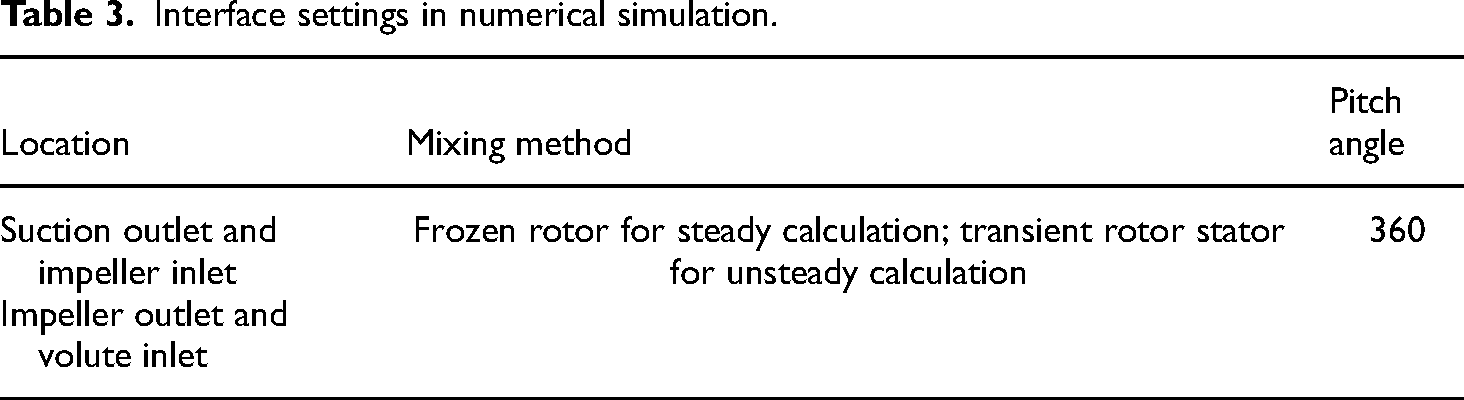
In this article, the main research object is the pressure fluctuation in the volute of a double suction pump, without considering the temperature changes of the internal fluid, so the energy equation was not considered. The liquid material was set to water at 25°C, which is water at room temperature. The boundary conditions, interface settings, and solution settings are shown in Tables 2, 3, and 4, respectively.
Boundary condition settings in numerical simulation.

Interface settings in numerical simulation.
Solution settings in numerical simulation.

Grid check
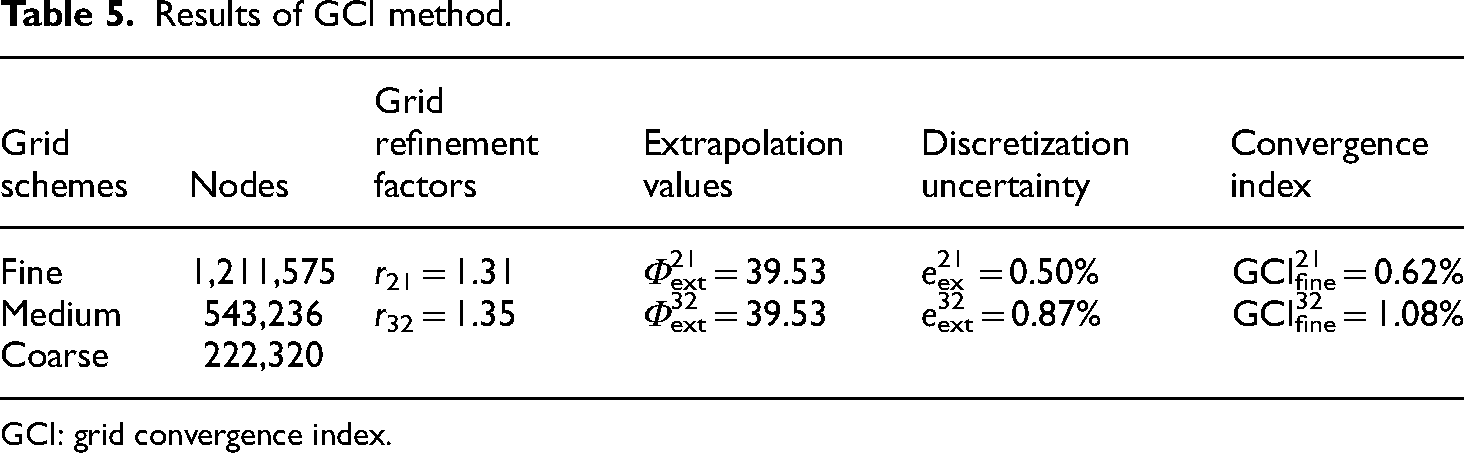
The suction chamber, impeller and volute were all constructed with hexahedral unstructured grid structure. The grids at the tongue of volute and impeller blade edge were densified. To ensure the reliability of CFD simulation, the grid convergence index (GCI) was studied based on Richardson's extrapolation method. 34 Three grid schemes were determined proportionally which were coarse, medium, and fine. The head of the pump was selected as the key variable for error evaluation. The mesh node numbers of the three grids N1, N2, and N3, the grid refinement factors r21 and r32, the extrapolation values Φext21 and Φext32, the discretization uncertainty eext21 and eext32, the convergence index GCIfine21 and GCIfine32 are listed in Table 5.
Results of GCI method.
GCI: grid convergence index.
Figure 2 shows the pump head calculated by three grid schemes and the extrapolated value calculated by Richardson's extrapolation method. The results of Table 5 and Figure 2 show that the above grid scheme can meet the convergence requirements of the calculation. Therefore, in order to better simulate the internal flow of tubular turbines, the medium grid scheme with 543,236 grid nodes is selected. The specific grid division results are shown in Figure 3. The minimum mesh quality is 0.23. The number of elements with quality above 0.6 accounts for more than 75%.

Index values in the GCI check of grid schemes with the Richardson extrapolation value. GCI: grid convergence index.

The final scheme of grid division.
PTN setup
Theory
The PTN method arranges enough monitoring points in space, monitors the temporal signals of these monitoring points during the numerical simulation, and combines various data analysis methods to analyze these signals. After obtaining the processing results, draw cloud maps based on them to obtain the spatial distribution pattern of fluctuation information. FFT is the simplest processing method, which was used in this article. The prominent feature of PTN method is that it can analyze the spatial distribution of phase, thereby analyzing the propagation of waves in space. This reflects the term “tracking” in the method. Although PTN has many advantages, its biggest limitation comes from hardware conditions. A large number of monitoring points will occupy a huge amount of computing resources, and when analyzing, it is necessary to consider whether the computer's performance can support the needs of computation. At the same time, the coordinated processing of large amounts of data also requires strong computing power as support.
Layout of monitoring points
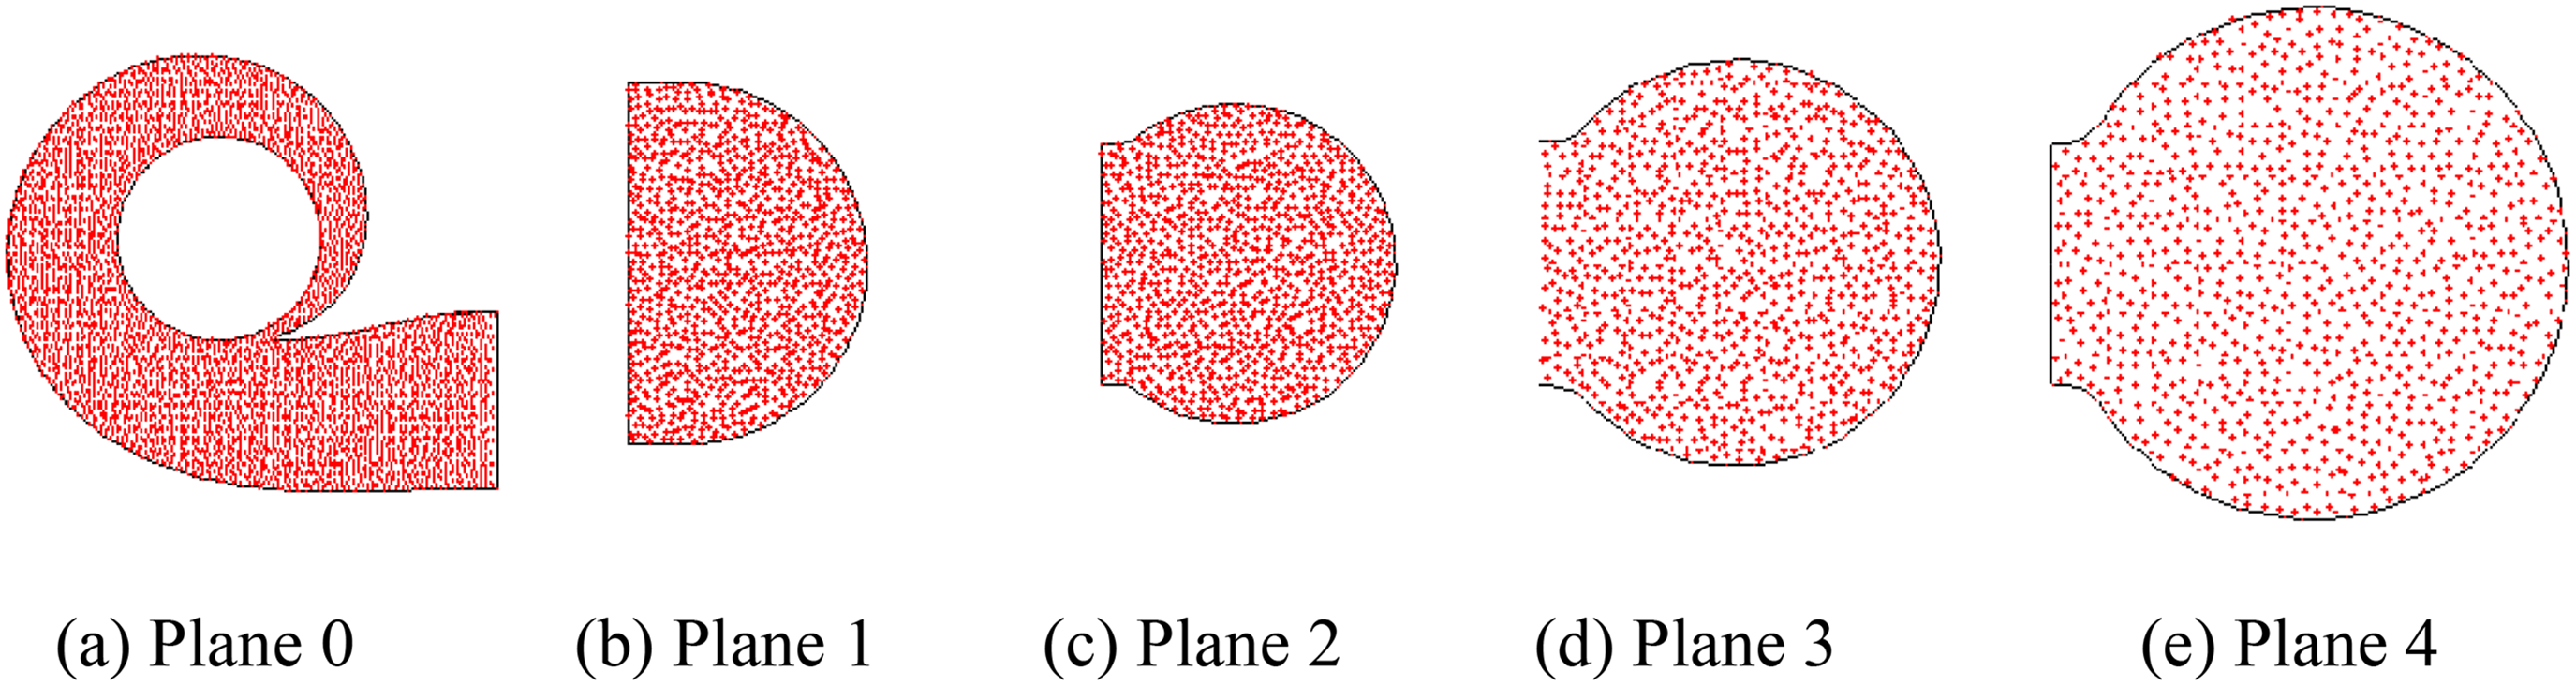
Pulse tracking network (PTN) method is based on the information of a large number of monitoring points in the flow field. In this article, these monitoring points are used to monitor pressure fluctuations. They are distributed on five special planes in the volute. Figure 4 shows the location and shape of these planes. Planes 1 to 4 is intersecting section, and plane 0 is the middle longitudinal section. Figure 5 identifies the relative positions of planes 1 to 4 in the spiral case. Point P0 is the center point of the impeller rotation axis. Planes 1 and 3 are the intersection of the horizontal plane where the point is located and the volute, while planes 2 and 4 are the intersection of the vertical plane and the volute. Figure 6 shows the distribution of monitoring points on each plane, where each red point represents a different monitoring point.

Plane position and shape. Left: Planes the monitoring points located in. Right: The shape of each plane.

Location of monitoring plane.
Layout of monitoring points on each plane.
The number of monitoring points arranged on each plane will directly affect the effectiveness of the PTN method. If there are too few monitoring points, the resolution of the cloud image will be too low to accurately reflect the distribution and changes of the parameter. In this article, about 1000 monitoring points were arranged on planes 1 to 4 respectively, and about 5000 monitoring points are arranged on plane 0. The monitoring points are randomly generated on each plane. The number and density of monitoring points on each plane are shown in Table 6.
Number of monitoring points arranged on each plane.

Temporal spatial states of pressure fluctuation
Based on Fourier transform, any periodic signal can be decomposed into the superposition of several orthogonal sine or cosine signals. These sine or cosine signals have their own amplitudes and frequencies. The sine or cosine signal with large amplitude dominates the original signal. The general methods of Fourier transform are as equations (7) and (8)
21
:

Pressure coefficient Cp is used to characterize the pressure fluctuation. The calculation is as equation (5):
For a certain frequency, the phase of a point is selected as the initial phase φ0 and the phase at point k is φk. The phase difference Δφk of each point at the selected frequency can be calculated as equation (10):
Model experiment
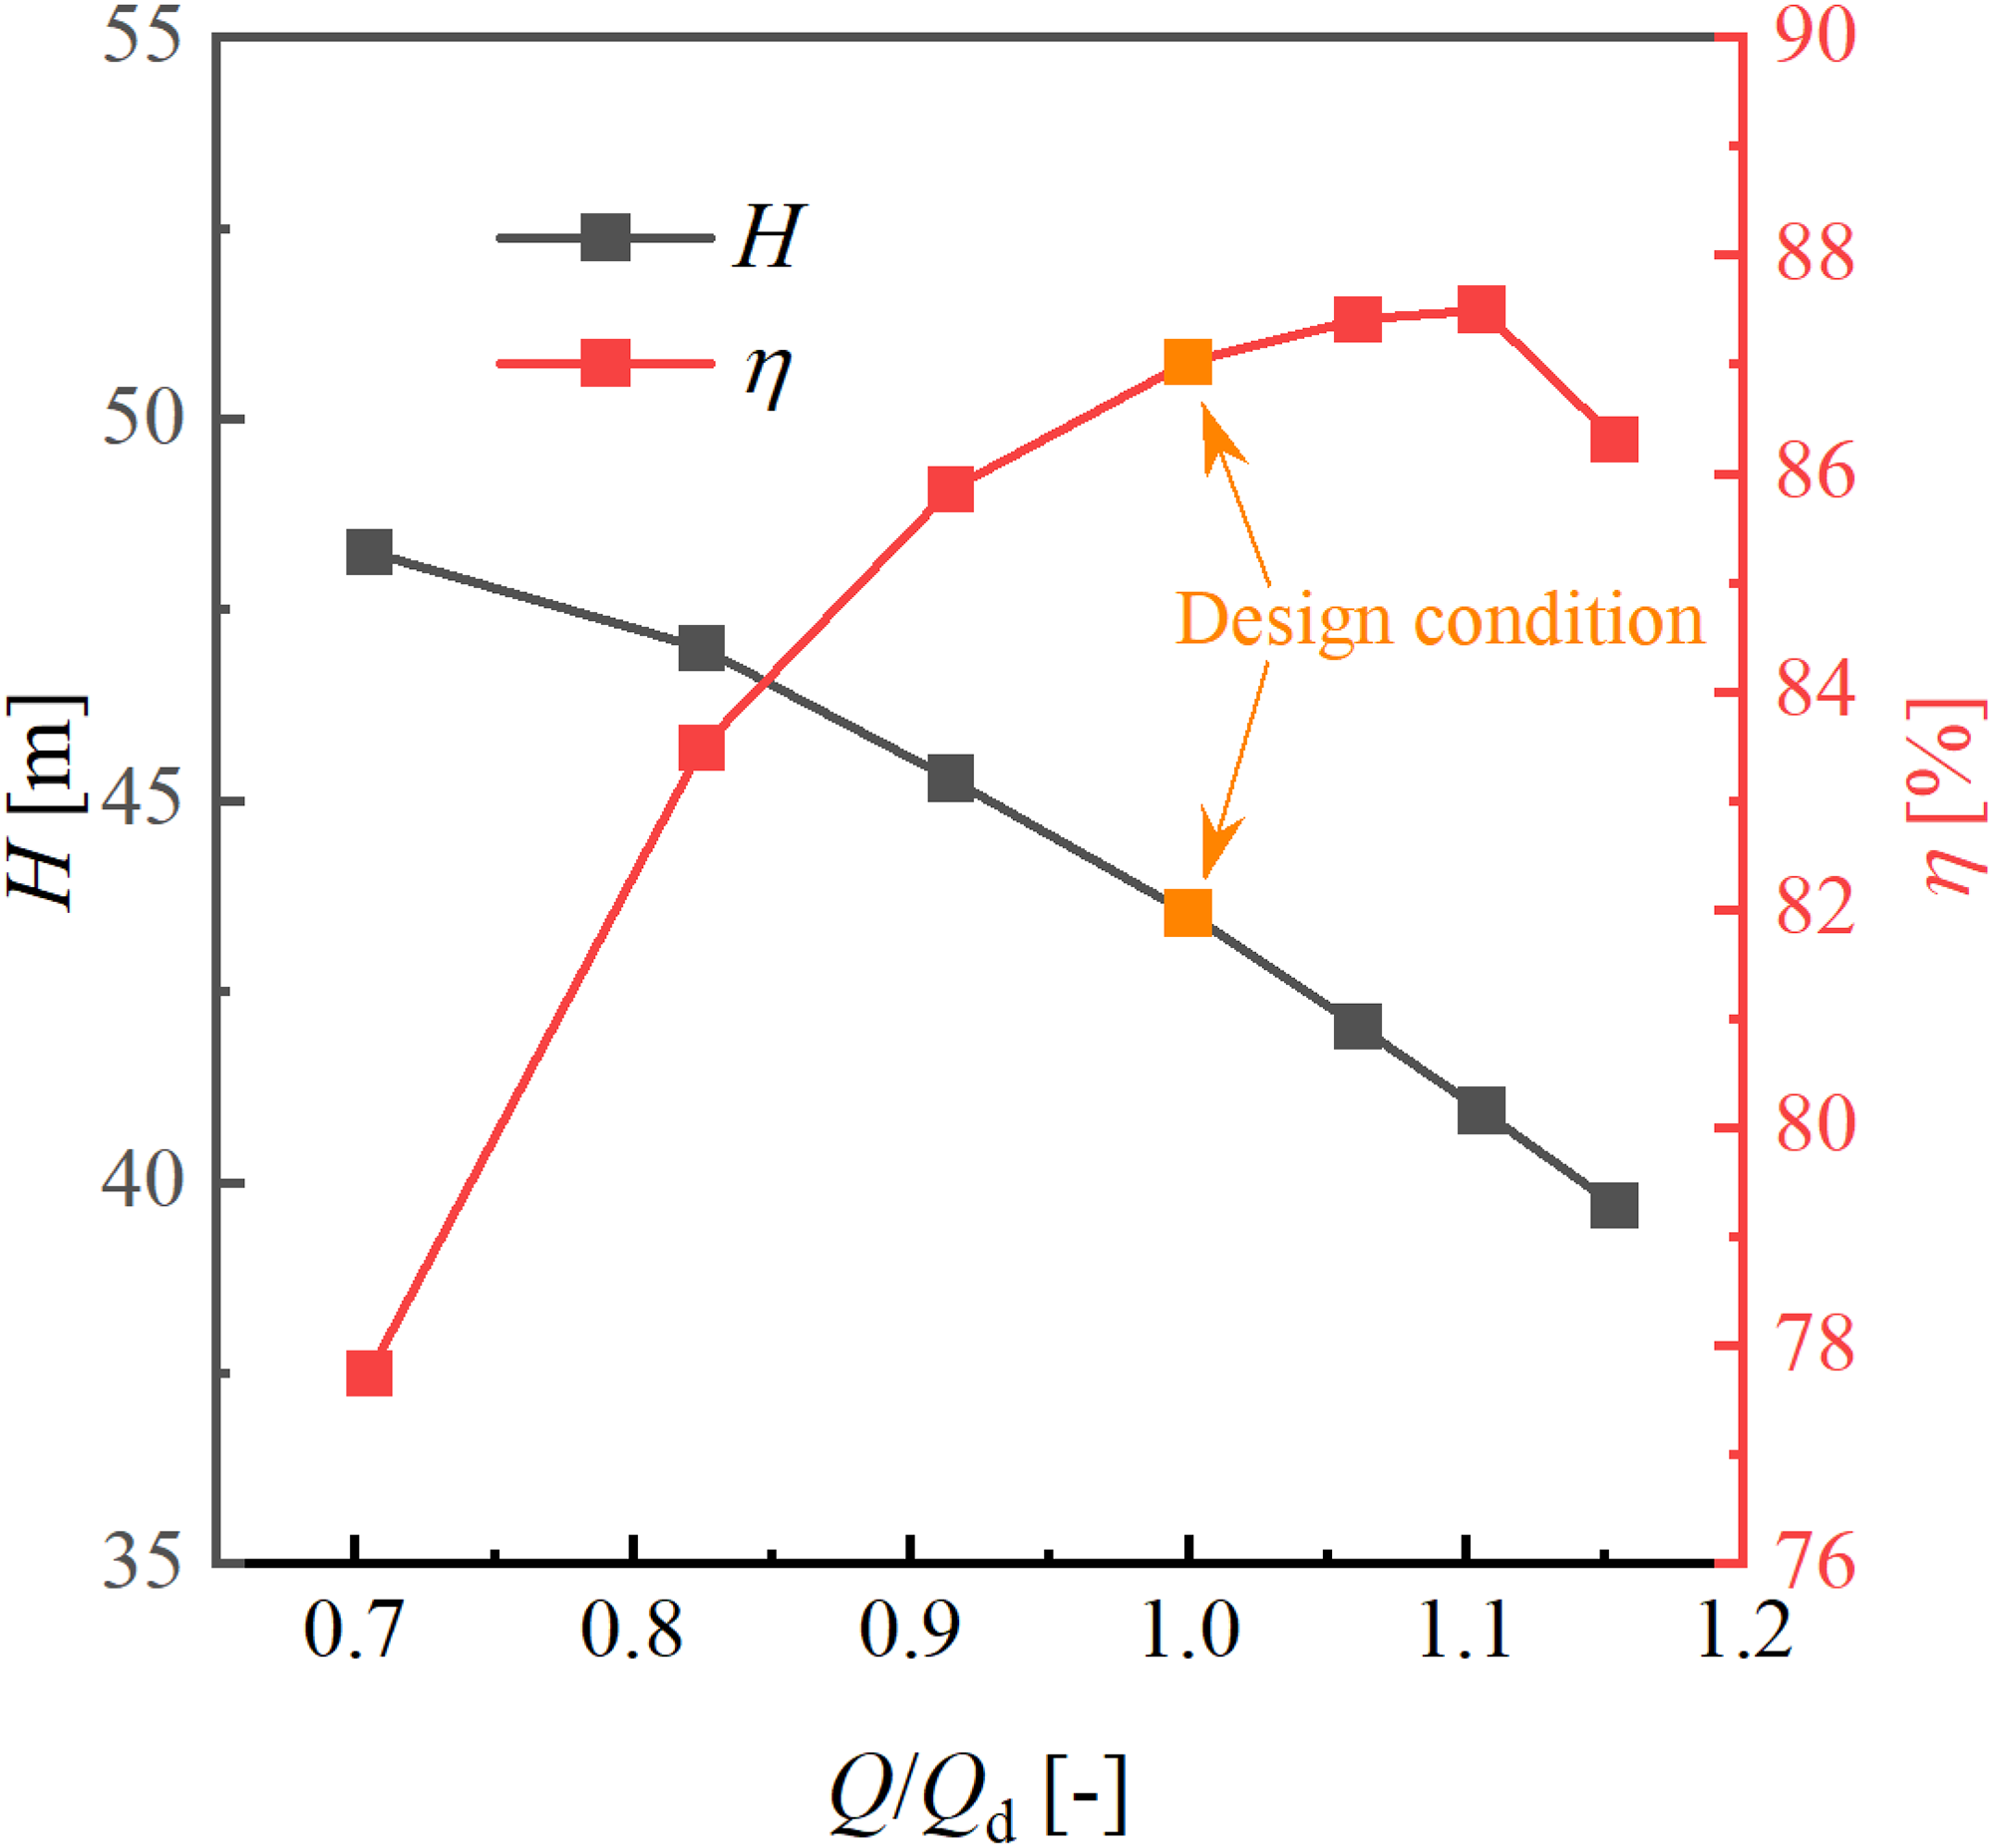
Figure 7 shows the head and efficiency curves of the pump at different flow rates during the test. At the designed flow rate, the head is 43.53 m, and the design condition is located in the high efficiency area, so it is considered that the pump meets the design requirements.
Efficiency and head curve from experiment.
Comparison of performance
The symmetric and staggered impellers are simulated, respectively, and the head and efficiency curves are shown in Figures 8 and 9. According to the simulation results, the heads of the two schemes are 39.87 and 40.34 m at the designed flow rate. The simulation results of head have an error of <10% compared to the experimental results under high flow conditions, while efficiency have an error of <5% under all operating conditions. Considering the errors in numerical simulation and actual work and the possible influence of calculation settings on the final results, it is considered that the results of numerical simulation fit the test results well. In addition, the performance curves corresponding to the two arrangements almost coincide, indicating that the impeller arrangement has little influence on the pump performance.

Comparison of experimental and simulated head with 10% error bar.

Comparison of experimental and simulated efficiency with 5% error bar.
Conventional CFD postprocessing
Flow field
The result of the last time step of the numerical simulation is analyzed. Figure 10 shows the distribution of surface streamlines in each plane at this time step. As can be seen from Figure 10(a), two different impeller arrangements have little impact on the overall flow path of the volute. The highest velocity occurs at the tongue position and decreases with the flow direction, and there is a significant diversion of water as it enters the outlet section of the volute. For other planes, there are two main planes which are greatly affected by different impeller arrangement. One is plane 1 closest to the tongue and the other is plane 4 closest to the volute outlet. There are obvious eddies in the streamline of plane 1. When the impellers are symmetrical, the distribution of vortices on the plane is also symmetrical. When the impellers are staggered, it can be seen that the intensity of the vortexes on one side is significantly higher and the distribution position of the vortexes is not completely symmetrical. In plane 4, when the impellers are symmetrical, the streamlines intersect at the center of the Plane, indicating that the flow from both sides interferes with each other here, which is not the case when the impellers are staggered.

Surface streamline on each plane. Top: symmetrical impellers. Bottom: staggered impellers.
Velocity
Figure 11 shows the velocity distribution on each plane during the last time step of the numerical simulation. For the entire volute flow path, the high-speed zone is mainly concentrated in the area behind the partition tongue and near the impeller outlet. The flow rate decreases in the direction of flow and forms a low-speed zone in front of the volute outlet. When the impellers are staggered, the area of the low-speed zone near the volute outlet is smaller. Similar to surface streamlines, the effect of different impeller arrangement on speed is also reflected in plane 4. When the impellers are symmetrical, the velocity distribution on plane 4 is symmetrical, and the area with the lowest velocity is close to the middle of the section. When the impellers are staggered, two unrelated low speed zones appear in the plane and the velocity distribution is asymmetric. Based on the analysis of the convection line in the upper section, it is considered that when the impellers are symmetrical, the liquid flow on both sides enters the volute at the same time and collides with each other at the outlet section of the volute, resulting in the concentration of the low-speed zone at the center of the section and the formation of a large low-speed zone. The staggered impeller makes the flow on both sides not synchronized, thus reducing the impact in the volute.

Velocity distribution on each plane. Top: symmetrical impellers. Bottom: staggered impellers.
Pressure
Figure 12 shows the distribution of dimensionless pressure Cp on different planes. The pressure in the volute shows a small inlet pressure, and gradually increases along the flow direction and radial direction. There is an obvious low pressure area in the septal tongue due to the higher flow rate. However, the different arrangement of the impeller has no obvious effect on the pressure distribution at this moment.

Pressure distribution on each plane. Top: symmetrical impellers. Bottom: staggered impellers.
Visualization of pressure fluctuation
Main frequency
The pressure fluctuation under design conditions is analyzed. Figure 13 shows the main frequency distribution on each plane. When the blades are symmetrical, pressure fluctuations near the volute inlet are dominated by the blade passage frequency fBPF = Zn × fn = 172.67 Hz. The shape of the distribution in this area is highly correlated with the relative position of the blades. After the water flow diffuses along the radial direction, the pressure fluctuation gradually changes to a higher frequency dominated. A large area of low frequency dominant region appears in the outlet section of the volute, which indicates that pressure fluctuation begins to decay in this area. However, some high-frequency dominant areas still exist, which indicates that pressure fluctuation attenuation at the volute outlet section is not complete when the impellers are symmetrical.

Main frequency distribution in each plane. Top: symmetrical impellers. Bottom: staggered impellers.
When impellers are staggered, unstable low or high frequency points exist at the volute inlet, the number of which is also highly correlated with the relative position of the blades. The volute flow channel is almost completely dominated by double blade frequency 2fBPF = 345.33 Hz. It is shown that blade passage frequency is the main factor affecting pressure fluctuation in volute flow channel. At this time, the pressure fluctuation at the volute outlet section is completely dominated by low frequency. A large area of low-frequency dominant region appears in plane 4, which indicates that the pressure fluctuation decays earlier and more thoroughly at the volute outlet section.
In Figure 13(b), it can be found that it has the ultrahigh frequency point of 1578.67 Hz at the volute inlet of plane 1. And the point is closer to the symmetric axis of the plane when the blades are staggered. Similarly, in Figure 13(c)–(e), when the impellers are symmetrical, the pressure fluctuation area dominated by fBPF near the volute inlet is connected and has a large area. When impellers are staggered, the pressure fluctuation area dominated by fBPF is truncated along the symmetric axis by the area dominated by 2fBPF. The area dominated by fBPF is limited to a small area near the outlet of each impeller. When the impellers are symmetric, the variation of the dominant frequency of pressure fluctuations in the flow channel is relatively complex. As the area of the flow channel increases, a pressure fluctuation dominated by f = 2fBPF + fn = 370 Hz. While when the blades are staggered, the frequency corresponding to the high frequency region is always 2fBPF.
Intensity by frequency
The amplitude of pressure fluctuations dominated by fBPF is analyzed. Figure 14 shows the distribution of the amplitude corresponding to this frequency on each plane. As can be seen from Figure 14(a), when the blades are staggered, the amplitude in the volute has significantly decreased.

The amplitude of pressure fluctuations dominated by fBPF. Top: symmetrical impellers. Bottom: staggered impellers.
The distribution of high amplitudes is very similar to the distribution of fBPF in Figure 13. When the impellers are symmetrical, the region with higher amplitude is continuously distributed near the volute inlet. And there is a significant radial propagation effect. When the impellers are staggered, only a small range near the outlet of each impeller has a higher amplitude. The high amplitude region is truncated by the low amplitude region. The maximum amplitude is also smaller than that when the impeller is symmetrical.
Relative phase
Before phase analysis, the initial reference point should be selected. Figure 15 shows the distribution of phase differences between other points and reference point on each plane.

Phase on each plane. Top: symmetrical impellers. Bottom: staggered impellers.
When the impellers are symmetrical, there is an obvious phase abrupt change area in the volute, and its distribution position is highly related to the relative position of the vanes. The larger the area of flow path, the larger the impact range of catastrophe zone. This is because as the flow rate slows down, the liquid near the outer wall of the volute is more stricken by the liquid from the impeller. The combined forces exerted on these liquids cause their flow direction to deviate radially and the pressure waves carried by them bounce back toward the outer wall of the volute. This can also be verified in top Figure 10(a). It is obvious that the phase propagates radially outward from the volute inlet, which represents the propagation of pressure waves in planes 1, 2, and 4. The position of plane 3 is close to the blade, which is affected by phase mutation zone and its phase propagation direction is opposite to other planes.
When impellers are staggered, although there are phase break points scattered in the volute, the overall phase propagation trend is relatively stable. In planes 1 to 4, there is obvious phase difference of π near the volute inlet. Further analysis shows that the pressure wave propagating circumferentially along the plane can be observed on the cross-section of the volute as shown in Figure 16. Unlike full radial propagations when impellers are symmetrical, pressure waves propagating in the direction of cross-section last week significantly reduce pressure fluctuations in the volute when impellers are staggered.

Phase circumferential propagation in plane 4.
The phase analysis shows that when the blades are symmetrical, the blades of two impellers reach a certain position synchronously, and the blade passage frequency of the impellers is equal to fBPF. Therefore, in Figure 13, there is a continuous large area of fBPF dominant region at the volute inlet. The impact of the two impellers on the fluid in the volute is superimposed on each other, and the simultaneous outflow from both sides collides with each other, causing pressure waves to propagate along the radial direction, resulting in superposition, causing severe pressure fluctuations. When the blades are staggered, the blade passage frequency of the impellers is equivalent to 2fBPF, and only a small portion of the area near the outlet of the two impellers is affected by a single impeller. Therefore, the figure below in Figure 13 shows that only a small area of fBPF dominates the area near the outlet of the impeller, while the pressure fluctuation in the rest of the flow path is mainly dominated by 2fBPF. The superposition of the two impellers at the symmetric axis of the cross-section of the volute has a greater impact, so the 2fBPF dominant region extends along the symmetric axis volute inlet. The nonsynchronization of the blades leads to the nonsynchronization of the outflow, resulting in a less severe collision of the liquid flow in the volute, thereby reducing the pressure fluctuation.
Conclusions and discussion
In this article, the internal flow and pressure fluctuation characteristics of a type of double suction centrifugal pump were studied. And this is the first time that the PTN method was introduced into the study of fluid machinery, who has the high spatial resolution, and groundbreaking results were obtained. The results show that the staggered impeller can effectively reduce the pressure fluctuation component in the volute, which is dominated by the blade passing frequency. In particular, the propagation path of the pressure wave at this frequency is analyzed from the Angle of phase. The pressure wave propagating around the volute wall will be caused when the impeller is interleaved. The results were groundbreaking. The conclusions are as follows:
A numerical simulation was conducted on a certain model of double suction centrifugal pump and compared with experimental data. The numerical simulation results are in good agreement with the experimental results. The efficiency curve increases with the increase of flow rate, and there is an efficiency zone near the design operating conditions. The operating efficiency of the pump is above 85%. The head curve and efficiency curve in the numerical simulation results of symmetric and staggered impellers have the same trend as the experimental results. The calculated head under the designed flow rate is close to the experimental value. Near the design conditions, there are also high efficiency zones with efficiency values higher than 85%. The numerical simulation results of this article are valid. The flow field at the last time step of numerical simulation was analyzed, and the influence of different impeller arrangements on the flow state inside the volute was studied. It was found that this influence mainly exists near the tongue and outlet section of the volute. The flow state near the tongue of the volute is the most complex, with significant vortices on the cross-section. When the impellers are staggered, the distribution of vortices also shows significant asymmetry, and the flow velocity in the outlet section of the volute decreases slower than that when the impellers are symmetrical. The time-frequency conversion of pressure fluctuation is performed using FFT. The dominant frequency distribution on five planes, and the amplitude and phase distributions of pressure fluctuations dominated by fBPF = 172.67 Hz were obtained. The results of the distribution of the main frequency, amplitude, and phase mutually support each other, providing support for the effectiveness of the PTN method. When the impellers are symmetrical, there is a large continuous region dominated by fBPF near the impeller outlet, and the corresponding fluctuations in this region are strong. The amplitude behind the tongue in the middle section of the volute is significantly reduced, and the maximum value is reduced by about 70%. The maximum value reduction of the remaining cross-sections can also be 20%. The staggered impeller not only significantly reduces the area of that region, but also reduces its strength, thereby reducing the pressure fluctuation of the entire volute. The propagation of pressure waves dominated by fBPF in the volute is analyzed from the perspective of phase, and the mechanism of staggered impellers reducing pressure fluctuations inside the volute was explained in a visual way from a new perspective. When the impellers are arranged symmetrically, pressure waves propagate radially in the volute. When the impellers are staggered, there is a phase difference of π at the inlet of the volute, and there is a significant circumferential propagating pressure wave on the cross-section. This is caused by the nonsynchronization of the blades. One of the reasons for reducing the pressure fluctuation in the volute is the nonsynchronization of the outflow caused by the nonsynchronization of the blades, which is clearly reflected by the phase analysis of PTN method.
Discussions are given as follows. PTN method is a higher dimensional analysis method than the conventional analysis method. In the analysis of pressure fluctuation, similar or different conclusions are also obtained. For example, the general research results suggest that the pressure fluctuation in the volute is dominated by 2fBPF, while the PTN method finds that the main frequency of the pressure fluctuation near the impeller outlet is still fBPF. The phase distribution diagram also more intuitively shows the propagation of pressure fluctuation in the volute. The PTN method also shows its superiority over the conventional method. In this article, FFT is used as a time-frequency conversion method. In future research, we can try to combine PTN method with other data processing methods to try to obtain more beneficial results. On the other hand, it is necessary to explore a more reasonable coupling method between grid division and monitoring point layout in the future. Because the monitoring of a large amount of data requires a large amount of computing resources, it is very important to balance computing resources and the rationality of the results.
Footnotes
Authors’ contribution
QL contributed to conceptualization, visualization, data curation, formal analysis, methodology, writing—original draft, and Investigation. ZL was involved in methodology, software, and data curation. RT was involved in conceptualization, investigation, writing—review & editing, and validation. JF was involved in conceptualization, investigation, and resources. HL was involved in investigation, resources, and supervision. RX was involved in writing—review & editing and funding acquisition.
Declaration of conflicting interests
The authors declared no potential conflicts of interest with respect to the research, authorship, and/or publication of this article.
Funding
The authors disclosed receipt of the following financial support for the research, authorship, and/or publication of this article: The authors would like to acknowledge the financial support of National Natural Science Foundation of China, grant number 52079142.