
Abstract
This research explores the flow penetration in porous media by virtue of capillary action and geometric control of the liquid imbibition rate in microfluidic paper-based analytical devices (μPADs) having applications in food quality management, medical diagnostics, and environmental monitoring. We examine changes in flow resistance and membrane geometry, aiming to understand factors influencing capillary penetration rates for various practical applications. We conducted experiments and simulations using lateral porous membranes and altered the flow resistance by changing the liquids or the paper channel geometry by adding cavities. From experiments, it was revealed that by creating a circular cavity in the paper channel, the penetration rate was sufficiently altered. Moreover, increasing the cavity size and type of liquid (w.r.t. viscosity) also caused a decrease in the flow rate. Imbibition rates were also influenced by the position of the cavities in the paper channel. The maximum delay for water was almost 2 times with a 16 mm circular cavity located at 3 cm from strip bottom edge. Overall, we attained a maximum delay in the case of castor oil which was almost 85 times slower than water and 3.7 times slower than olive oil. A good agreement was observed with CFD analysis. We believe that this research would help in developing advance techniques to enhance the flow control strategies in μPADs and indicators.
Introduction
With ever growing world population, new challenges such as global health issues including food security and the diagnosis/prevention of new diseases have become even more important in today's world. Every year, over 1.3 billion tons of edible food are wasted or lost during the food supply chain due to lack of quality control mechanism or hygiene. 1 Food security has become even more essential because of the recent epidemic. Against this backdrop, it is imperative to monitor the quality of food. 2 One of the remedies could be to check and monitor the factors upon which the quality of the perishable food items is dependent on, such as time span of food supply chain and/or environmental conditions including temperature, and humidity. 2 Waste intelligent packaging with condition monitoring indicators during travel and storage can also serve the purpose.3,4 These devices/indicators also play an effective role in determining the remaining shelf life of perishable products5,6 and serve as quality sensors for the safety of food in order to minimize waste. 5
Microfluidics deals with the study of the manipulation and the control of micro/nano liters of fluid flow on small scale. Since twenty-first century, there is an advent in studies related to microfluidic paper-based analytical devices (μPADs) due to their easy fabrication, simpler construction, lower cost, with no maintenance.7–9 μPADs are capable of medical diagnostics,10–12 food quality control3,4,6,13,14 as well as environmental monitoring.15,16 Knowledge of flow control in μPADs is essential for the accuracy of the device.17,18 The main principle used in these devices is fluid imbibition, which is a type of capillary flow in porous media. Capillary action is the ability of a liquid to flow through channels as a result of surface tension.
19
Previously, Lucas (1918) and Washburn et al. (1921) deduced the relationship between the liquid imbibition distance and the time for capillary in tubes, referred to as the Lucas–Washburn equation. The work of Lucas and Washburn helped to understand the capillary flow in porous media.20,21 The Lucas–Washburn equation
In this work, we have developed a novel technique of controlling the liquid imbibition rate in μPADs by creating cavities in the main paper channel. The variables that affect the rate of capillary penetration in porous media are studied using simulation and experiments. Whatman grade 42 paper and liquids (water, olive oil, and castor oil) with different physical properties are selected. Experiments are performed by altering the geometry of porous media, i.e. creating circular cavities of different sizes at different positions along the paper channel. With an increase in flow resistance by the virtue of channel cavities, a time delay in fluid flow occurs. Moreover, here we have provided a simulation model that can effectively be used as a tool to track the fluid imbibition rate through the porous membranes with or without cavities. This can help in device design according to the end user requirements.
Materials and methods
Experimental method
For performing experiments on porous media strips, Whatman Grade 42 filter papers (1442-042 Ashless Filter Paper) are used, with properties as shown in Table 1. Three different liquids, i.e. mineral water (Nestle, Pakistan), olive oil (Himani, Pakistan), and castor oil (Mundial, Pakistan), are used for fluid imbibition. The detailed liquid properties are given in Table 2. A petri dish is used as a liquid reservoir. To cut out the paper with exactitude in order to create lateral strips of dimensions, ℓ × w = (12 × 2) cm, a paper cutter machine (Guillotine, Pakistan) is used, which ensures that each sheet is uniform and consistent. After cutting filter paper strips, cavities of different diameters, such as 16 mm, 12 mm, and 8 mm, were created using a die. For each experiment, strips were held by a sturdy stand with one-strip edge dipped in the reservoir. A camera (Nikon Full HD 1080 pixels) with a micro lens (DMWIFI) was connected to a computer and videos of the fluid imbibition through the entire length of the strip were recorded. Recorded videos were post-processed for data acquisition after every 1 cm rise of fluid in the paper strip. Experiments were performed both for a simple strip with no cavity and for strips with cavities using all three liquids. To ensure the accuracy and reliability of the results, each experiment was performed at least three times. A schematic of the fabrication and experimental setup is shown in Figure 1(a). For measuring the paper porosity, a high-precision weight balance was used to measure the paper mass. Mass of dry paper and mass after liquid imbibition in porous media were measured, and then porosity (

(a) Fabrication of paper strips using paper cutter and experimental setup. (b) Measurement of weight of dry and imbibed paper strips using weight balance.
Properties of porous media used in the study. 43 .

Properties of liquids used in the study. 44

Simulation model
A simulation model was developed using laminar flow and phase transport in porous media formulations. The formulations were implemented using COMSOL Multiphysics 5.6. The numerical domain of 2 cm width and 12 cm length with boundary conditions was used as shown in Figure 2(a). A paper thickness of 0.2 mm and pore radius of 0.25 µm were considered throughout the simulations unless stated explicitly. Different parameters such as porosity, density, viscosity, surface tension, cavity size, and location were varied. In phase transfer physics, we assumed that there was some amount of air trapped in the pores of the dry strip that escapes only from the upper boundary designated as 3 in order to fill the pores with fluid, and we insulated the remaining boundaries. At this boundary, we applied mass flux
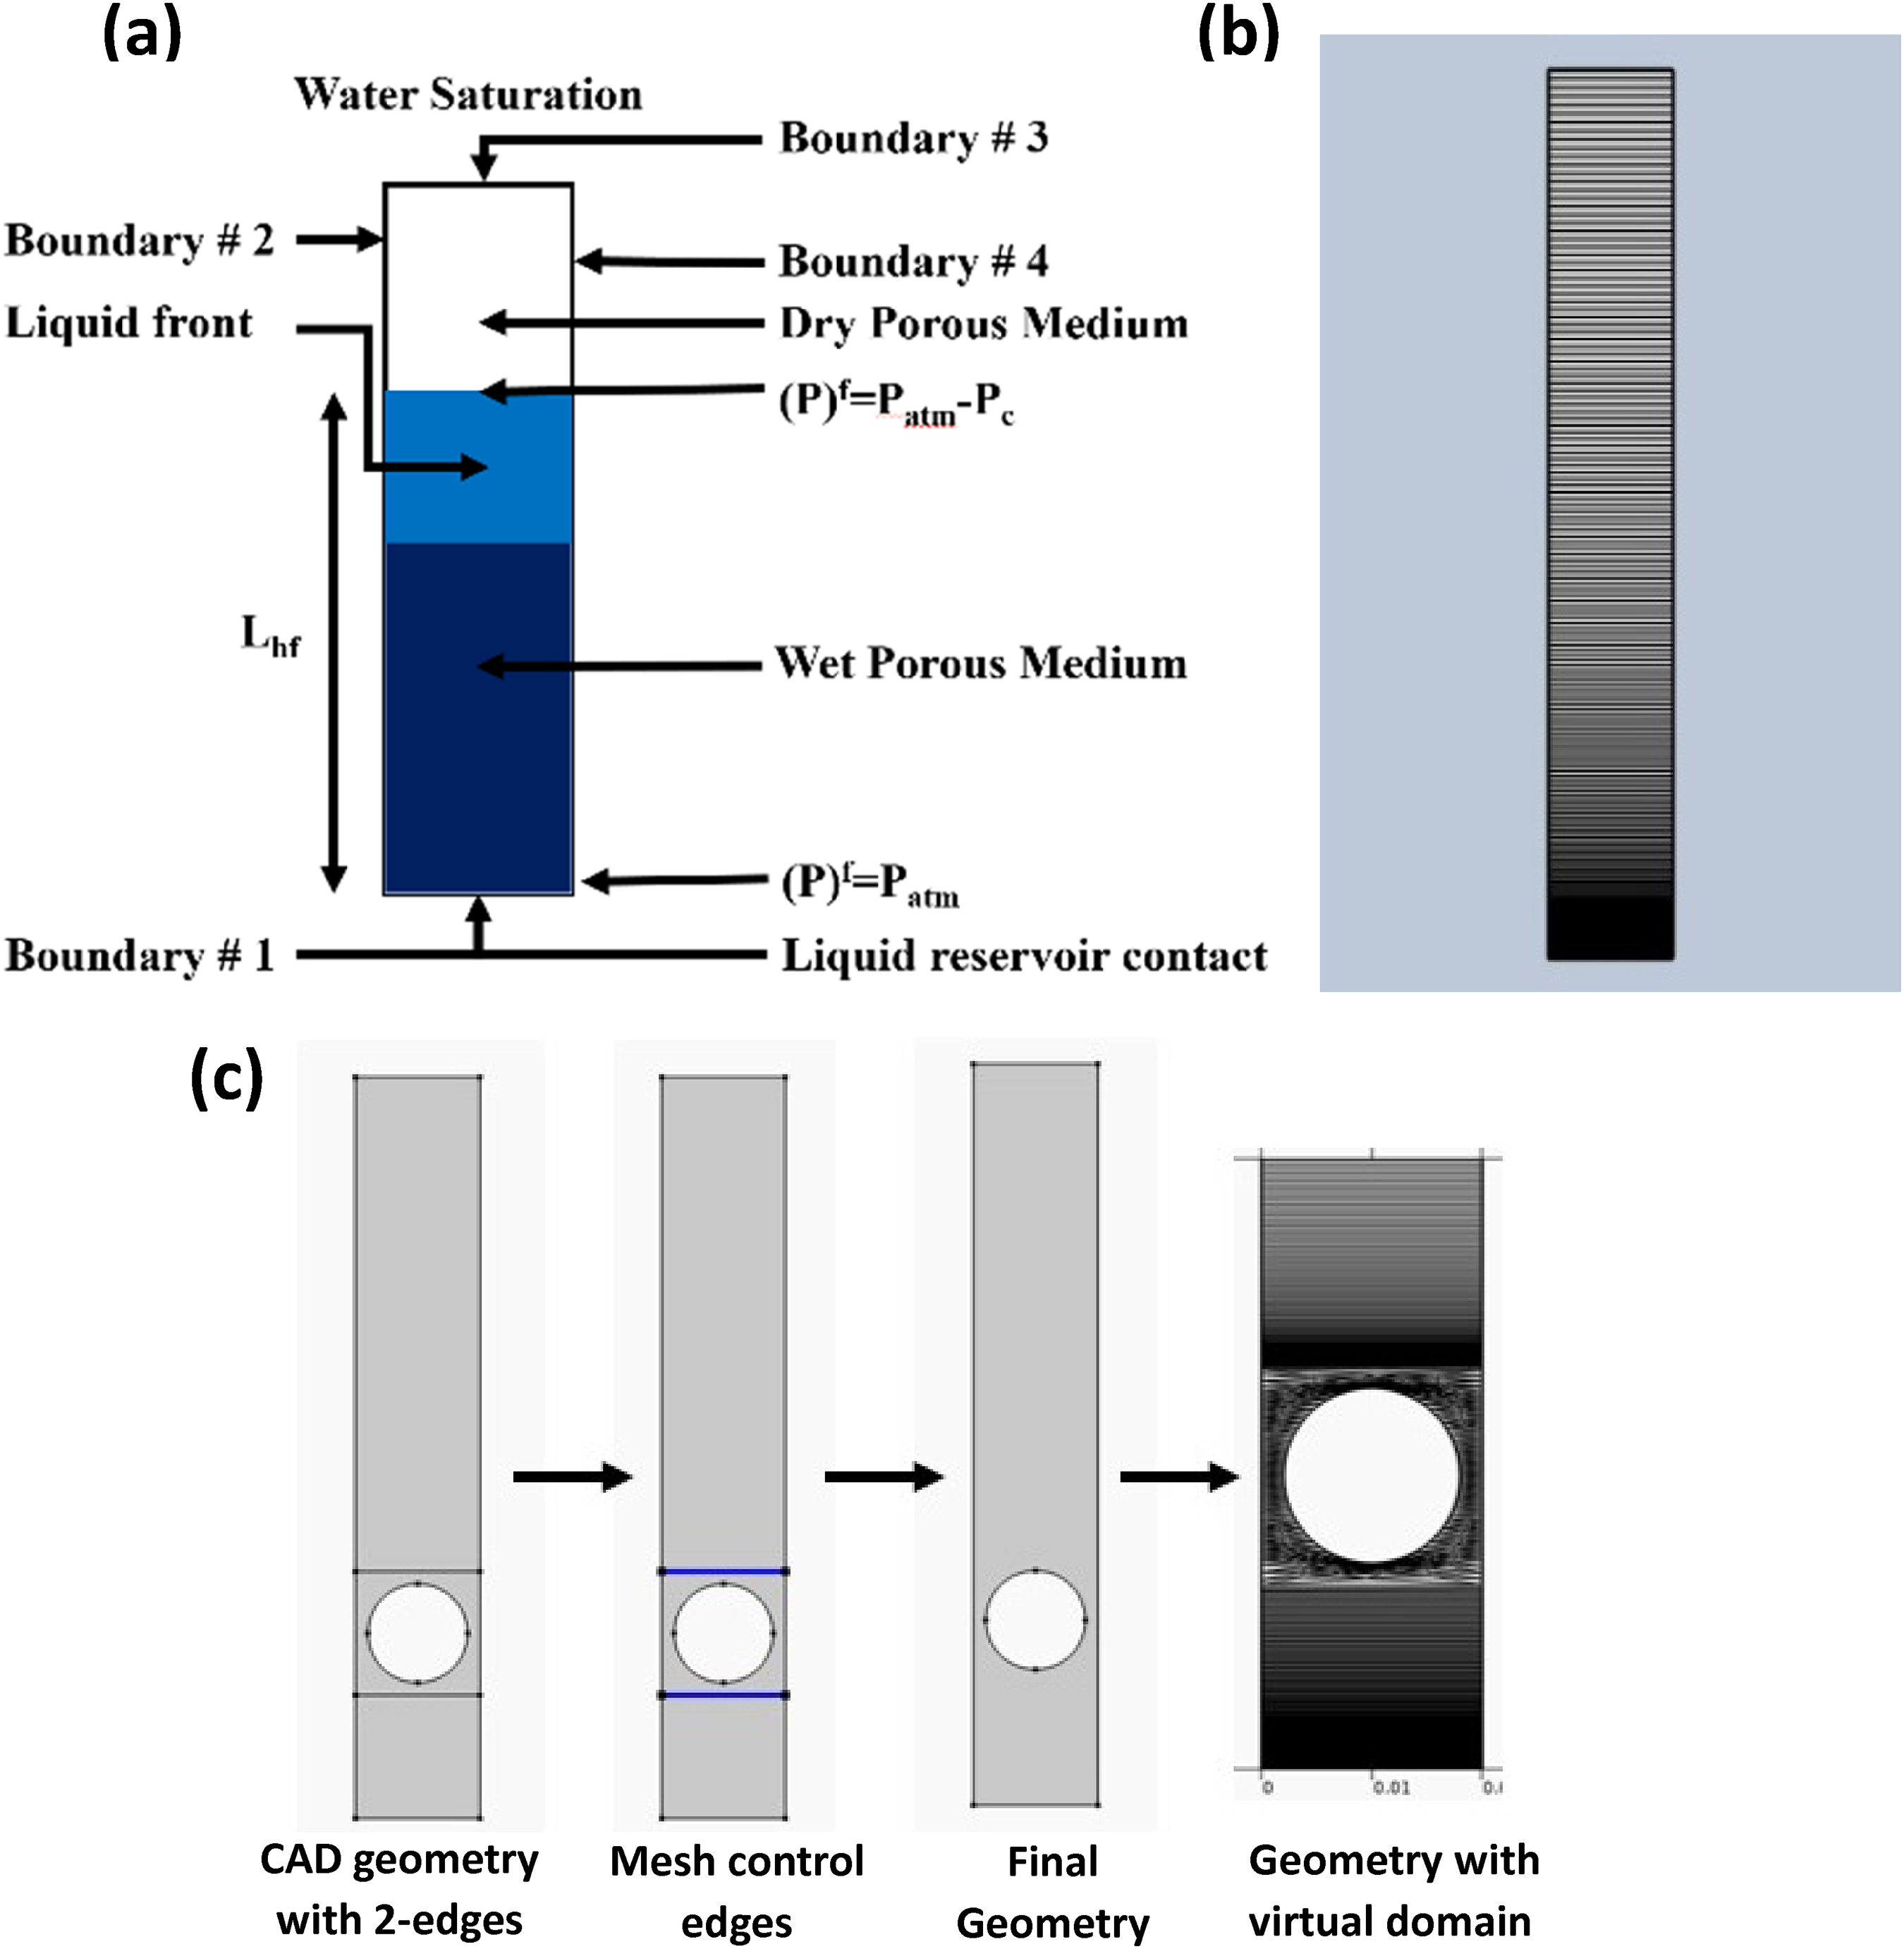
(a) Numerical domain with boundary conditions, (b) meshing of numerical domain without cavity, and (c) meshing of numerical domain with cavity using virtual operations where (P)f is the fluid pressure, Patm is the hydrostatic atmospheric, Pc is the capillary pressure and Lhf is the length of fluid flow.
Darcy's law was used to achieve the pressure gradient for fluid flow through the porous media. So, for the boundary designated as 1, the boundary condition was the hydrostatic atmospheric pressure (Patm) for the water phase, and for the boundary designated as 3, the boundary condition was the hydrostatic atmospheric pressure (Patm) minus the capillary pressure (Pc). We assumed that the remaining two side boundaries (2 and 4) would not affect the flow as there is no mass flux entering or leaving, hence, consider it insulated.
Meshing
After creating geometry and assigning multi-physics to our model, the next step was to build the mesh. Mesh plays an important role in solving the model by dividing geometry into very small elements and solving a finite-element problem. It regulates factors such as size, shape, density, and number of elements in the geometry.
The linear distributive mesh was erected for our model using mapped mesh tool as liquid imbibing through porous media is a linear function. We had chosen normal mesh for simulation as the simulation results for fine mesh and normal mesh were very close as established by the grid independence test. Our mesh size contained maximum and minimum element size, growth rate, correction factor, and resolution of narrow edges of 0.00804 and 3.6E-5, 1.3, 0.3 and 1, respectively. Additionally, it also reduced the computational cost and the time of study. The mesh generated for our model is shown in Figure 2(b). In our simulation analysis, for studying cavity-ridden paper channel, we used virtual operations to define the virtual rectangular domain and the mesh control edges around the cavity and created a triangular mesh in the region. This facilitated the formation of mesh with different types and sizes within a single domain. Mesh size for the domain with or without cavity were kept the same.
Governing equation
The simulation is based on Multiphase flow in porous media which fully couples Darcy's Law and phase transport in porous media. Phase transport in porous media uses the equation given below for the volumetric fraction 
As the total of wetted 
The calculation of capillary pressure 


The Darcy's law formulations are a combination of Darcy's law and the continuity equation. This interface is used to describe the flow of a fluid through a permeable medium, such as porous paper, rock, or soil. By combining these two equations, Darcy's Law interface can provide a more accurate description of fluid flow in porous media.
45

The Lucas–Washburn equation was used to calculate the length of fluid imbibition in porous or capillary media as a function of diffusion co-efficient and wicking time.
According to the Lucas–Washburn Equation, “the rise of fluid in a capillary is proportional to the square root of the capillary's radius, time taken for wicking, and fluid parameters, such as contact angle and surface tension, and inversely related to dynamic viscosity of fluid.”
47

Validation of numerical technique
The simulation model was validated against the experiments and Lucas–Washburn (L-W) equation (Eqn. 2.7) of fluid flow. Experiments were performed for water imbibition in porous media. Figure 3(a) shows that the results obtained by simulations are in good agreement with those obtained by experiments and Lucas–Washburn equation. Figure 3(b) shows the water saturation at successive time intervals obtained from simulation.

(a) Validation of simulation model against experiment and theoretical Lucas–Washburn (L-W) equation (eqn. 2.7), and (b) Simulation results. Water is used as an imbibing liquid.
Results and discussion
The basic aim of this research is to develop effective methods to control the flow rate for better resolution in μPADs and indicators having applications in various scientific and engineering fields. Here, we explore means of flow control by a straightforward and cost-effective technique, comprising of the use of cavities of different sizes at different locations in the main paper channel under various sets of physio-chemical conditions using experimental and numerical approaches. Flux variations of different eco-friendly liquids such as water, olive oil, and castor oil are studied through lateral strips fabricated from Whatman 42 filter paper. The reason for choosing these fluids is to have a clear idea of hydrophilic and/or oleophilic nature of fluid flow in paper membrane.
Firstly, we performed our experiments on paper strip of length 12 cm and width 2 cm. Figure 4(a) shows the liquid imbibition with time along the strip length using different liquids. Results show that as we use higher viscosity fluids, the flow rate decreases i.e. requires more time to travel. Figure 4(b) shows simulation results comparison at same time for different liquids. There is a prominent difference between water saturation, olive oil saturation, and castor oil saturation. At t equal to 50 min, water saturation is almost complete whereas olive oil saturation reached above at 2 cm along the length of strip and castor oil saturation almost reached 1 cm along the length of strip. This indicates that castor oil imbibition is almost 10 times slower than water.

(a) Experimental results of liquid imbibition with time along the strip length without cavity using different liquids and (b) comparison of simulation results using different liquids at same time. Make the zoom same in experimental images. If possible make the simulation and experimental results adjacent to one another for each liquid case.
Effect of size of circular cavities
Figure 5(a) and (b) shows the simulation and experimental results at same time for different liquids with circular cavity of diameter 16 mm located at 3 cm from the strip edge. The flow rate has decreased and the water saturation at t equal to 70 min is only up to 8 cm of the strip. Similarly, the olive and castor oil imbibition has reduced with the inclusion of cavities in the water flow channel. Further, we added circular cavities of diameter 8 mm, 12 mm, and 16 mm to check the effect on fluid imbibition in porous media. Figure 6(a)–(c) shows comparison of simulation and experimental results of liquid imbibition with time along the strip with circular cavity at 6 cm from strip edge using water. In Figure 6(a), we created a circular cavity of 8 mm, and the result showed a 19.5% decrease in flow rate as compared to the strips without cavity. In Figure 6(b), we created circular cavity of 12 mm and a 37.4% and 15% decrease in flow rate was attained as compared to strips without cavity and with cavity of 8 mm respectively. Similarly, in Figure 6(c), a circular cavity of 16 mm was placed and 43.9%, 20.45%, and 4.76% decrease in flow rate was attained as compared to strips without cavity, and with cavity of 8 mm and 12 mm, respectively. Moreover, similar results were obtained from our simulation model under the same conditions. It can also be seen that the larger the size of the cavity, the larger the deviation from the L-W equation (eqn 2.7). This is expected as larger the flow resistance in porous membrane channel induced by the geometrical effects, lesser is the effectiveness of L-W model to predict the flow dynamics. Further, experiments and simulations were performed with olive oil [Figure 6(d)–(f)] and castor oil [Figure 6(g)–(i)] under same conditions. Trends obtained were similar, where we attained a maximum of 7.2% and 4.17% decrease in flow imbibition rate by placing a 16 mm cavity compared to strip without cavity for olive oil and castor oil, respectively. Therefore, as we increased the size of cavity it provided more resistance in liquid imbibition, thereby decreasing the liquid imbibition rate. The creation of the cavity in strip disturbs the pressure gradient that affects the capillary flow. The affected pressure gradient resists the removal of air from the porous membrane boundary 3 referring Figure 2 (boundary parallel and away from reservoir contact boundary) and diminishes the capillary action consequently decreasing the imbibition rate.

Comparison between simulation and experimental results of liquid imbibition along the strip length using different liquids. (a) For water, (b) For olive oil and (c) For castor oil. Here, the diameter of the cavity was kept as 16 mm. Experimental and simulation conditions were kept same.

Liquid imbibition with time along the strip with circular cavity at the strip center using different liquids used as imbibing liquid. (a–c) Water, (d–f) olive oil and (g–i) castor oil.
Effect of location of cavities
We also explored the effect of changing the position of circular cavities in paper strips. Figure 7(a)–(c) shows the experimental and simulation results of liquid imbibition with time along the strip with circular cavity at 3 cm from strip edge using water. Here, we changed the position of our cavity from 6 cm to 3 cm from the strip bottom edge. Figure 7(a) shows that with a circular cavity of diameter 8 mm, flow rate decreased by 13.4% as compared to the 8 mm cavity at 6 cm from strip bottom edge. Similarly, we got 10.5% decrease by using a 12 mm cavity, and 16% decrease by using 16 mm cavity located at 3 cm from strip edge compared to the corresponding size of cavity located at 6 cm from strip edge [See, Figure 7(b) and (c)]. Similar results are obtained from our simulation model. It can also be seen that the lower the location of the cavity near the bottom strip edge, the larger is the deviation from the L-W equation (eqn 2.7). Similar experiments and simulations were performed with olive oil [Figure 7(d)–(f)] and castor oil [Figure 7(g)–(i)]. Same trends were obtained where we attained a maximum 30.8% and 36.3% decrease in flow rate by using 16 mm cavity located at 3 cm from strip edge compared to the corresponding size of cavity located at 6 cm from strip edge for olive oil and castor oil, respectively. Further, to explore the effect of cavity location on liquid imbibition rate, we considered a cavity of 16 mm diameter at three different locations such as 6 cm, 4.5 cm, and 3 cm from strip bottom edge with water as imbibing liquid as shown in Figure 8. The results showed that the liquid imbibition rate decreased by 1.4 times, 1.6 times, and 1.7 times, respectively, compared with the no-cavity case. The position of the cavity on strip impacts the flow greatly when it is far from boundary 3 making air removal difficult. As the removal process of air slows, it provides more resistance, and the wicking time increases. Also, as we create cavities nearer to the bottom of strip, it provides resistance and disruption to capillary action from the start of the flow thus decreasing liquid imbibition rate. Therefore, flow rate sufficiently decreases by shifting the location of cavities nearer to the strip bottom edge as it provides more resistance from the start of flow.

Liquid imbibition with time along the strip with circular cavity at the strip bottom using different liquids as imbibing liquid. (a–c) Water, (d–f) olive oil and (g–i) castor oil.

Comparison of experimental results of water imbibition with time in lateral paper strip with and without cavity. Cavities of same diameter of 16 mm are placed at different locations. Inset shows the experimental images of the water imbibition along the cavity-ridden lateral porous membranes.
Effect of liquid viscosity
Figure 9 shows the experimental results of liquid imbibition with time along the strip length with cavity using water, olive oil, and castor oil. Figure 9(a) shows that with a cavity of 8 mm diameter located at 6 cm from the strip bottom edge castor oil imbibition is 3.35 times slower than olive oil. By increasing the diameter of cavity to 12 mm at the same position, castor oil imbibition became almost 66 times slower than water and 3.4 times slower than olive oil as shown in Figure 9(b). A further increase in cavity diameter to 16 mm at the same location caused imbibition of castor oil to become 60.3 times slower than water and 3.6 times slower than olive oil as shown in Figure 9(c). Figure 9(d)–(f) and Figure 9(g)–(i) shows the experimental results of liquid imbibition with time along the strip length with cavity now placed at 4.5 cm and 3 cm from the strip bottom edge, respectively, and experiments were repeated with cavity of diameter of 8 mm, 12 mm, and 16 mm using water, olive oil, and castor oil. Figure 9(d) indicated that castor oil was 70.62 times slower than water and 3.4 times slower than olive oil. Figure 9(e) indicated that castor oil was 71.5 times slower than water and 3.8 times slower than olive oil. Figure 9(f) the time required to flow the castor oil to the length of strip became 66 times slower than water and 3.7 times slower than olive oil. From Figure 9(g), we noticed that water is 20.7 times faster than olive oil and castor oil is 3.5 times faster than olive oil. In Figure 9(h), we noticed that olive oil is 0.048 times slower than water. Figure 9(i), (16 mm circular and 3 cm from strip edge) experimental data showed that castor oil was 85 times slower than water and 3.7 times slower than olive oil. Because of large cavity size, it provides more resistance in flow and high viscosity fluids required more time to flow. Straight lines show that ℓ still varies as t1/2 for all the cases.

Experimental results of liquid imbibition with time along the strip length with cavity using different liquids.
Comparison with theoretical model
In Figure 10(a), non-dimensional imbibing time, t* is the ratio of experimental time and theoretical time from the Lucas–Washburn equation (t* = texp/tL−W). The ratio of location of the cavity (L) to the length of the strip (ℓ) was varied while the ratio of cavity diameter (d) to strip width (w) was kept constant. L/ℓ ≈1 corresponds to cavity located centered at the strip top edge while L/ℓ ≈ 0 corresponds to strip bottom edge. The graph shows that we got a maximum of ∼1.9 times decrease in flow imbibition time at L/ℓ ≈ 0.2 compared with Lucas–Washburn equation in case of water. Similarly, we got ∼1.7 times and ∼1.4 times decrease for olive oil and castor oil, respectively. d/w was kept constant at 0.6. Thus, smaller the value of L/ℓ, larger will be the disruption to capillary flow through the porous membrane, and larger will be the flow imbibition time. In Figure 10(b), we got a maximum of ∼1.85 times decrease in flow imbibition time at d/w ≈ 0.8 compared with Lucas–Washburn equation in case of water. Similarly, we got ∼1.6 times and ∼1.2 times decrease for olive oil and castor oil, respectively. L/ℓ was kept constant at 0.5 Thus, larger the value of d/w, larger will be the capillary flow disruption through the porous membrane, and larger will be the flow imbibition time. Thus, the control of these variables provides a unique way of controlling the fluid imbibition rate in devices and indicators composed of porous membranes.

Comparison of decrease in flow rate compared with Lucas– Washburn equation (eqn. 2.7). Here, t* (= texp/tL−W) is the non-dimensional imbibing time that is defined as the ratio of experimental time and theoretical (Lucas–Washburn) time, L is location of cavity, ℓ is length of strip, d is size of cavity and w is width of strip. (a) By changing the ratio L/ℓ and keeping d/w = 0.6. (b) By changing the ratio d/w and keeping L/ℓ = 0.5.
Conclusions
In this research, we have used circular cavities of different sizes located at different locations of the paper channel with an aim to provide a new method for better flow control and resolution in μPADs. The flow imbibition time is measured using experimental and simulation approaches. We have used three different liquids to explore a variable range of fluidic properties on Whatman grade 42 filter paper. Following are the main conclusions:
Flow imbibition time scales can be decreased to a large extent depending on the size and location of the cavities. The creation of cavities changes the pressure gradient along the paper channel, disrupting the capillary action leading to a decreased imbibition rate. We attained almost two times decrease in flow time compared with Lucas–Washburn (L-W) for water having 16 mm cavity nearer the strip bottom edge at the distance of 3 cm. The more the cavity is located nearer to the strip bottom edge, the more flow resistance it offers. On the other hand, the larger the size of the cavity, the larger is the flow resistance. Overall, we attained a maximum delay in the case of castor oil which was almost 85 times slower than water and 3.7 times slower than olive oil. We found that despite the creation of channel cavities the flow length ℓ still scales as ≈t1/2 for all the cases. The number, size, and location of the cavities in the paper channel can be optimized according to the flow control requirements.
We believe that our results will be useful for better flow resolution and control in future porous media-based devices/indicators. Moreover, we have provided extensive experimental data that can be used for future applications and mathematical modeling. In future, the fluid flow can be observed by changing cavity type i.e. instead of using circular cavity rectangular, hexagonal, and triangular cavities can be used according to the requirement.
Footnotes
Acknowledgements
This work was supported by the Technology Transfer Support Fund, Higher Education Commission, Islamabad, Pakistan (HEC-TTSF-74), National Research Program for Universities, Higher Education Commission, Islamabad, Pakistan (HEC-NRPU-14816), and Pakistan Engineering Council (PEC), Islamabad, Pakistan.
Author contributions
Syed Rehman Jamil: data curation; formal analysis; validation; investigation; original draft; and writing, Muhammad Salman Abbasi: conceptualization, funding acquisition; supervision; project administration; resources; and writing—review & editing, Ali Turab Jafry: funding acquisition; project administration; and writing—review & editing, Tanveer Shahzad: investigation; visualization; and writing—review & editing, Shahid Sarwar: visualization; data curation; original draft; and writing, Muhammad Hammad Qureshi: visualization; original draft; and writing—review & editing).
Declaration of conflicting interests
The authors declared no potential conflicts of interest with respect to the research, authorship, and/or publication of this article.
Funding
The authors disclosed receipt of the following financial support for the research, authorship, and/or publication of this article: This work was supported by the Higher Education Commission, Pakistan, Pakistan Engineering Council, (grant number NRPU-14816, TTSF-74, FYP).
Author biographies
Syed Rehman Jamil is enrolled as MSc student in Mechanical Engineering at University of Engineering and Technology, Lahore. He completed his bachelor's in mechanical engineering at University of Engineering and Technology, Lahore, Pakistan. His research interests include flow in porous media, heat transfer, computational fluid dynamics, power sector and renewable energy conversion systems.
Muhammad Salman Abbasi has been working as an Associate Professor in the Faculty of Mechanical Engineering at University of Engineering and Technology, Lahore, Pakistan. He completed his PhD in Mechanical Engineering at Sungkyunkwan University, South Korea in 2019. His research interests include microfluidics, electric field effects on droplets, modelling multiphase flow problems in COMSOL Multiphysics, complex interfacial phenomenon and heat transfer.
Ali Turab Jafry has been working as Associate Professor in the Faculty of Mechanical Engineering at Ghulam Ishaq Khan Institute of Engineering Sciences and Technology since 2018. He completed his PhD in Mechanical Engineering at Sungkyunkwan University (SKKU), South Korea. His research is focused on the development of clinical, chemical, and environmental diagnostic platforms using microfluidics and functional materials.
Tanveer Shahzad has been working as a Research Assistant in the Faculty of Mechanical Engineering at University of Engineering and Technology, Lahore, Pakistan. He is doing his Master in thermal power from Mechanical Engineering Department, University of Engineering and Technology, Lahore. His research interests include fluid flow in porous media based microfluidic devices.
Shahid Sarwar completed his bachelor's in mechanical engineering at University of Engineering and Technology, Lahore, Pakistan in 2023 and has been currently working as a associate Engineer in research and development department at Haier, Pakistan. His research is interests include Designing, Gas sector and CFD analysis.
Muhammad Hammad Qureshi completed his bachelor's in mechanical engineering at University of Engineering and Technology, Lahore, Pakistan in 2023 and has been currently working as a Trainee Engineer in the Preventive Maintenance department at Bestway Cement Limited, Pakistan. His research interests include porous media, flow control, channel cavity, μPADs, CFD analysis.