
Abstract
As shallow coal reserves continue to deplete rapidly, deep mining has become an unavoidable course of action. In the process of deep coal mining, affected by blasting, mining, and excavation, the coal-rock interface often encounters the action of compression-shear composite load. The interface crack directly affects the stability of the coal-rock structure. Uniaxial compression experiments have been conducted on rock and coal-like material with pre-existing interfacial oblique cracks to study the crack propagation criterion of the rock and coal-like material interface. An image acquisition system is used to record the surface speckle field of the whole process of specimen failure. The strain fields and stress intensity factor of the sample at different times are obtained by digital image correlation. At the same time, the stress field near the crack tip is calculated. The results show that with the increase of loading, two strains of localization bands are formed on the surface of the specimen. One of the strain-localized bands starts at the lower tip of the prefabricated crack and propagates along the vertical interface. The other starts at the upper tip of the prefabricated damage and propagates along the interface direction. It can be seen that the lower tip of the prefabricated crack enters into the crack fracture process zone earlier than the upper tip. The strain localization band narrows gradually with the load increase, and then macro cracks appear. The initiation of two tips is suitable for different fracture criteria. The lower tip is dominated by the maximum circumferential tensile stress, and the upper tip is dominated by shear stress. The specimens eventually fracture along the interface. The evolution of the strain field during the failure process of rock and coal-like material can reflect the generation and propagation of the crack.
Keywords
Introduction
Coal resources play a pivotal role as a strategic safeguard for China's primary energy supply, with coal reserves buried at depths exceeding 1 km constituting approximately 75% of the untapped reserves.1–5 As the demand for coal resources continues to surge, the depletion of shallow coal reserves is accelerating, making deep mining an increasingly prevalent practice. Nevertheless, this shift to deep mining is not without its challenges, as it entails facing various hazards, including rock bursts, coal and gas outbursts, roof collapse, and water inrush incidents.6–9 Among these, the occurrence of rock bursts is becoming more frequent and intense, posing a significant hindrance to the sustainable development of the coal industry.10–13 Therefore, addressing and managing these challenges effectively becomes imperative for ensuring the long-term viability of the coal economy. Some studies have shown that during the coal mining process, the coal-rock interface is subjected to compressive-shear combined loads due to the influence of mining-induced stress, extraction, and tunneling.14–16 The instability and failure of coal-rocks under different stress states are caused by the initiation, propagation, and coalescence of interface cracks,17–20 which directly affect the stability of the coal-rock structure.21–24 Therefore, studying the initiation and propagation of interface cracks in deep coal-rock formations under compressive-shear combined loads is of great significance.
Engineering practices indicate that in deep mining environments, many dynamic ground pressure disasters are essentially the result of the overall instability of the ‘rock-coal’ combined structure under the disturbance of strong mining, as illustrated in Figure 1 for the theoretical model of coal-rock layers in deep coal mining. Scholars investigating the fracture mechanism of coal-rock combined bodies have employed techniques such as acoustic emission and electromagnetic radiation to monitor the fracture process of coal-rock combined bodies and have established corresponding mechanical models.25,26 Dou et al.27–29 analyzed the acoustic-electric effects and electromagnetic radiation characteristics of coal-rock formations under load and discovered the phenomenon of asynchronous peak values for two types of characteristic signals. Zuo et al. 30 compared and analyzed the acoustic emission characteristics and failure characteristics during the destruction process of pure coal, pure rock, and coal-rock formations. Zhao et al. 31 conducted experiments on coal-rock formations and analyzed the precursory information of their sudden instability. Yao et al.32–34 used PFC software to analyze the failure modes and influencing factors of coal-rock interactions and proposed corresponding damage, constitutive models. Huang et al. 35 and Chen et al. 36 studied the influence of loading rate and coal-rock height ratio on the mechanical properties of coal-rock composite specimens and obtained fracture criteria for three-dimensional interface cracks. In addition, Yu et al. 37 studied the failure mechanism of anchor structures composed of coal-rock-anchor. Chen et al. 38 analyzed the nonlinear evolution characteristics of energy during the loading process of coal-rock formations, established the softening constitutive relationship of interfaces, and obtained the relationship between roughness and interface crack fracture characteristics. Yang et al. 39 used cyclic loading-unloading tests to analyze the energy storage characteristics of different coal-rock formations and discussed the energy-driven mechanism of their failure, obtaining the main forms of interface crack propagation.
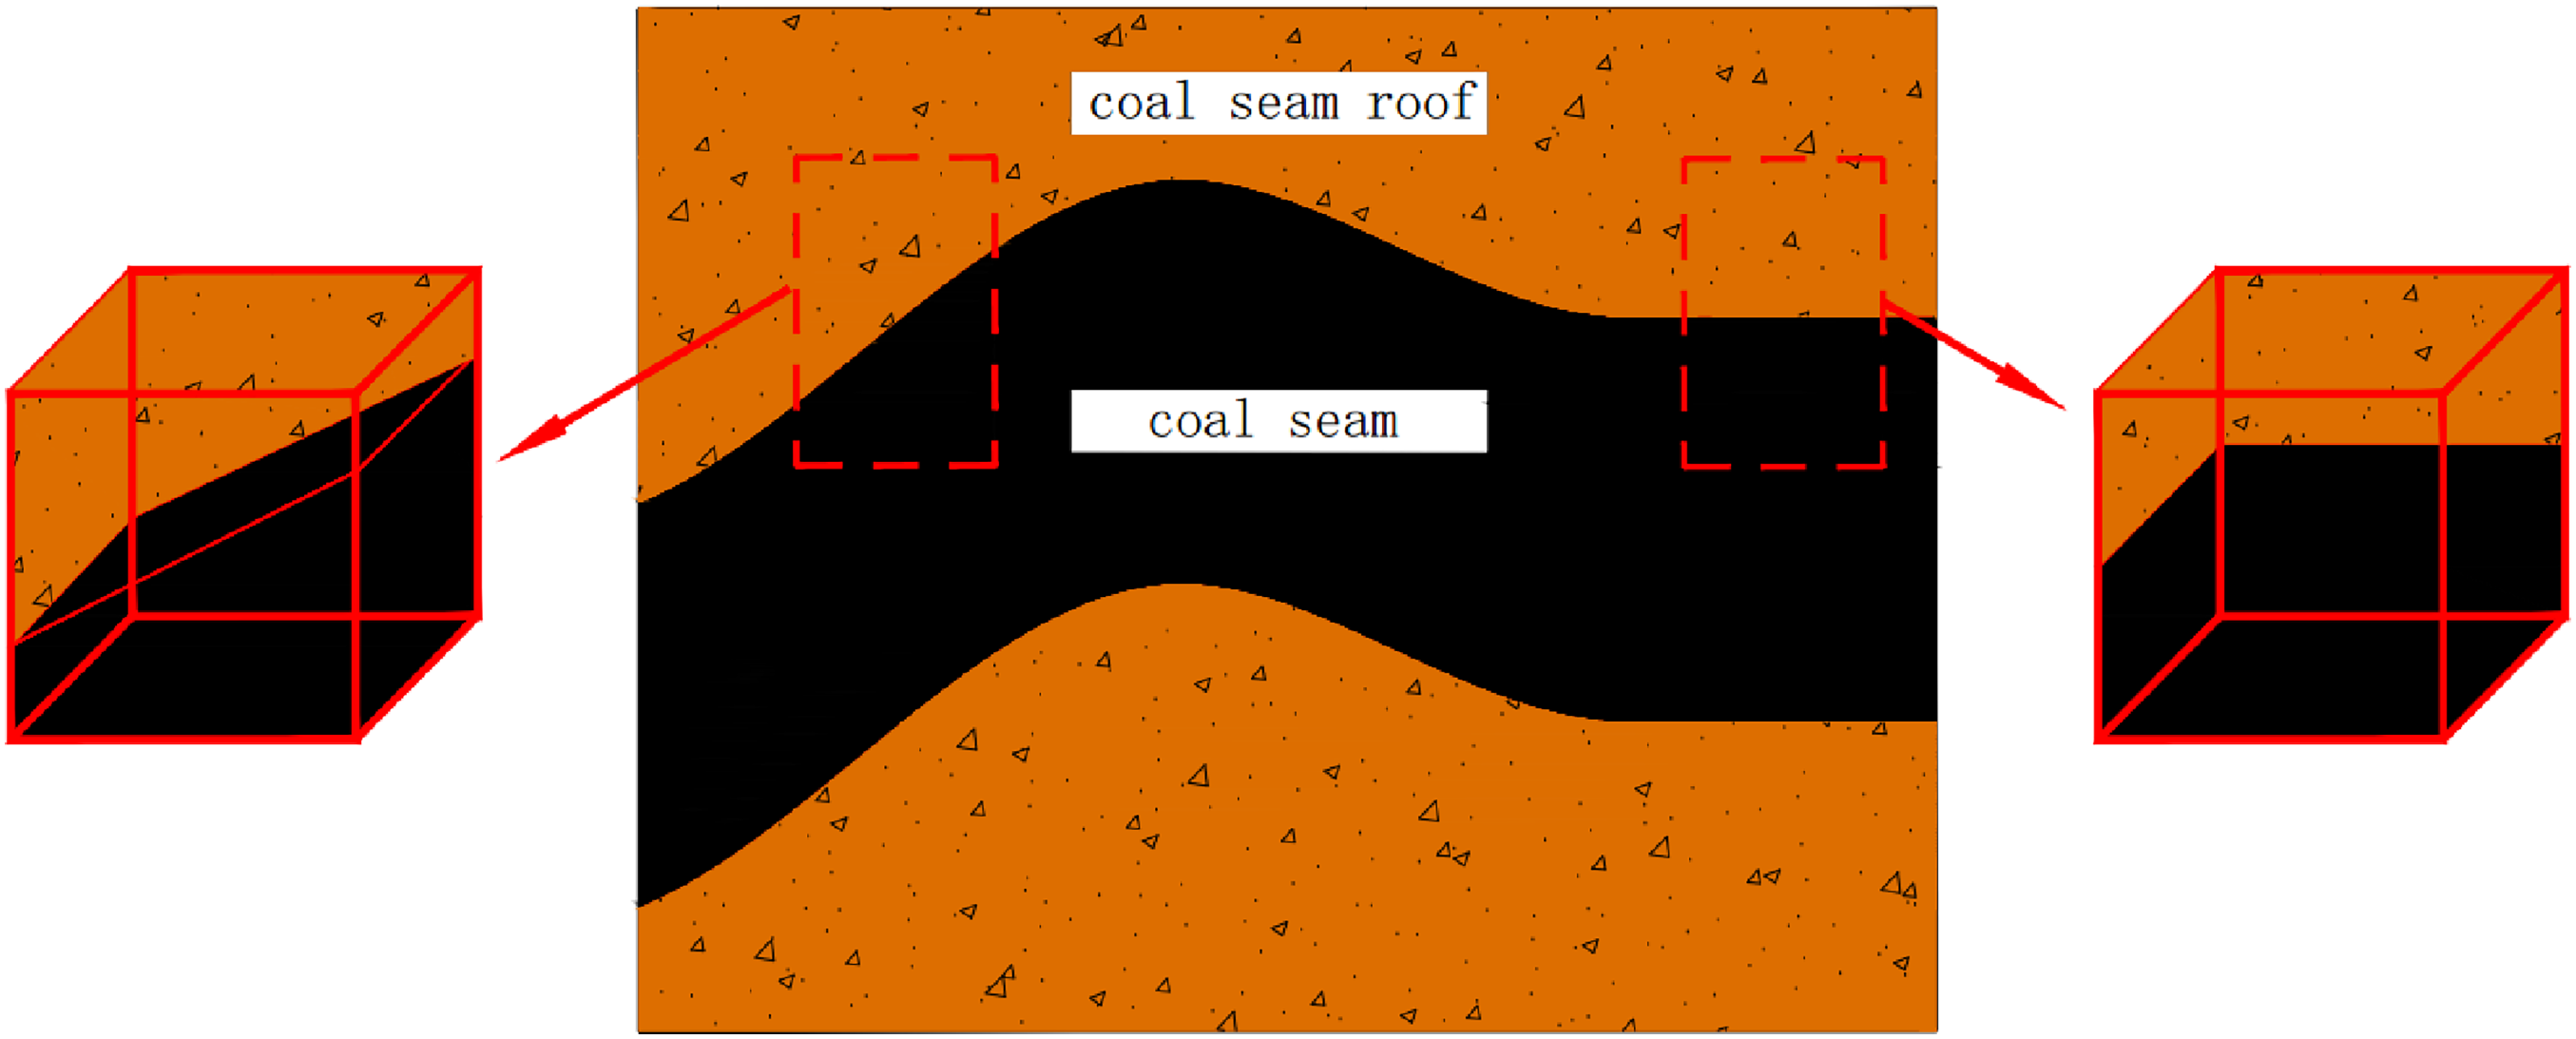
Modes of coal-rock combined body.
Scholars have made notable progress in studying interface cracks in coal-rock formations. 40 However, the existing research on the deformation and failure behavior of coal-rock combined body models predominantly focuses on intact and parallel coal-rock combined bodies, lacking sufficient consideration of inclined interfaces and damage between coal and rock in coal mining. Furthermore, the uniaxial compressive strength of rock is significantly higher than that of coal, 41 leading to the complete failure of the coal portion in experiments, while the rock portion remains intact, a scenario that does not align with actual mining conditions. This paper focuses on conducting compression-shear combined fracture experiments on coal-like and rock specimens with pre-existing interface cracks. It uses digital image correlation to obtain the displacement and strain fields on the specimen surface, exploring the laws of microcrack initiation and propagation during the failure process of coal-like and rock specimens. The research results will contribute to the improvement of the fracture theory of coal-rock interface cracks.
Experimental equipment and procedure
Experimental materials and sample preparation
The experimental materials are rock and coal-like materials. Rock is from Fang Shan, China, and coal-like material is made by artificial mixing. The main material parameters of rock and coal-like materials are shown in Table 1. The whole rock is cut into prismatic shapes and the middle position is grooved to pre-existing cracks. To ensure that the rock and coal-like material have sufficient humidity, the processed rock is placed in the curing room for 24 h. Place the processed rock on one side of the mold and the coal-like material on the other side during pouring. The proportion of coal-like material is cement:water:sand:gravel = 1:0.43:1.36:5.4.
Physico-mechanical parameters of rock and coal-like material.

Finally, the samples are placed in the maintenance room for 28 days. The prepared samples are shown in Figure 2 (a). The size of the specimen is 110 mm × 110 mm × 110 mm. The crack in the specimen measures 20 mm in length, and 2 mm in width, and is oriented at an angle of 60° to the direction of compressive stress, which is shown in Figure 2 (b).

Schematic diagram of the rock-coal-like material sample. (
Testing equipment
To improve the speckle contrast on the specimen surface, the whole surface of the sample is painted white with spray paint and sprayed with random black scattered spots after the white paint dries. The loading device adopts the nonlinear mechanics’ experimental system of the State Key Laboratory for Geomechanics and Underground Engineering of China University of Mining and Technology (Beijing), whose measuring range is 500 KN, and the loading rate is 0.004 mm/s. The strain resolution of this system is 0.0005%, the strain test range is 0.0005%∼2000%, and the displacement resolution is less than 0.01 pixel. The matched-2D speckle system is used to shoot the speckle field on the specimen surface. The camera resolution is 2448 × 2050 and the maximum frame number is 15 FPS. The supplementary light source is a high-intensity LED lamp. The testing equipment is shown in Figure 3.
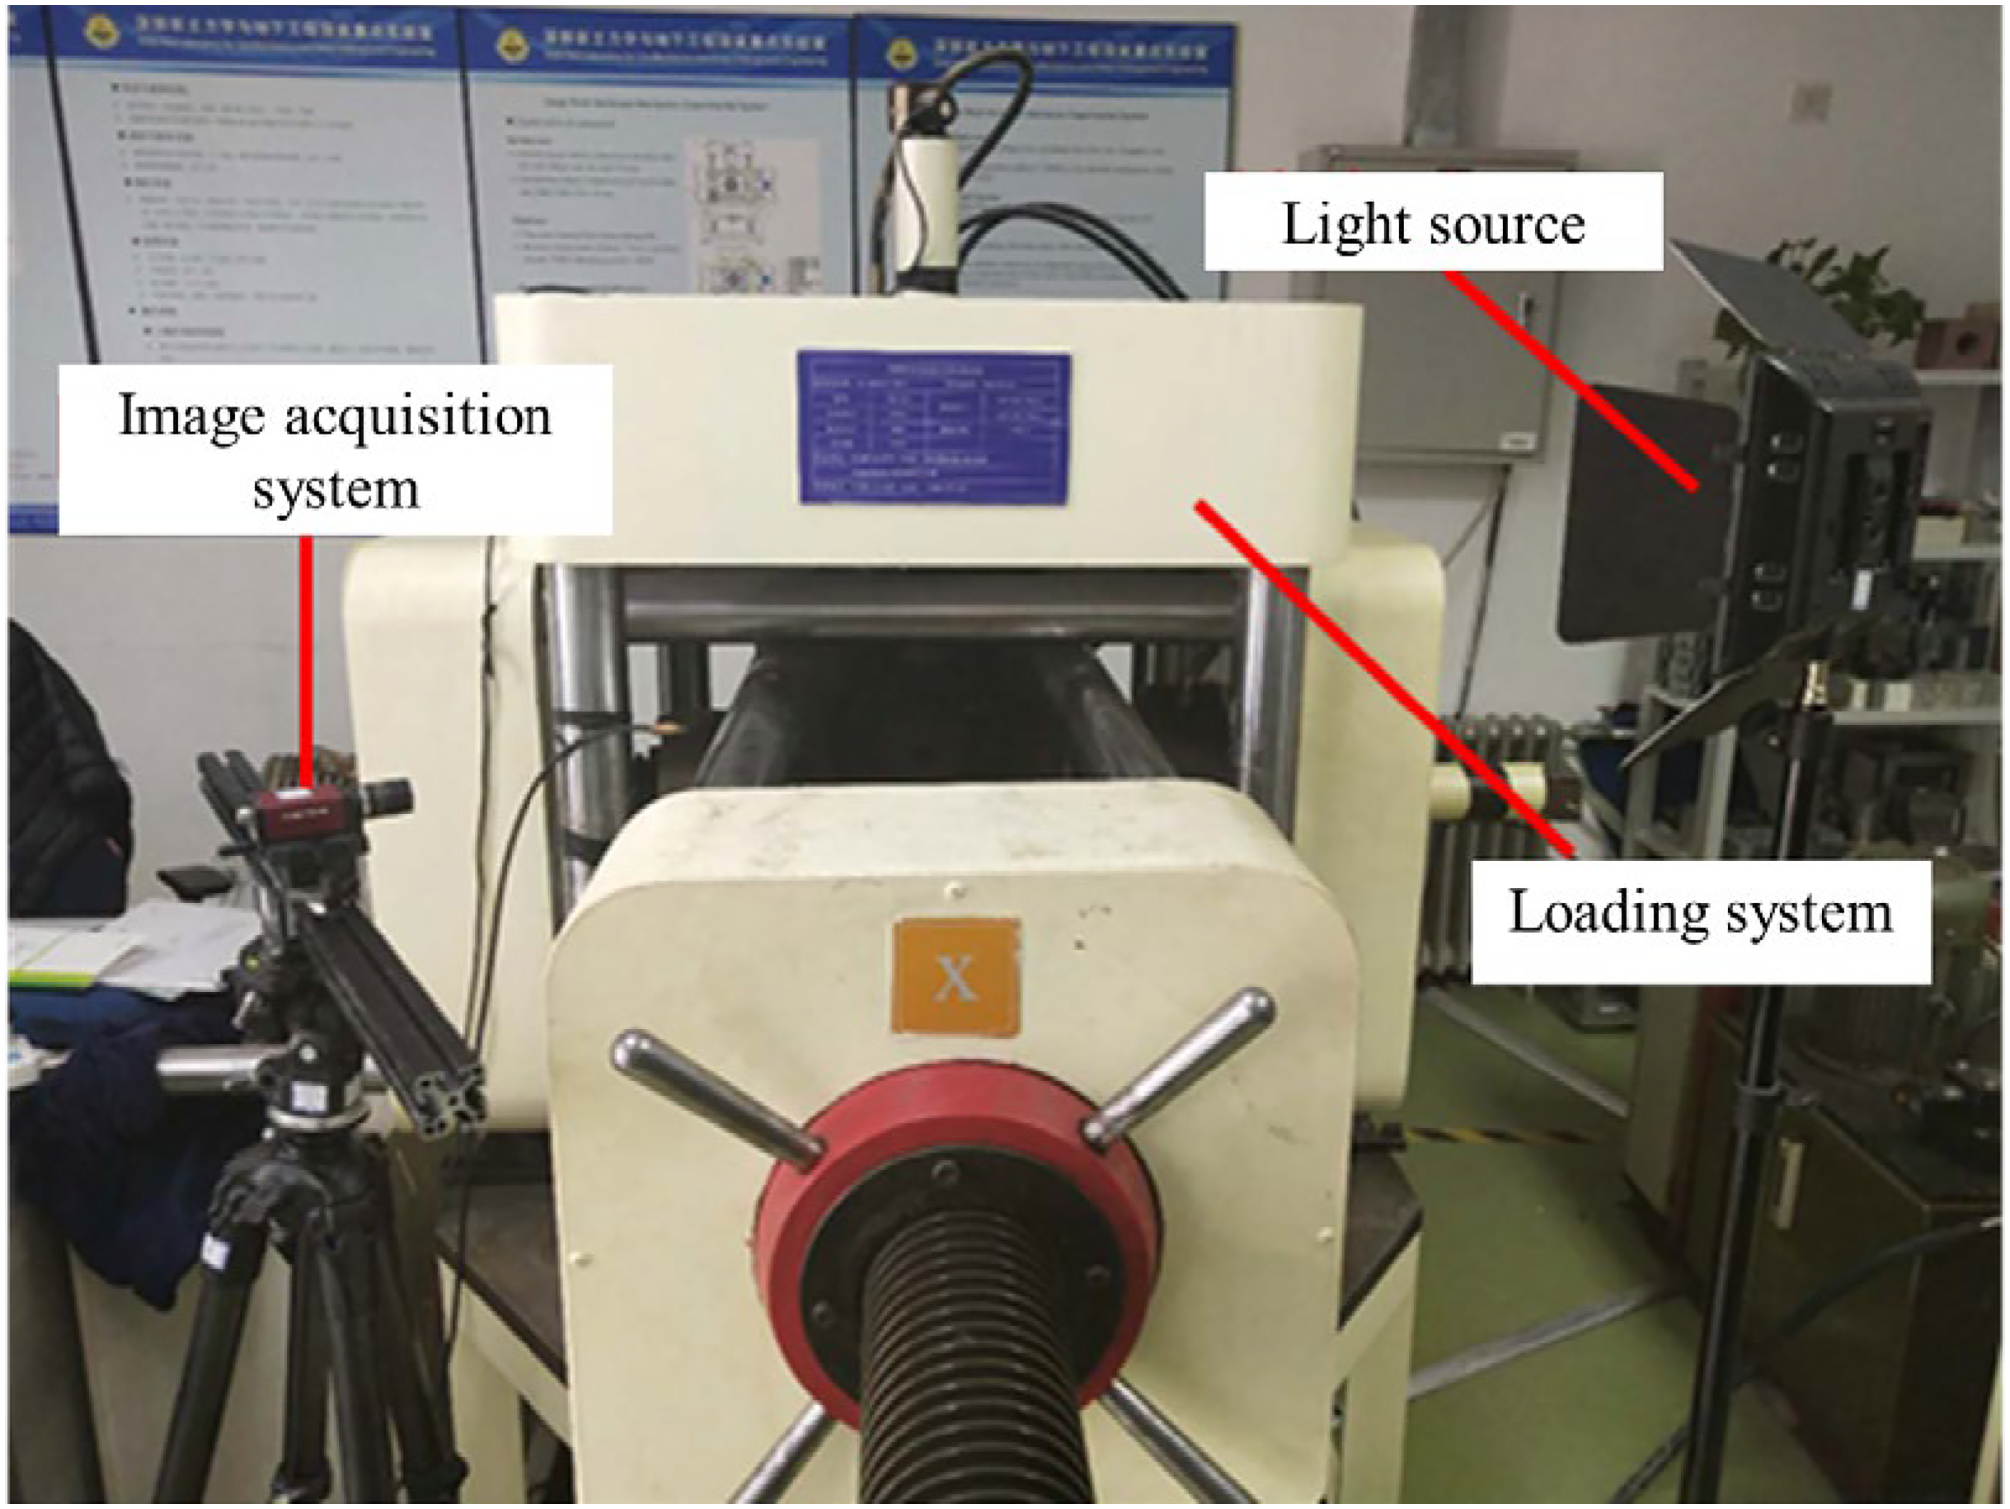
The testing equipment.
Experimental results and analysis
Load-displacement curve of a specimen
The axial load-displacement curve is shown in Figure 4. The initial stage of the loading process is the compacting stage, in which the internal structural surface is compacted, resulting in a concave loading curve. Subsequently, the sample enters the linear elastic stage, which can be sustained until the specimen fractures, and there is no obvious plastic deformation in the whole process. When the specimen fractured, the axial load of DL1, DL2, DL3, DL4, DL5, and DL6 is 600.6 KN, 528.7 KN, 549.0 KN, 508 KN, 501KN, and 571KN, and the peak stress of DL1, DL2, DL3, DL4, DL5, and DL6 is 49.6 MPa, 43.7 MPa, 45.4 MPa, 41.5 MPa, 40.9 MPa, and 46.3 MPa.

The curves of axial load-displacement.
Before the samples fracture, the initiation and propagation of cracks are accompanied by the entire experimental process, which is not reflected on the loading curve. The reason is that the occurrence of defects such as internal cracks is the process of local damage evolution of the sample, and also the process of damage accumulation. The accumulation rate of damage is far less than the loading rate, the instantaneous damage accumulation has no obvious influence on the overall compressive strength of the specimen. Therefore, the loading curve cannot reflect the development process of internal defects. To observe the development process of internal defects of the sample, the digital image correlation (DIC) is used to obtain the displacement field and strain field on the surface of the sample.
Rock-coal-like material sample fracture process
As depicted in Figure 5, the fracture outcomes of the six specimens share similarities, showcasing wing-shaped cracks in the coal-like material and rock composite that ultimately extend along the specimen's interface. The failure process of the coal-like material and rock composite specimens with interface cracks mirrors that of a single material, but the initiation time and crack morphology at the two tips differ significantly: the left tip initiates cracking first, extending through the weaker part of the lower material, while the right tip extends along the interface, resulting in the final failure of the specimen along the interface. The analysis suggests that the crack formed at the left tip is a wing-shaped crack initiated by the maximum circumferential stress, whereas the initiation of the crack at the right tip is dominated by shear stress. The influencing factors leading to this type of failure are primarily attributed to differences in material types. The failure process of sample DL1 is analyzed in detail. The specific failure process of sample DL1 is shown in Figure 6. The testing equipment utilizes displacement loading at a speed of 0.005 mm/s, and both the testing and acquisition devices commence simultaneously, and the image acquisition time is synchronized to the loading stage of the testing equipment, as shown in Figure 6(a). There is no visible crack after loading to 200 s, as shown in Figure 6(b). About 280 s, a wing crack has been formed at the lower tip of the pre-existing crack, and the wing crack propagates perpendicular to the interface, as shown in Figure 6(c). At the time of 350 s, the wing crack is visible. As shown in Figure 6(e), at about 450 s, a crack is formed at the upper tip of the pre-existing crack, and the crack propagates along the interface. At the time of 500 s, the sample fractured along the interface.

The final failure states of specimens. (a) D1; (b) DL2; (c) DL3; (d) DL4; (e) DL5; (f) DL6.
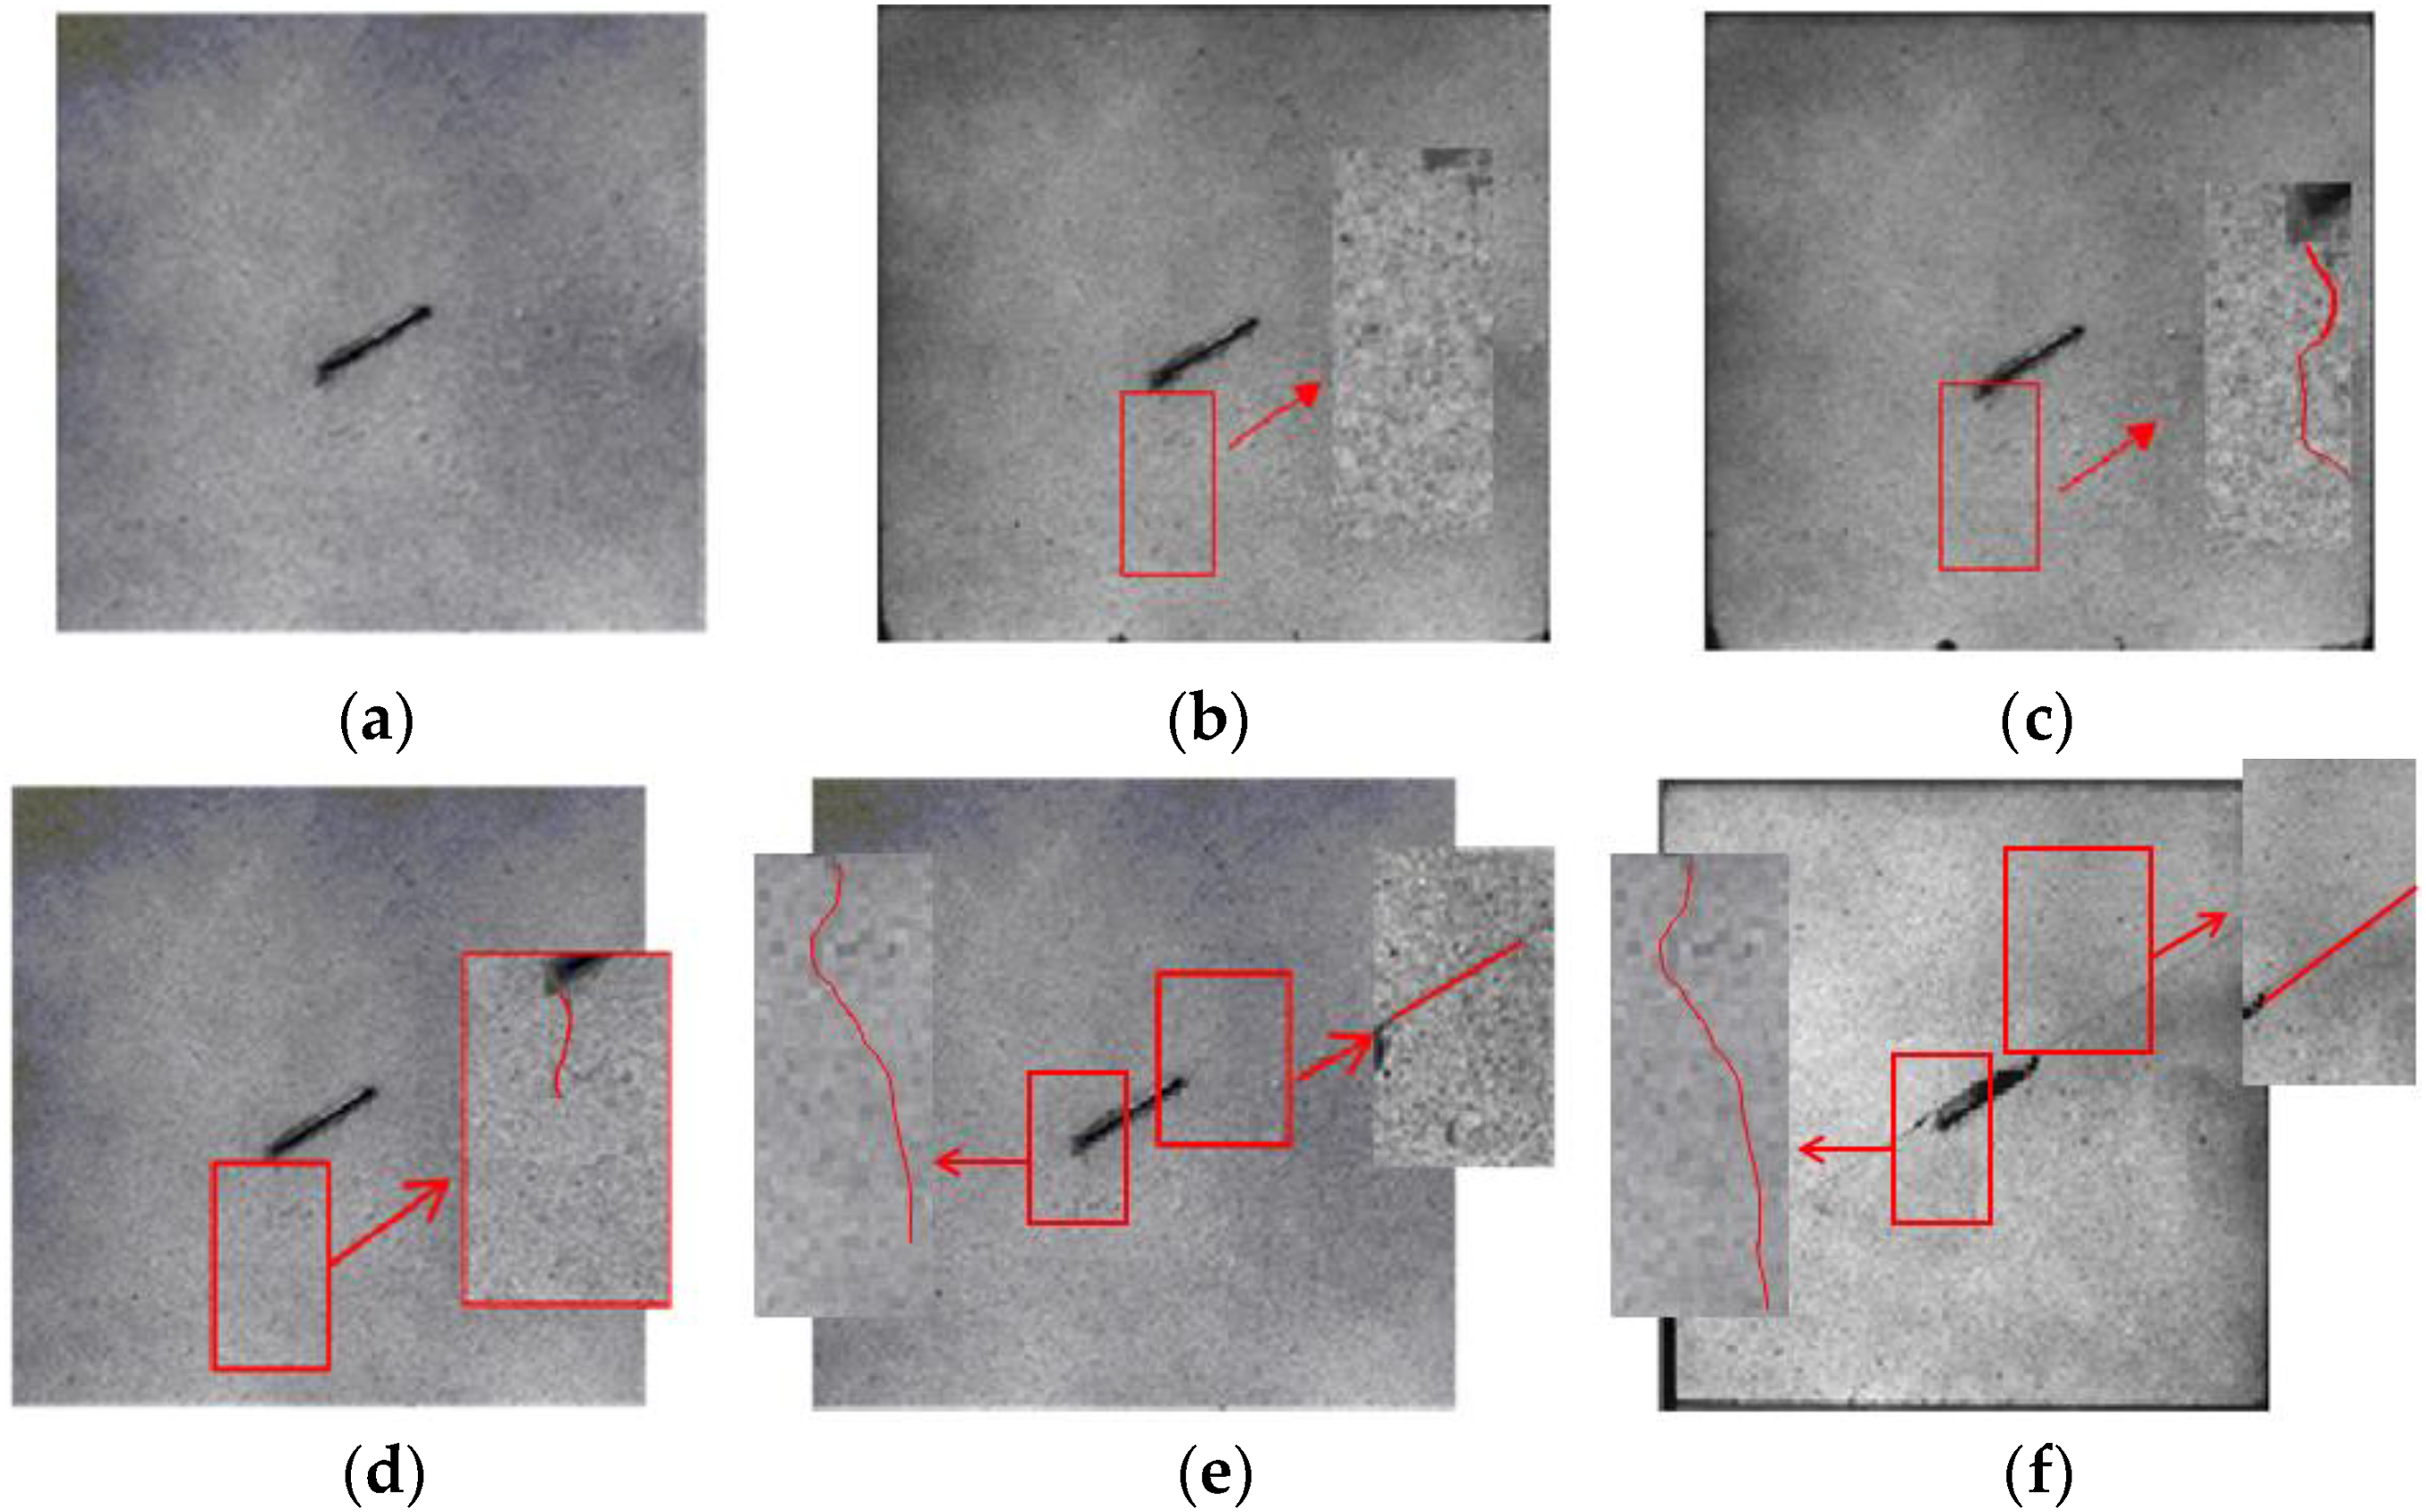
Failure process of specimen DL1. (a) 0 s; (b) 200 s; (c) 280 s; (d) 350 s; (e) 450 s; (f) 500 s.
Test result of DIC
Strain field analysis
The corresponding strain field is obtained by numerical differential calculation of the displacement field, and Figure 7 shows the Mises strain program of different moments in the fracture process of each specimen. From Figure 6, we can see that the final failure of the specimens is along the interface crack, and the fracture failure mode of the specimens are similar. The strain field of sample DL1 is analyzed in detail. In the initial loading, the specimen has no obvious strain localization band and this stage is the compaction stage of the specimen, as is shown in Figure 7(a) 200 s later, a strain localization band appeared near the lower tip of the precast crack. The strain localization band extends downward perpendicular to the interface. There is no obvious strain concentration area at the top tip of the pre-existing crack, which means the lower tip of the pre-existing crack enters the crack fracture process zone earlier than the upper tip, as shown in Figure 7(b). At this stage, there is no obvious crack propagation occurred, but the strain localization zone began to appear at the crack tip, which illustrates that micro-cracks appear near the crack tip. This stage is the nucleation stage of the crack. After 80 s, two strain localization bands can be seen, one of which is perpendicular to the interface and consistent with the direction of macro crack growth in Figure 6(d). The other localization zone propagates upward along the interface, which is consistent with the macro crack growth direction in Figure 6(e). Then after 70 s, the two localization bands become significantly narrower, which indicates that the strain concentration increased. Loading to 450 s, the strain at the interface is much larger than that perpendicular to the interface, which shows that the degree of crack propagation along the interface is larger than that perpendicular to the interface, and the sample is easy to be fractured from the interface.
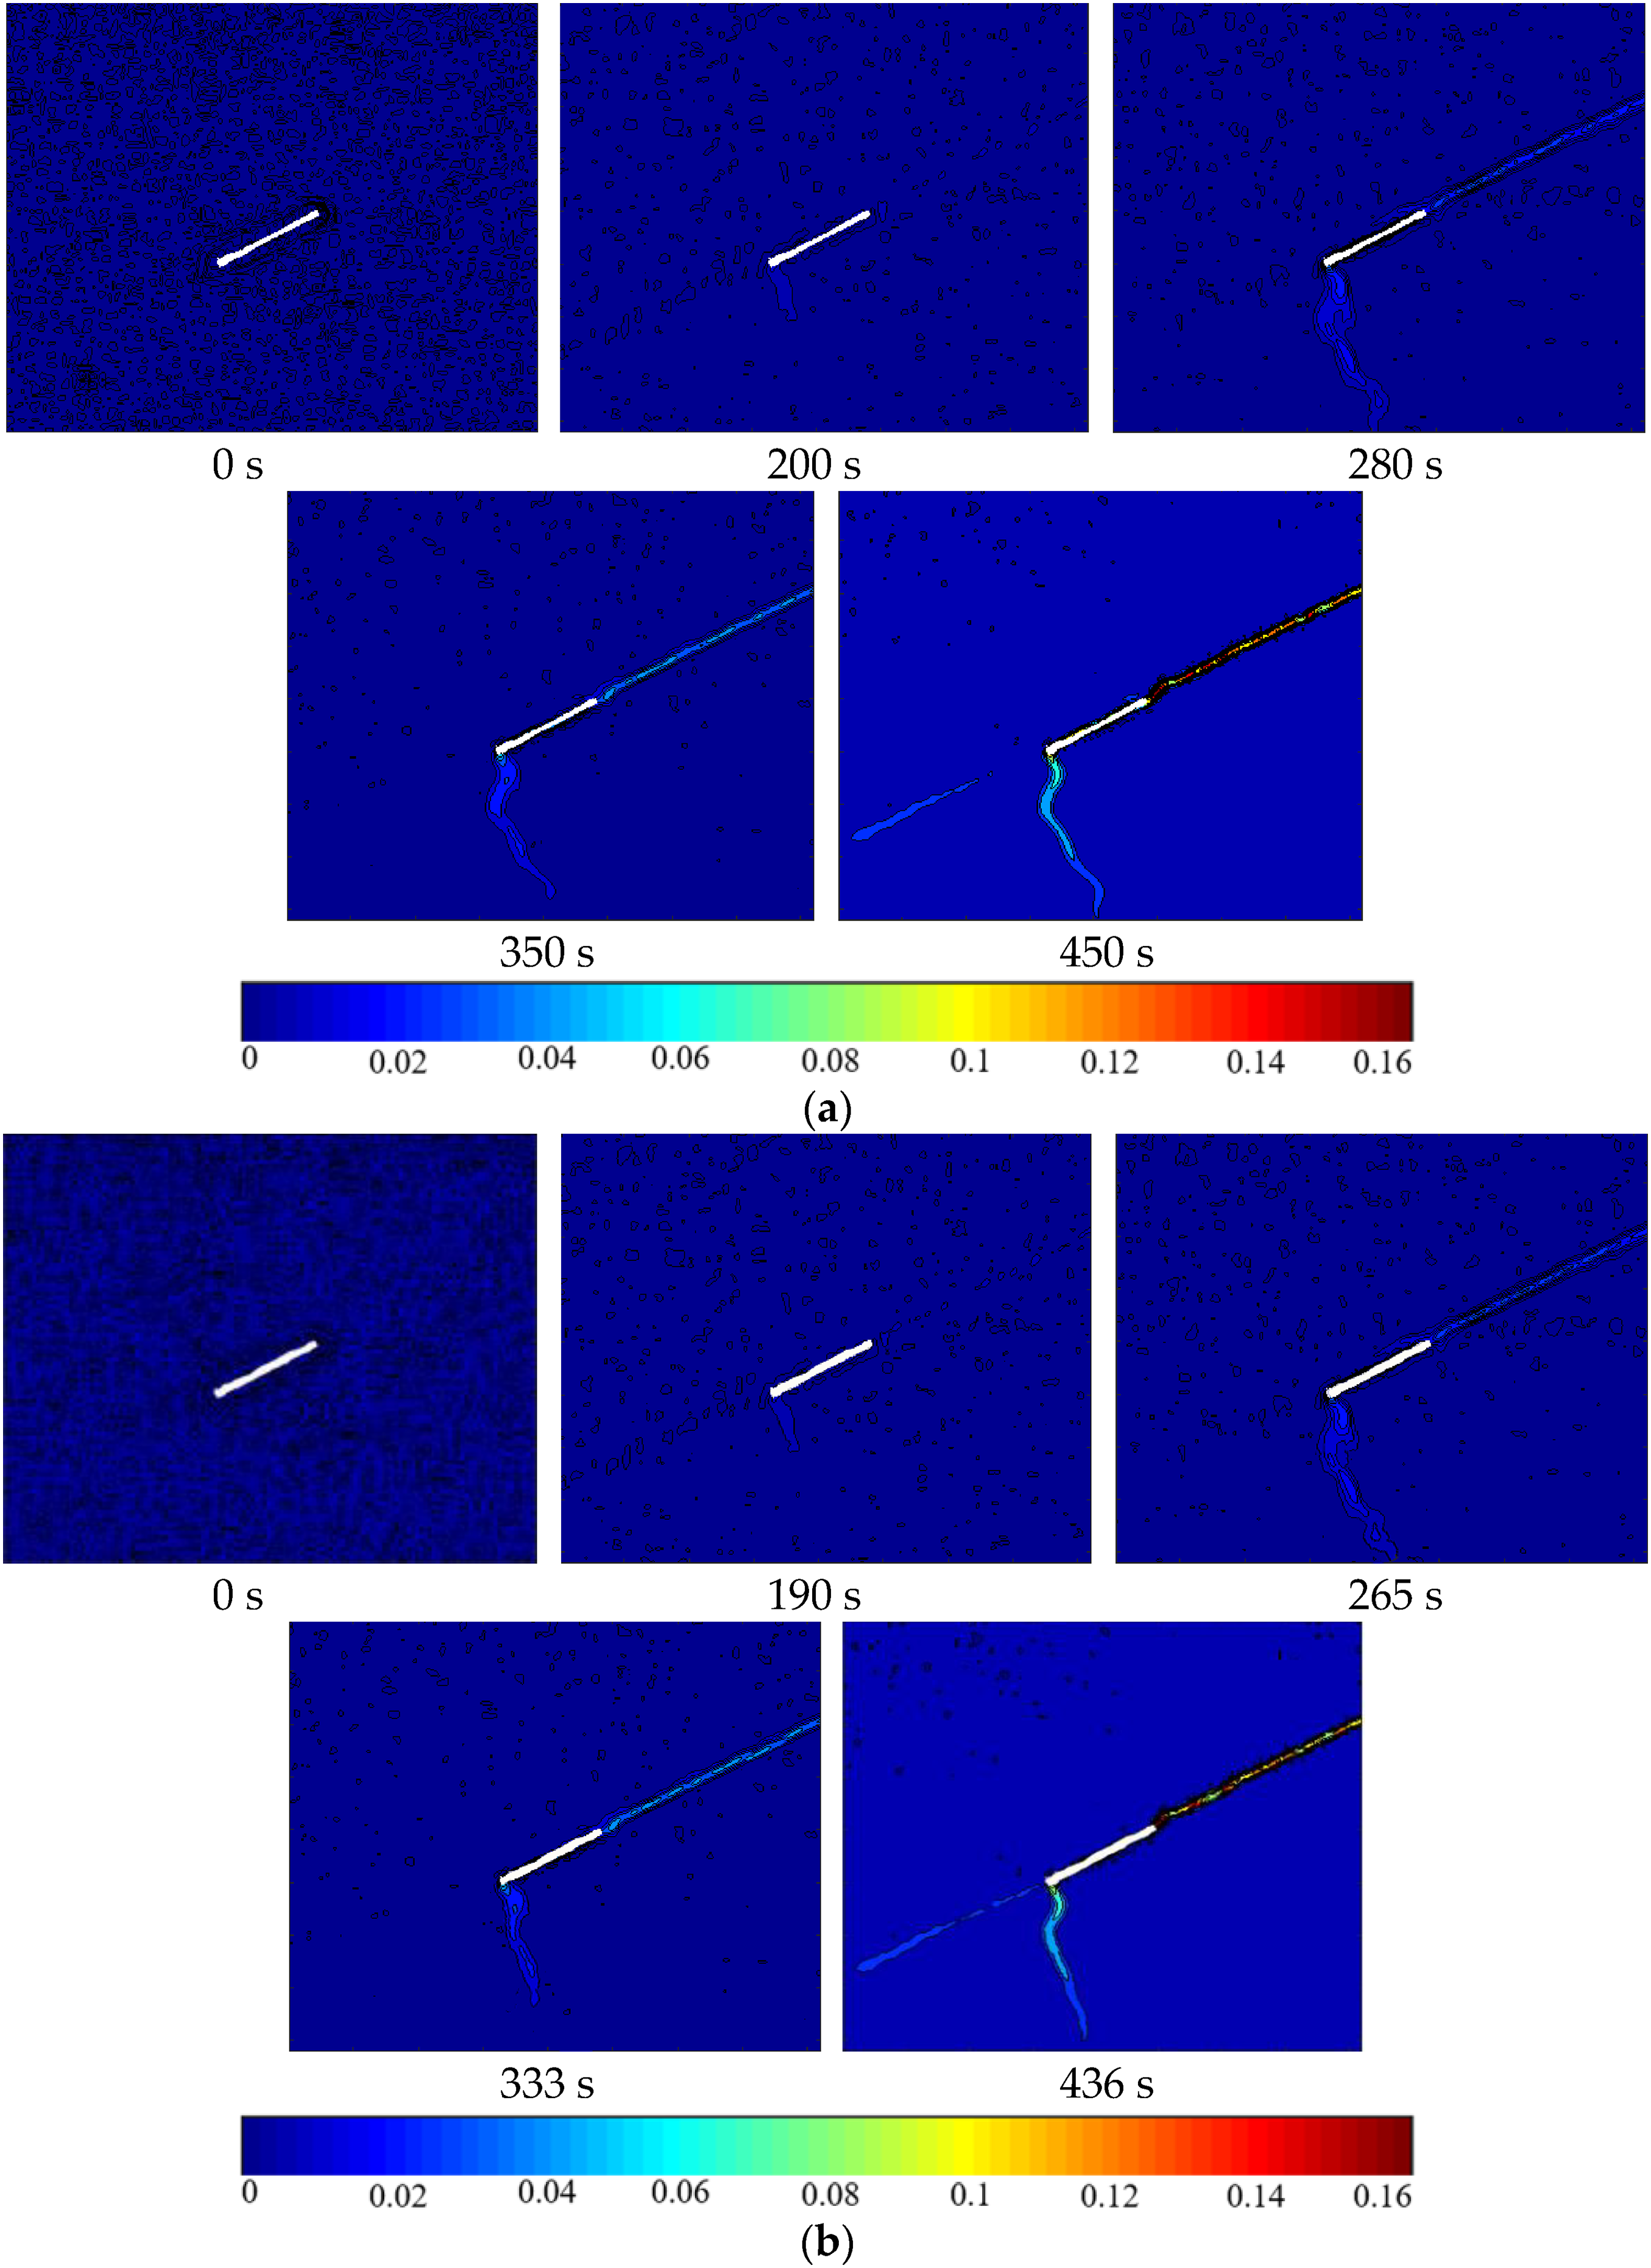
Full-field strain contour maps of each specimen. (a) Full-field strain contour maps of DL1; (b) Full-field strain contour maps of DL2; (c) Full-field strain contour maps of DL3; (d) Full-field strain contour maps of DL4; (e) Full-field strain contour maps of DL5; (f) Full-field strain contour maps of DL6.
To more specifically describe the stages of crack propagation, eight points are selected near the crack area, as shown in Figure 8. The change curves of the equivalent strain of eight measuring points are compared with the strain (macroscopic strain) curves of the specimen obtained by testing equipment. The absolute value of the third main strain is taken as the equivalent strain, the strain time curves of observation points are shown in Figure 9. The results show that the strain at the crack propagation path is larger than that at other places. Points 1, 3, 7, and 2 are on the crack propagation path, and the strain rapidly increases beyond the macroscopic strain of the specimen. The strain of the other four points is the same as the macroscopic strain of the specimen. By analyzing the strain variation rule of the points on the crack path, it is found that the strain is relatively stable at the initial stage of loading, and then increases rapidly, which indicates the crack enter the crack fracture process zone. The lower tip enters the crack fracture process zone at the time of 168 s, while the upper tip enters the crack process zone at the time of 192 s. Then the strain growth rate of the observation point slows down with the increase of the load, which indicates that the crack enters into the stable propagation period. The lower tip enters into the crack stable propagation period at the time of 284 s, while the upper tip enters into the crack stable propagation period at the time of 330 s.

The locations of observation points.

The locations of observation points.
Numerical simulation
Numerical simulation model
Performing numerical analysis through the discrete element method, a coal-like material and rock combined body model featuring cracks and weak planes are created using particle flow code (PFC) software, as depicted in Figure 10. The upper section of the model represents rock, while the lower part represents coal-like material. The interface defines the interaction between coal-like material and rock-combined body using a smooth joint model. The model specimen is inclined at a preset angle of 30°, rotating clockwise along the horizontal direction at the center. It includes open cracks with a width of 2 mm and a trace length of 20 mm. The model incorporates three types of contact bonding parameters, as detailed in Table 2.

Numerical simulation model.
Microscopic contact mechanical parameters of the model.

Utilizing deformation strength parameters obtained from uniaxial compression tests, microscopic contact mechanical parameters for two coal-rock materials are calibrated, as shown in Table 2. Curves (a) and (c) depict the stress–strain relationships of calibrated rock specimens in axial and transverse directions, while curves (b) and (d) illustrate the stress–strain relationships of calibrated coal-like material specimens in axial and transverse directions. These curves provide insights into mechanical performance indicators and failure modes for both coal and rock materials. The predominant failure mode observed for both specimens is inclined shear failure, as demonstrated in the stress–strain curves of the calibrated uniaxial compression tests presented in Figure 11. The coal-like material specimen exhibits an elastic modulus of 33.05 GPa, a uniaxial compressive strength of 43.64 MPa, and a Poisson's ratio of 0.18. In comparison, the rock specimen features an elastic modulus of 65.14 GPa, a uniaxial compressive strength of 95.10 MPa, and a Poisson's ratio of 0.27. These calibrated microscopic parameters, in conjunction with their corresponding macroscopic deformation and failure characteristics, serve to characterize the mechanical performance of the coal-like material and rock-combined body.

Stress–strain curves and failure modes of calibrated specimens.
Following the calibration of microscopic parameters for coal rocks, a simulation model of a coal-like material and rock-combined body featuring pre-existing fractures and smooth joint surfaces is established using parallel bonding and smooth joint models. The objective is to explore the failure modes and mechanical behavior of coal-rock specimens under compression-shear loading.
Numerical simulation results analysis
Figure 12 illustrates the evolution pattern of cracks within a fractured coal-like material and rock-combined body under compression-shear loading. The figure delineates the initiation and progression of cracks across four stress conditions, with red denoting tensile cracks and blue indicating shear cracks. At the initial point (Point o), before loading, the coal-like material and rock-combined body specimen exhibit no cracks apart from pre-existing open fractures. As the load increases, the load–displacement relationship linearly rises, and bonding failure transpires at the smooth joint interface in the coal-like material and rock-combined body, resulting in cracks spanning the entire interface (Point a). With the continued increase in load at both ends of the specimen, cracks within the coal rock extend roughly vertically along the lower tip of the pre-existing fractures, propagating through the bottom of the specimen (Points b and c). This process ultimately leads to the fundamental failure of the specimen's load-bearing capacity. During subsequent displacement loading, the reliance on interface friction causes the accumulation of cracks at the lower right end of the coal rock, culminating in the sliding failure of the specimen. The coherence between the crack propagation process in the simulated test of the fractured coal-rock composite model and experimental tests is evident from this observation and Figure 6.

Characteristics of crack evolution under compression-shear loading.
Figure 13 shows displacement in the X-direction and average displacement cloud maps under various loads (points a, b, c, and d). In Figure 13(a), the upper part of the specimen moves to the left, while the lower moves to the right, resulting in a gradual change in the X-direction displacement of the specimen along the inclined plane. As depicted in Figure 13(b), beginning from point b, the displacement in the vicinity of the lower part of the specimen, near the crack, is notably higher than at other positions. Simultaneously, the displacement at the interface approaches zero, and the average displacement on both sides is approximately equal. At point a, under the influence of a linear displacement load, the interface displacement of the specimen uniformly varies, and the displacement outside the interface specimen is continuously distributed. At points b and c, a new displacement interface emerges in the lower part of the composite, with markedly higher displacement on the right side of the lower specimen than on the left. Therefore, the lower part of the specimen fails along the lower tip of the pre-existing fracture, revealing a substantial gradient in X-direction displacement at both ends of the crack. This gradient signifies the emergence of tensile cracks, aligning with the crack evolution results mentioned earlier. At the same time, the swift alteration in displacement linked to crack generation corresponds with the localized DIC strain findings illustrated in Figure 7.

X-direction displacement and average displacement of the specimen under compression-shear loading. (a) Cloud map of X-direction displacement, (b) Cloud map of average displacement.
The mechanical mechanism of crack propagation
Nonlinear method for calculating stress intensity factor
The displacement field equation near the crack tip is as follows
42
: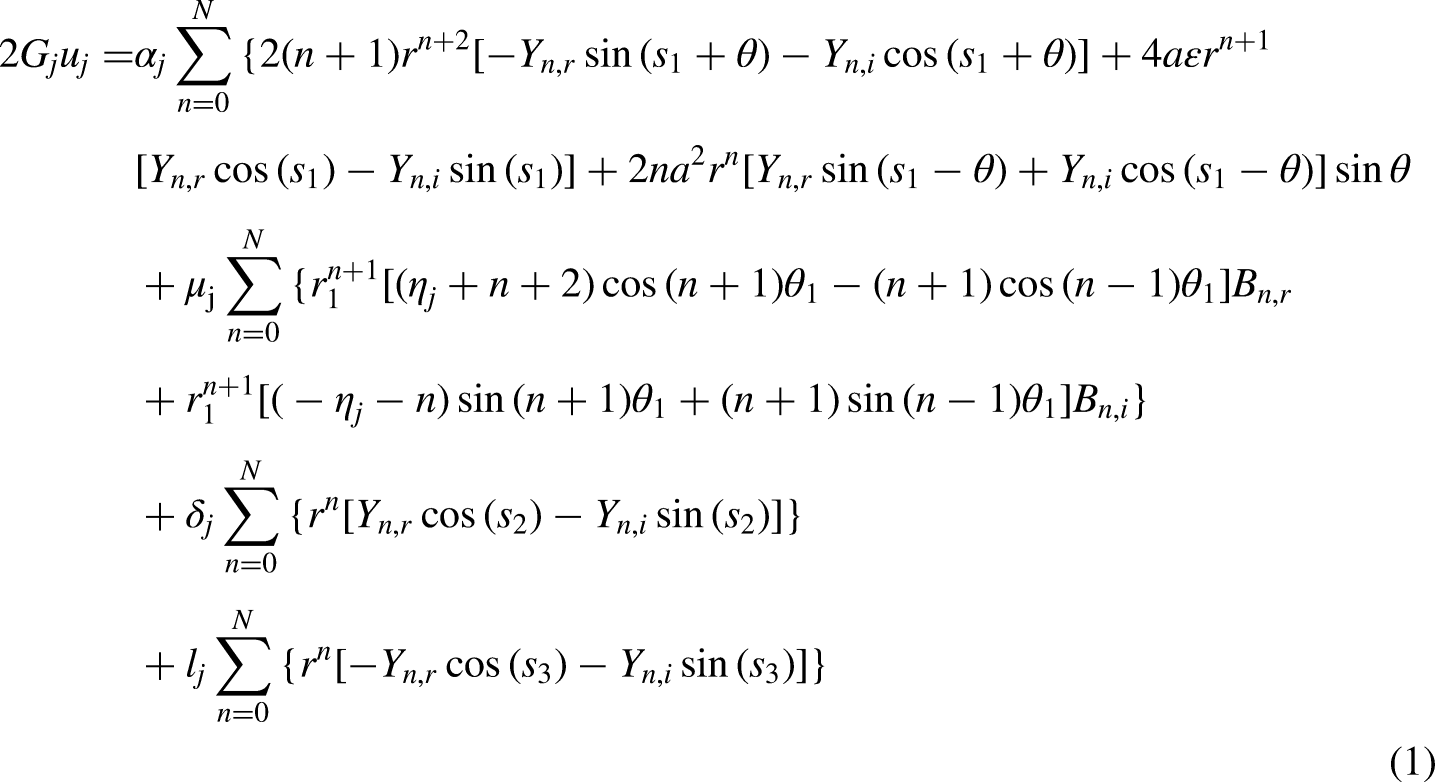

The interface crack is I-II composite crack, the displacement direction and crack propagation direction in the crack tip area cannot be determined in advance. Therefore, the displacement components in polar coordinates are used to solve the displacement field equations in this paper. The local coordinate system is established with the crack upper tip as the origin, the crack propagation direction as the x-axis, and the vertical crack propagation direction as the y-axis of local coordinates. The geometric parameters of the specimen under polar coordinates are shown in Figure 14.

The locations of observation points.
The polar coordinate system as shown in Figure 14 is used to solve the nonlinear equation, the displacement field formula (1) and (2) can also be expressed as:


Selected points in the crack tip region of the displacement map (mm).
The displacement components measured by the digital image correlation method are substituted into the displacement field equations of the crack tip area, and solved by the nonlinear method to obtain the load time curve, KI time curve, and KII time curve, as shown in Figure 16.

The stress intensity factor–time curve. (
At the initial stage of loading, the KI and KII at the crack tip do not increase with the load. At 100 s, Figure 17(a) shows the displacement field of the specimen surface along the Y direction. At the time, there is no localization phenomenon in the displacement field at this time. The KI at the lower tip of the pre-existing crack increases nonlinearly from 168.8 s to 264.1 s. The KI at the upper tip increases nonlinearly from 191.9 to 330.1 s. The corresponding KII also increases nonlinearly within the time range. The stress intensity factors of the upper and lower tips do not enter the stage of nonlinear growth at the same time, while the stress intensity factors of the lower tip entered the stage of stable propagation earlier, indicating that the resistance to be overcome by the two tips is different.

Contour maps of y direction displacement at different times. (
Figure 17(b) is the displacement field along the Y direction of the test piece at 180 s. The displacement component near the lower tip in the figure is symmetrically distributed along the crack growth direction. The results show that there is deformation localization near the lower tip of the pre-crack at the moment of loading, and the crack shows a tensile crack growth trend, while there is no deformation localization at the upper tip.
Figure 17(c) is the displacement field along the Y direction of the test piece at 240 s. At this stage, the crack does not propagate obviously. While the stress and deformation in the crack tip area began to develop locally, indicating that microcracks appeared in the crack tip area, which is the nucleation stage of rock fracture. It can be seen that the initiation and propagation stages of rock coal-like material interface cracks can be effectively determined by analyzing the variation characteristics of stress intensity factors with time.
Criteria for the initiation of interfacial cracks
For the I-II composite crack in a single material model, the crack initiation direction can be solved by the maximum annular tensile stress criterion. However, for the interface crack, since the interface is a weak layer with poor shear resistance, the direction of maximum annular tensile stress is not necessarily the direction of crack initiation, so it is necessary to judge whether the shear stress or the maximum annular tensile stress reaches the material strength first.
The stress field (Xu 2006) near the tip of the interface crack can be expressed as:
Calculate the stress intensity factor of crack initiation through Figure 18. When it is loaded to 264.1 s, the lower tip of the pre-existing crack starts to initiate. It can be calculated that the lower tip KI and KII are 1.005 MPa·m1/2, and 1.810 MPa·m1/2, respectively. When it is loaded to 330.5 s, the upper tip of the pre-existing crack starts to initiate. It can be calculated that the upper tip KI and KII are 1.313 MPa·m1/2, and 1.795 MPa·m1/2, respectively. Substituting the stress intensity factor at the moment of the initiation of the upper and lower tips into Equation (6), the distribution of circumferential stress and shear stress of the crack tip can be obtained under uniaxial compression, 0° represents the interface direction and the interval is between −180° and 180°, as is shown in Figure 18.

Stress distribution of the interface crack tip. (
It can be seen from Figure 16(a) that both the maximum shear stress and the maximum circumferential tensile stress of the lower tip of the pre-existing crack are in the coal-like material areas. The tensile strength of coal-like material is lower than that of shear strength, therefore, the lower tip of pre-existing crack is dominated by tensile stress, which demonstrates that the lower tip crack initiation is controlled by tensile stress theoretically and the maximum circumferential stress criterion should be used for crack initiation analysis. As a result, in the experiment, an airfoil crack perpendicular to the interface which is extended from the lower tip end to the coal-like material side is formed, as shown in Figure 6(d).
The circumferential stress and shear stress of the upper tip of the pre-existing crack are shown in Figure 16(b). The shear stress near the interface is the leading area, the maximum position of the shear stress is near the interface, and the maximum value of the annular tensile stress is on the rock side. Since the shear capacity of the interface is less than the tensile strength of the rock, the shear stress at the interface reaches its limit first. Therefore, a crack with the upper tip as the starting point propagates along the interface direction, as shown in Figure 6(e).
Discussion
The paper thoroughly examines the influence of coal-rock interfaces and cracks on the fracture behavior of coal-rock composites. The study demonstrates that, due to the presence of cracks, specimens, under external loads, extend from the tip of the prefabricated crack towards the side with lower material strength, resulting in the formation of wing-shaped cracks. 43 However, as the coal-rock interface functions as a weak plane, the ultimate failure of the composite occurs along the interface under shear stress. Previous literature44,45 has investigated the interface effects of coal-rock composites, suggesting that when the interface aligns at a 90-degree angle to external loads, specimen failure predominantly takes place near the interface. The coal part mainly experiences tensile failure, and the coal section becomes more fragmented than the sandstone part. This observation further substantiates the idea that the interface in the coal-rock composite serves as a weak plane, rendering the composite more susceptible to failure along the interface, in line with the findings of this study. In earlier studies, researchers examined the impact of cracks on specimen failure. When the crack is situated at a 60-degree angle to external loads, influenced by circumferential stress, the specimen initiates extension from the crack tip, resulting in the formation of wing-shaped cracks. This phenomenon closely mirrors the wing-shaped crack formation observed in the coal-like material part of our study. However, these earlier studies did not concurrently consider the effects of interfaces and interface cracks on specimen failure, underscoring the innovative nature of our approach. Nevertheless, this study has its limitations; for instance, it solely examines one angle of the interface, whereas actual engineering sites may feature multiple angles for coal-rock interfaces. Therefore, future research should consider varying interface angles, serving as a focal point for our subsequent studies.
Conclusion
The process of inclined crack propagation at the interface in a combined body specimen of coal-like material and rock was monitored using digital image correlation. The obtained surface displacement field revealed the evolutionary pattern of micro-crack propagation during the deformation and fracture process of the specimens. This valuable information provides insight into the failure process of combined body specimens made of coal-like material and rock. The specific conclusions are as follows:
The specimen propagates from the lower tip of the crack towards the side of the coal-like material, with the propagation direction generally perpendicular to the interface direction. Subsequently, the upper tip of the prefabricated crack extends along the interface, and the specimen ultimately fractures at the interface. The evolution of coal-like material and rock-combined body fracture can be categorized into the crack compaction stage, crack nucleation stage, crack propagation stage, and specimen rupture stage, with the crack nucleation stage acting as a precursor to specimen rupture. The lower crack tip entered the crack nucleation stage at 168 s, while the upper tip entered the crack nucleation stage at 192 s. The numerical simulation results reveal that the failure mechanism commences with the bonding failure of the smooth joint at the interface, leading to cracks along the interface. Following this, the cracks extend approximately vertically from the lower tip of the pre-existing fractures, permeating through the bottom of the specimen and resulting in the loss of its load-bearing capacity. Eventually, influenced by interface friction, the load increases again up to the friction limit, ultimately causing sliding failure of the specimen. According to the fracture theory analysis, the initiation of two tips is suitable for different fracture criteria. The lower tip is dominated by the maximum circumferential tensile stress and the upper tip is dominated by shear stress.
Footnotes
Declaration of conflicting interests
The author(s) declared no potential conflicts of interest with respect to the research, authorship, and/or publication of this article.
Funding
The author(s) disclosed receipt of the following financial support for the research, authorship, and/or publication of this article: This work was supported by the Major Science and Technology Project of China National Coal Group Corp., The Key Research Program of China Coal Science and Industry Group, The National Key Research and Development Program of China, (grant number 20211by001, 2020-2-Zd001, 2018yfc0808402).
Author biographies
Xiaopeng Li is pursuing a doctoral degree at the Chinese Institute of Coal Science, majoring in Mining Engineering. His research focus is on the prevention and control of dynamic disasters in mines.
Xiangshang Li is an Associate Researcher at the Chinese Institute of Coal Science, holding a doctoral degree. His research focus is on engineering mechanics.
Honghui Yuan is pursuing a doctoral degree at the China University of Mining and Technology (Beijing), majoring in Safety Engineering. His research focus is on the prevention and control of dynamic ground pressure.
Haitao Li is a Researcher at the Chinese Institute of Coal Science, holding a doctoral degree. His research focus is on digital rock mechanics.
Guanyu Yang is an Associate Researcher at the Chinese Institute of Coal Science, holding a doctoral degree. His research focus is on digital rock mechanics.
Shuwen Wang is the Director of the Major Science and Technology Special Project Department at China National Coal Group Corp, holding a doctoral degree. His research focus is on the prevention and control of dynamic ground pressure.
Guoli Ding and Shijie Su are the technical leaders at Zhongtian Hechuang Energy Co, and their research focus is on the prevention and control of dynamic ground pressure.