
Abstract
In this article, a method of information exchange system (MIES) has been proposed to optimize the structure of the hinge sleeve of cubic (HSC), a key component of synthetic diamond. The MIES method integrates static analysis, topology optimization, and fatigue failure analysis. By using this method, the lightweight design of the structure was ensured while meeting the fatigue life requirements. The weight of the optimized model was reduced from 5729.9 kg to 4593.4 kg, and the fatigue life was 1.127E+05, which meets the serviceability requirements. The steps of the method are as follows: First, the model of HSC was established. According to the loading conditions, the basic material data and boundary conditions were set, and the stresses and strains of the HSC were calculated. The optimized region was obtained by topological analysis of the HSC structure using the variable density method. The fatigue life of the model was then calculated by combining the stress life method and the average stress correction method. Simulations were performed using the above method to obtain the six nodes of maximum stress in the HSC. These nodes were used as control points for the structural optimization design. The HSC model was optimized by optimizing the structure in the region of the control variable points. Computational analysis of the optimized HSC model was carried out using the information exchange system. After repeated optimization of the structure of the HSC model, a model with a lightweight design was obtained. The ANSYS simulation results showed that the final mass of the HSC model was reduced by 19.83%. Stress and life were within the design requirements. The information exchange system has better computational performance, feasibility, and reliability compared to traditional theoretical methods.
Keywords
Introduction
Diamond is renowned for its exceptional hardness and outstanding stability, and it finds extensive applications in various fields, including aerospace, manufacturing, and the military sector.1–3 However, natural diamonds found in nature are in short supply and come at a high cost, 4 which has prompted experts to develop synthetic diamond production equipment. As an essential component of man-made diamond equipment, the hinge sleeve of cubic (HSC) is prone to fatigue failure at the stress concentration point after prolonged operation, resulting in HSC breakage. In addition, due to its large size, the HSC is expensive to manufacture and difficult to maintain. Therefore, it is imperative that weight reduction measures are taken to improve its performance.
Sun et al.5,6 conducted a study on the failure of HSC under high pressure. Load calculations showed that the maximum stress points were mainly at the bottom of the cylinder block. Then, Sun et al. 7 performed strength calculations and fatigue analysis through cyclic loading, discovering that the HSC was prone to fatigue failure. Wang et al. 8 analyzed the characteristics and stresses of HSC and optimized the design of the main structural dimensions. Although the HSC structure was optimized to reduce weight through Wang's study, the fatigue life of the optimized HSC model was not considered. In China, experts do not typically combine stress and fatigue when optimizing HSC structures.
In the field of structural design, many scholars and experts use the finite element method to optimize the design. Chan et al. 9 used the finite element method for the analysis and optimization of machine tool structures. Zhao et al. 10 employed static analysis within the finite element method to explore lightweight design for the gantry of a machining center. Yao et al. 11 used static analysis to determine the maximum stress that the structure can withstand. Joshi et al. 12 and Korsmik et al. 13 have used topology optimization to improve structure, resulting in a weight reduction while maintaining strength conditions. Meanwhile, in various fields of mechanical engineering, experts employ the finite element method to optimize the dimensions of mechanical structures in order to reduce weight.14–16 After the structural optimization was completed, many experts17,18 performed fatigue calculations on the structure to verify the reliability of the optimized structure. Some other scholars have modified and optimized the life calculation method in fatigue life analysis in order to obtain more accurate life data. Li et al. 19 proposed a robust optimization model of structural fatigue life based on the stochastic finite element method. Phusakulkajorn et al. 20 considered the average stress correction method and stress combination for fatigue analysis of aluminum alloy wheels under radial load. Nabaki et al. 21 and Jonsson et al. 22 considered the fatigue failure to optimize the topology of the continuum structure. Yıldız et al. 23 used the salp swarm algorithm to optimize the shape of seat brackets, taking mass as the objective function and stress as the constraint. Yıldız et al. 24 used a new salp swarm algorithm to optimize the design of electric vehicle components, ultimately reducing weight by 2056 g. In the context of the above-mentioned research, it can be observed that in mechanical structural design, the majority of researchers utilize the finite element method for analyzing and validating mechanical structural designs.25–27 This provides an idea for the structural study of HSC. After studying the methods used by experts to optimize component structures, a structural optimization scheme is proposed that combines static analysis, topology optimization, and fatigue analysis. This scheme can comprehensively study the structural optimization of HSC. The failure scheme of the HSC bushing in the workshop under high pressure load is shown in Figure 1.

Diagram of failure of the HSC under high pressure load in the workshop.
Description of the study model of HSC
The object of this study is a key component of synthetic diamond equipment, namely the HSC device. The synthetic diamond equipment consists of six identical HSCs. In order to simplify the complexity of the simulation calculation, a single HSC model has been selected for the study. The initial structural weight of the HSC is 5729.9 kg, the Cylinder wall thicnkness159 mm, the ear ribs thickness160 mm, bottom thicnkness265 mm. The initial model does not set the bottom rib thickness. The tapped holes, and chamfers on the outer wall of the HSC were ignored when building the HSC model, as they could not be used as a guide for subsequent structural optimization. The model structure is shown in Figure 2.

Structure of the model.
Solution for HSC structural fracture
To prevent the occurrence of fracture, it is possible to enhance the structural strength of the critical areas to ensure the absence of accidents during operation. In this study, a mechanical design method was employed to optimize the design by improving the shape, process engineering, and quality, among other aspects, to reduce the stress levels caused by workloads and thus increase the structural fatigue life.
Fatigue failure study of HSC
The fatigue model of HSC is the S-N curve, which shows the relationship between stress amplitude and cycle life. This model was invented by German engineer August Wöhler in the 1870s. The S-N curve is based on experimental data between stress amplitude and number of cycles. It shows how many cycles a component can withstand at different stress levels without experiencing fatigue damage. By comparing actual stress data with the S-N curve, the life of mechanical components in practical use can be predicted. Due to the high pressure, the HSC structure is susceptible to fracture. To address this issue, the following steps were taken for research purposes: A virtual fatigue test model of the HSC was established, and the fatigue strength of its components was analyzed using the equivalent stress–strain method. Based on this, the effect of stress distribution on the failure point area was further studied. By analyzing the reasons and locations of stress concentration, the structure of the HSC can be optimized. The fatigue testing process of the model is shown in Figure 3.
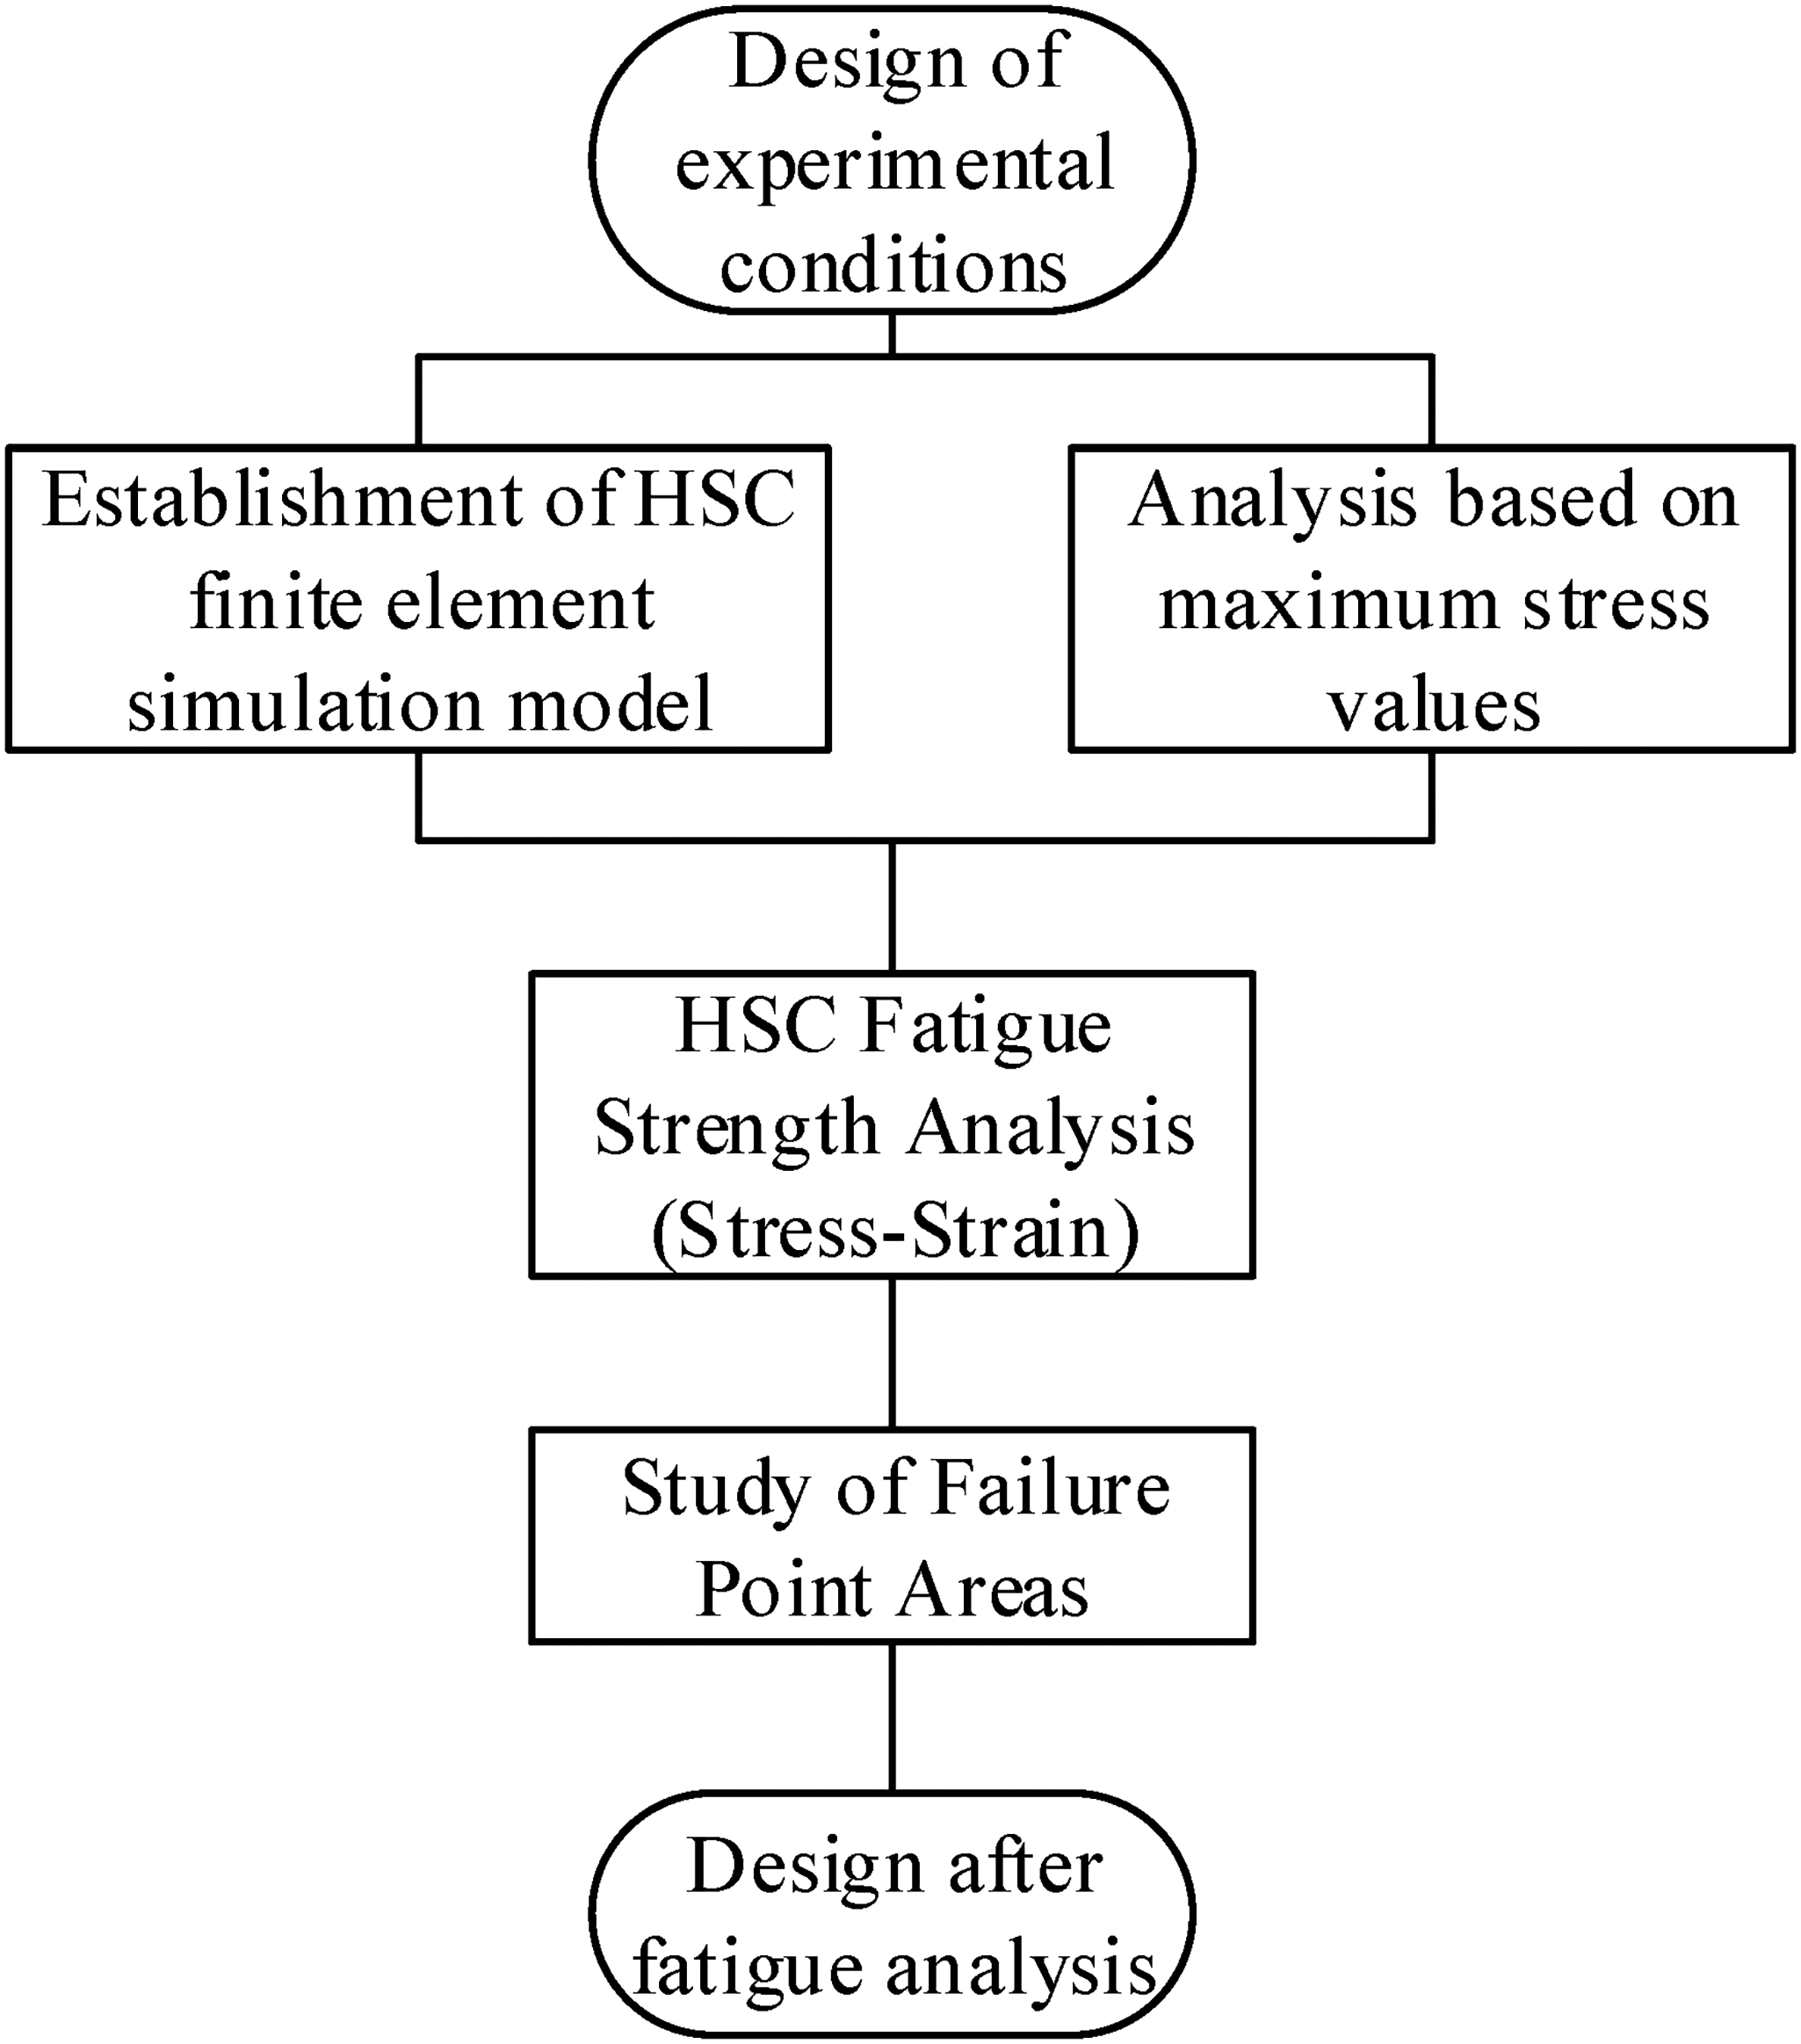
The fatigue testing process of the model.
Theoretical study on the information exchange system of HSC
The fatigue life theory of the HSC
For the fatigue life analysis of mechanical parts, there are three main multiaxial fatigue life prediction models, which are maximum shear strain (MSS), Brown–Miller (BM), Smith–Watson–Topper (SWT) model. Based on previous experience in structural fatigue analysis, the fatigue life model used in this study is the Morrow equation.
28
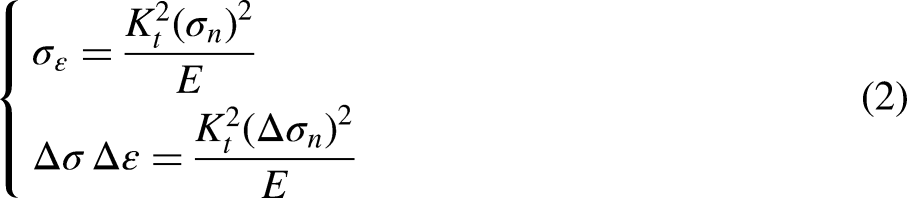
This model evolved from the Manson–Coffin equation29,30 with the addition of average stress and can describe the fatigue life well. The expression of Morrow equation is as follows:

The Morrow equation was used to describe the mathematical relationship between the fatigue life and the total strain amplitude of the HSC structure. Here, the total strain amplitude is defined as the amplitude of plastic strain plus elastic strain. For fatigue life analysis of HSC structures, this paper adopts an elastic-based finite element analysis approach to obtain the total stress amplitude based on the Neuber equation.

Load conditions for fatigue analysis
The static life solution for the HSC structure involves a static analysis based on FEM. By applying a load to the structure, the static stress or strain state is converted to a cyclic stress or strain time node to calculate the life result. At this stage, a half-cycle function is used to simulate the cyclic loading conditions. This function is obtained by multiplying the stress and strain results of the static results by the function shown in Figure 4. In addition, cyclic stress or cyclic strain refers to the stress or strain state that the component is subjected to under cyclic loading conditions.

Fatigue cyclic loading condition.
Theoretical basis of the topology optimization design method
The material interpolation model, solid isotropic material penalization (SIMP), is often used in the variable density method for continuum topology optimization. The variable density method is used to optimize the HSC structure in the topology optimization. The relationship between the material modulus of i and the introduced


The formula: t is the number of finite element elements in optimization region
Information exchange system
Static analysis, topology optimization, and fatigue analysis data have not been combined in previous HSC structural designs. While the stiffness and stresses of the HSC can be determined by static analysis, long-term cyclic loading cannot be evaluated by static analysis. Topology optimization can improve the distribution of materials and the shape of the structure, but it cannot be used to analyze the lifetime of the structure. Fatigue analysis can evaluate the life of a structure but cannot optimize its shape or material distribution. In this research, static analysis was employed to determine the stress distribution of the HSC under different loading conditions, and the results were inputted into the topology module for iterative calculations. Based on the topology results, the optimization region of the HSC structure was identified, and fatigue life calculations were performed using static analysis. The above computational results have been used to establish an information exchange system that integrates static analysis, topology optimization, and fatigue analysis to optimize the design of the HSC. The schematic diagram of the information exchange system is illustrated in Figure 5.

The schematic diagram of the information exchange system.
The model of HSC optimization design
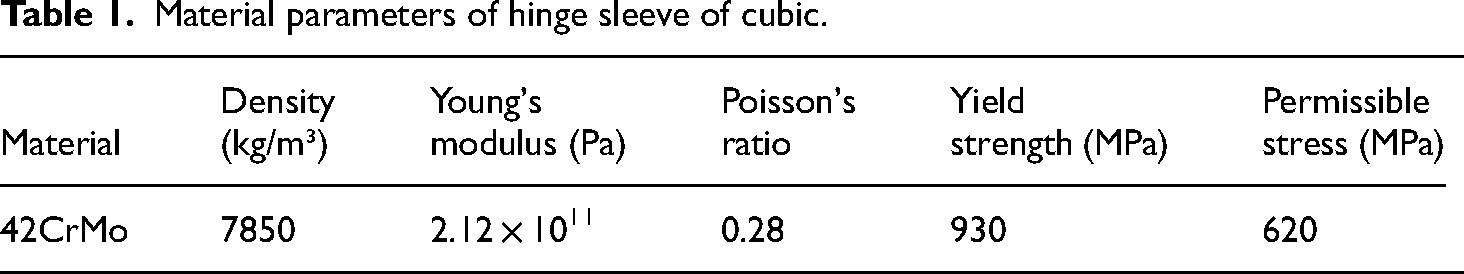
When applying loads to the HSC, it was divided into two main regions: the pressure on the bottom of the HSC cavity and the pressure on the arc region where the bottom contacts the inner wall. In the simulation calculation, the ear was set as a fixed constraint, and the pressure (90 MPa) under the working condition was applied to the surface of the HSC bottom and the arc region for simulation calculation. As shown in Figure 6, the red part of the figure is the region where pressure is applied and the blue color is the fixed constraint region. A three-dimensional model of HSC was created and imported into ANSYS for stress analysis. The material of the HSC is selected as 42CrMo, and the mechanical properties of this material, as shown in Table 1.

Boundary conditions.
Material parameters of hinge sleeve of cubic.
In order to obtain more accurate results when the working ears and bottom of the HSC are subjected to high loads, mesh refinement was set for the bottom and ears of the HSC. The meshing of the HSC is mainly refined using the tetrahedron-dominated meshing method (tetrahedrons), with the element size set to 3 mm, the mesh quality defined as high, and the mesh size at the rounded corners set to 1 mm. This approach resulted in a well-constrained mesh model with a total of 316100 mesh elements and 469187 element nodes, as shown in Figure 7.
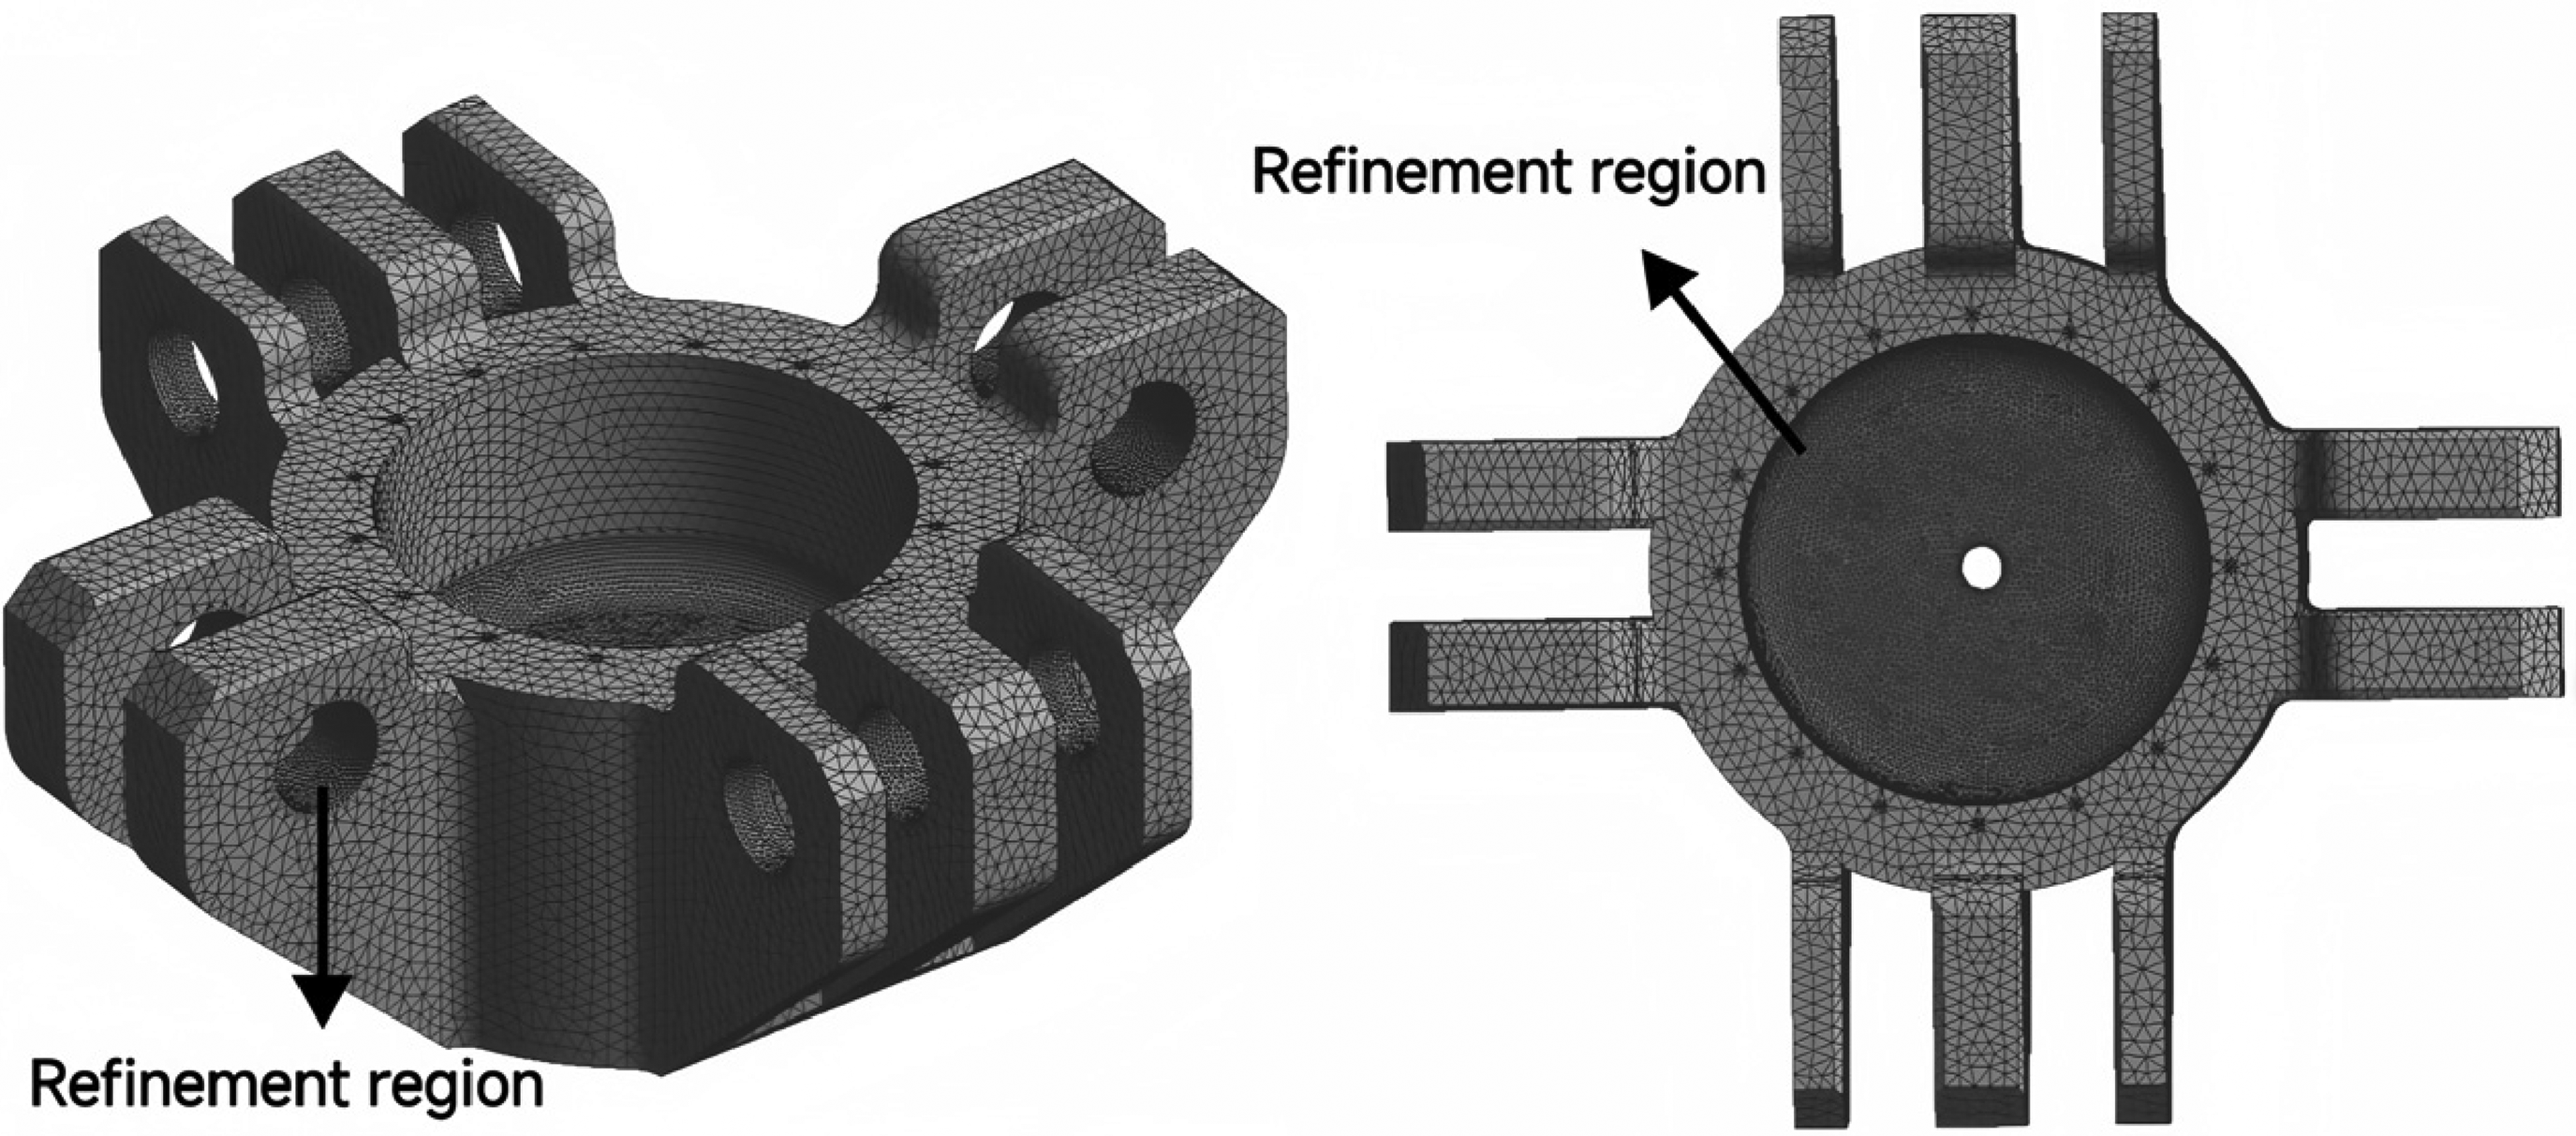
The mesh model of the HSC.
Topology results of the HSC
After determining the required working load of the HSC, the model is optimized for using the variable density method. The structure is optimized by handling materials with different densities distributed in the HSC. The structural morphology is controlled according to the retained threshold. The article obtains the optimized region of HSC according to topology optimization, and the model is optimized and designed in combination with the information exchange system. The model diagram for HSC topology calculation is shown in Figure 8.

The model diagram for HSC topology optimization (in the figure, the top is the topology result with 90% mass retention, the left 1 is the topology result with 85% mass retention, and the left 2 is the topology result with 50% mass retention).
According to the results from Figure 8, some important points can be obtained as follows:
The weight can be moderately reduced while ensuring the strength of the HSC. According to the results of ANSYS calculations with different thresholds, the HSC bottom dimensions, ear area, and overall thickness can be designed optimally. Analysis of the optimization results for three different topological structures indicates that the structure of HSC is not easily optimized at locations of maximum stress, but optimization can be performed at locations of low stress.
Design analysis of the HSC experimental model
HSC initial model analysis
The initial HSC model is imported into the ANSYS software, and the stress is analyzed. Combined with the static calculation results of the initial model, the maximum stress node is used as the control variable point. Then the structural parameters at the maximum stress location are optimized. The stresses of the initial model are shown in Table 2, and the locations of the control variable points are shown in Figure 9.
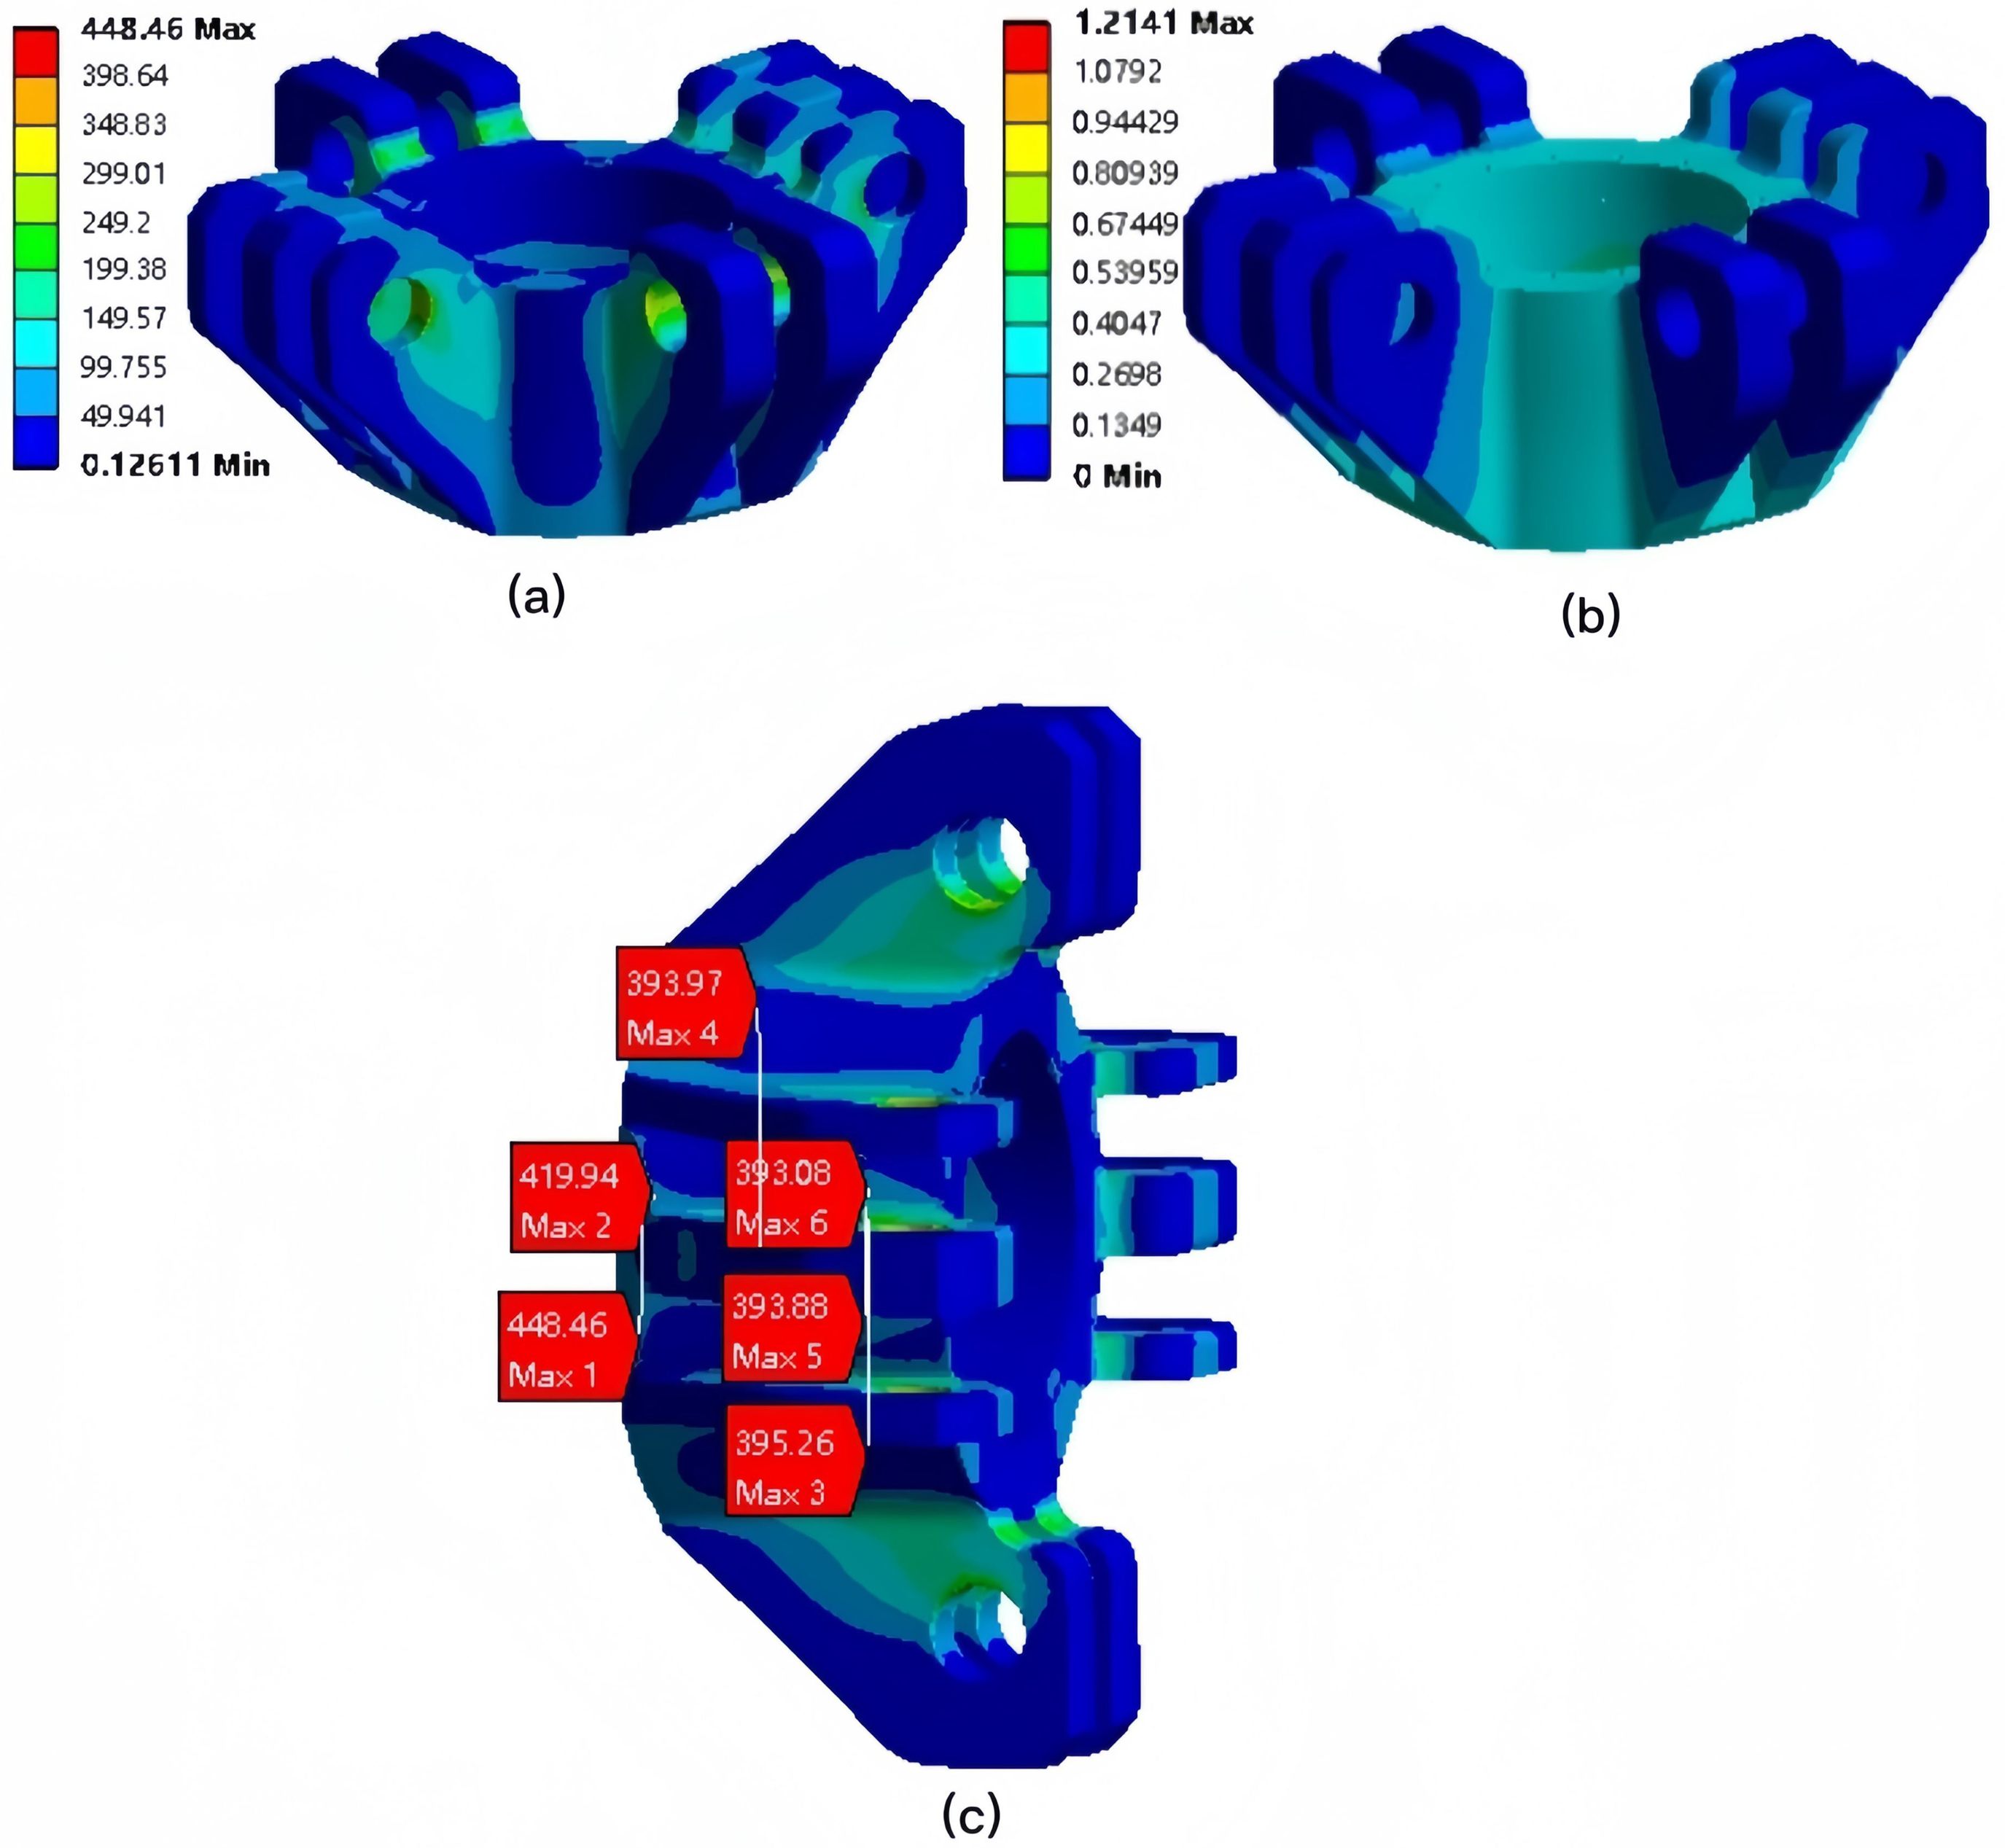
Initial model simulation calculation results (a: stress, b: deformation, and c: control variable point location).
Stress of the control variable point (MPa, mm).

Description of the HSC model optimization method
According to the calculation results based on SIMP, there is a significant optimization space for the initial structure of HSC when the retained mass is 90%, 80%, or 50%, respectively. At the same time, based on the maximum control variable point parameters, small parameter adjustments should be made in areas with higher stress values, while large parameter adjustments should be made in areas with lower stress values to achieve optimal structural design. In order to restructure the structure, the bottom, cylinder wall, and ear positions can be designated as the design areas. Within the design area, the thicknesses of the bottom (w1, w2), cylinder wall (w3), and ear locations (w4) can be used as design variables for iterative calculations of the structure. To evaluate the design scheme, the total mass (M), maximum stress (S), and minimum fatigue life (N) can be used as testing standards. Specifically, according to the processing cost and material strength provided by the manufacturer, the design variables can be represented in Table 3. Within the range of design variable values, iterative calculations of structural parameters can be performed, ignoring other influencing factors, to optimize the structure of HSC and search for the optimal solution of structural parameters.
Design variables.

The objective function and optimal design of HSC structure
Establish a mathematical model for the optimization of HSC, where the design variables can be expressed as the following equation:


In order to obtain suitable structural parameters, iterative calculations were performed using optimization software within the constraints of the design variables. The optimal combination of parameters was found through global optimization and several calculation results were obtained. Various factors such as design requirements, material properties and cost are then considered to evaluate the pros and cons of these results and comparative analysis is performed to select the best design solution.
Initial model optimization design
The analysis carried out in ANSYS shows that the initial model of the HSC meets the stiffness and strength requirements. However, its overall volume and mass are not in the best condition, which does not comply with the principle of lightweight design. To reduce the mass of the HSC, it is necessary to optimize its initial structure while ensuring its service life. In addition to meeting the stiffness and strength requirements under static conditions, it is essential to ensure that the fatigue life of the HSC during operation is not less than 1.10E+05.
The 3D model of the HSC is modified by combining the topology optimization region with the six maximum control variable point locations of the initial model stress. The three-dimensional model of the HSC is designed within the range of design variables. The optimized model is referred to as the experimental group A model. Then model A is calculated and analyzed. The situation is shown in Figure 10. The stresses and lifetimes of the control points for model A are shown in Table 4. The location of the minimum fatigue life for model A is shown in Figure 11. The location of the nodes is shown in Figure 12.
Static analysis of model A (a: model A, b: stress, c: deformation, and d: life).

The location of the minimum fatigue life for model A.

Location of nodes.
The stresses and lifetimes of the control points for model A (MPa, time).

According to the above calculation results, after optimization, the quality of model A is reduced by 8.96%. The maximum stress of model A is 548.98 MPa, and the maximum deformation is 1.20 mm. The allowable stress of the material is 620 MPa. The stresses in model A are much less than the allowable stresses in the material and fully satisfy the engineering applications.
In terms of fatigue analysis, the minimum life of the failure point of model A is 1.09E+05 at the 3412-node position. The fatigue life of model A can reach up to 1E7, and the lowest is 1.096E+05. The stresses and lifetimes of the control variable points for model A are shown in Table 3.
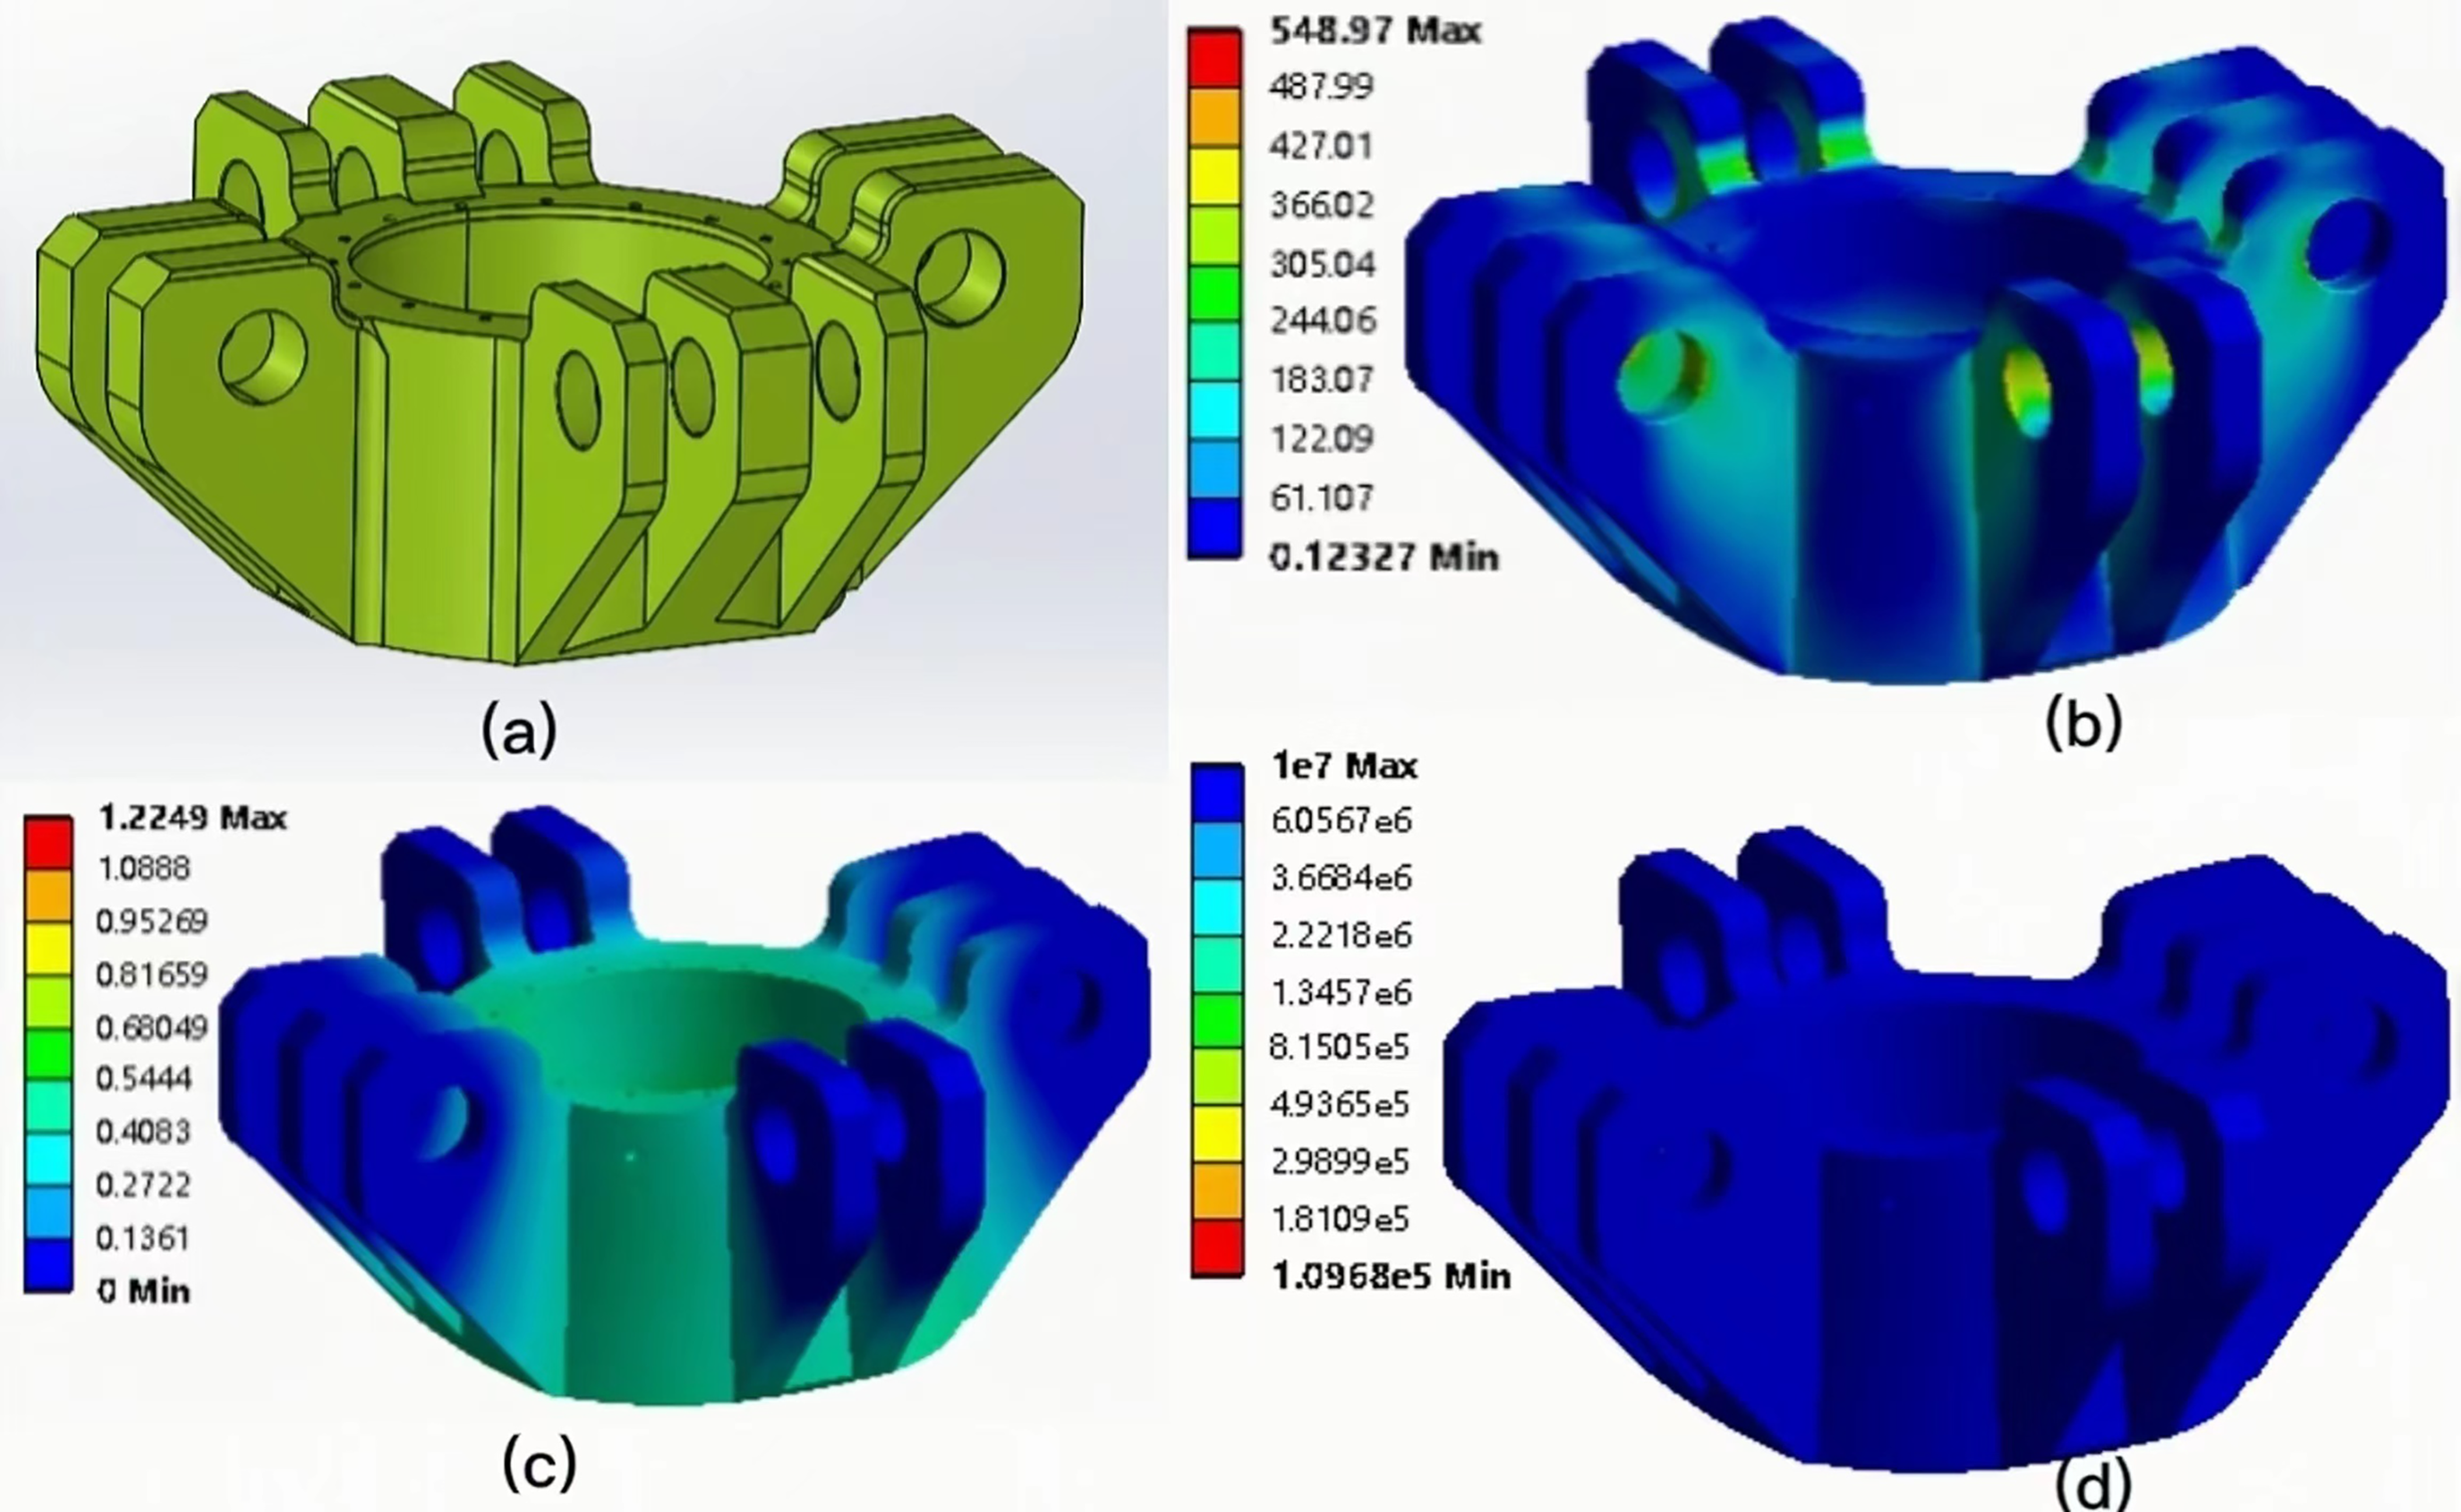
In model A, the maximum node in six directions is used as the control variable point, and the parameters of the maximum position are optimized several times to obtain model B. The simulation calculation results of the group B model are shown in Figure 13. The stresses and lifetimes of the control variable points for model B are shown in Table 5. The stresses and lifetimes of models A and B are shown in Figure 14. The location of the nodes is shown in Figure 15.

The simulation calculation results of model B (a: model B, b: stress, c: deformation, and d: life).

The stresses and lifetimes of models A and B.

Location of nodes.
The stresses and lifetimes of the control variable points for model B (MPa, time).

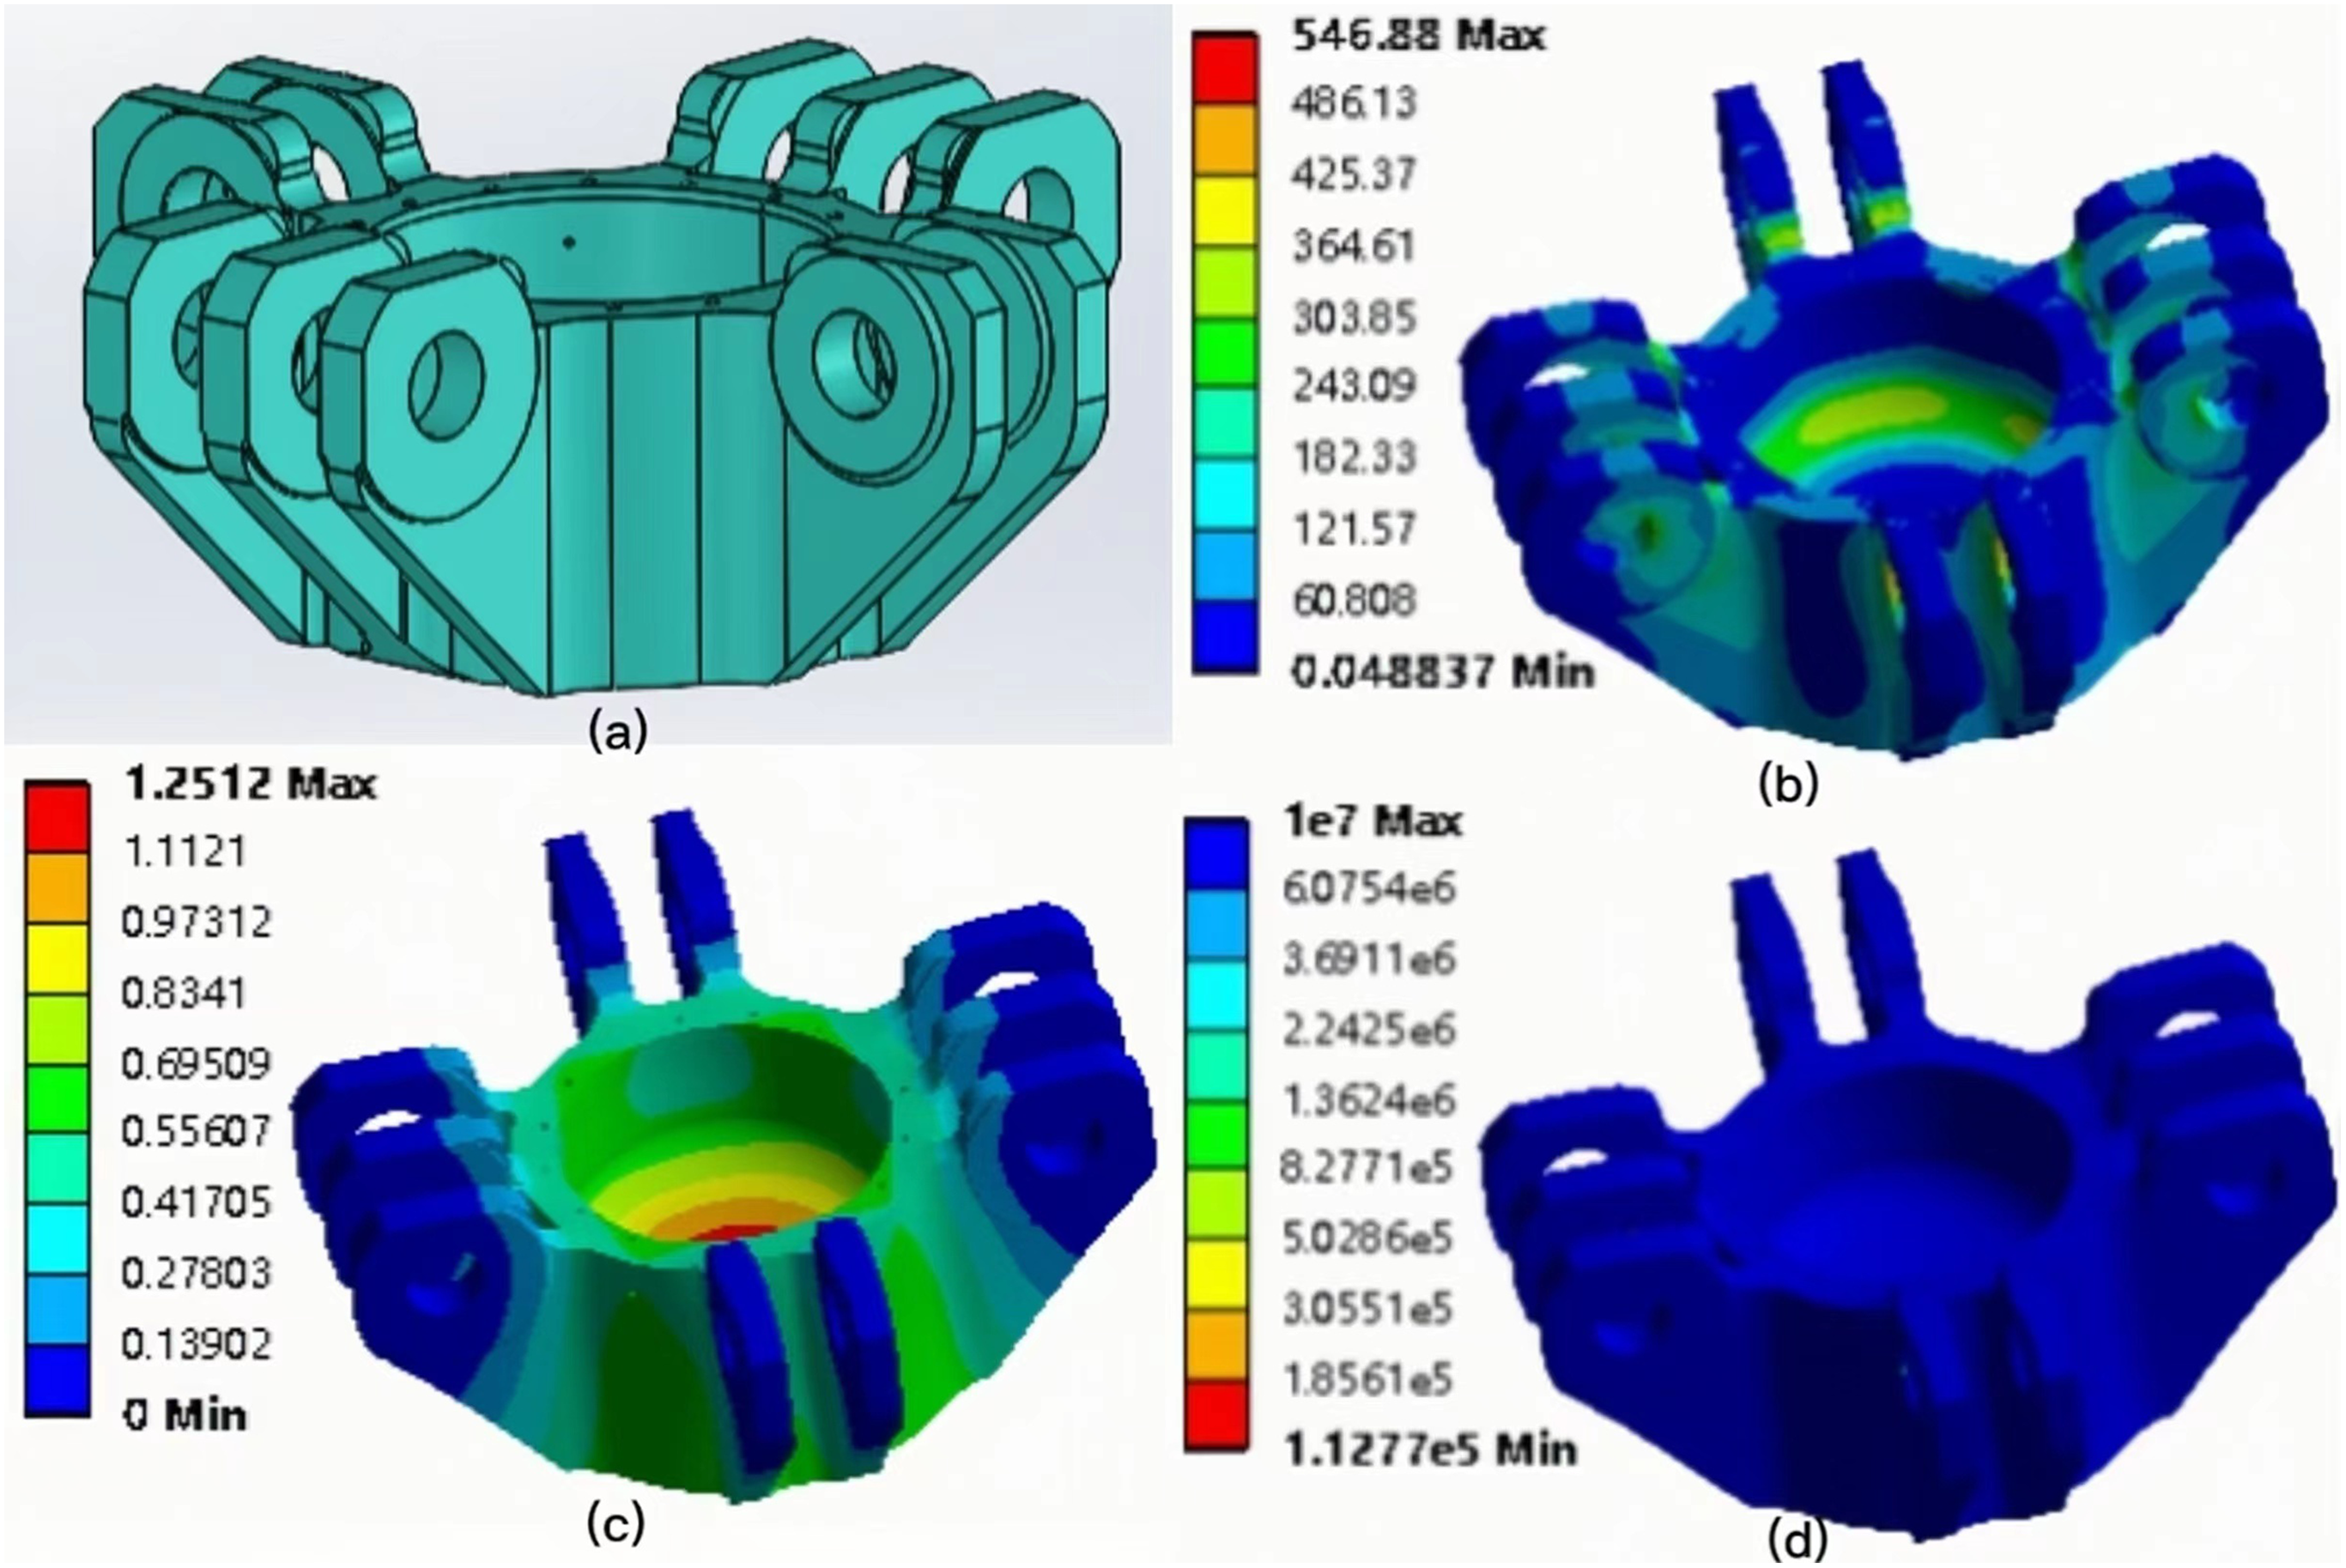
Model B of the experimental group is obtained by modifying the parameters of the control variable point region based on model A. The stress concentration phenomenon did not increase in the optimized area of model B during operation, so the maximum stress of model B was kept at the same magnitude as that of model A. From the comparison in Figure 9, it is evident that although the weight of model B is lighter than that of model A, the fatigue life at the lowest point is almost unchanged, and the goal of lightweight design is achieved. To obtain a lighter-weight HSC model, the calculated data of Model B was investigated. It was found that the fatigue failure point of model B occurred at node 554 with a minimum life of 1.05E+05, and the size of the 554 node area could not be reduced in the next optimization step. However, at the six control variable points, the stresses in other regions can continue to be optimized. The experimental group model C is obtained after combining the experimental data to modify the structure of model B. The simulation calculation results for the group C model are shown in Figure 16. The stresses and lifetimes of the control variable points are shown in Table 6. Model B, and C stress and fatigue life trends are shown in Figure 17. The location of the nodes is shown in Figure 18.
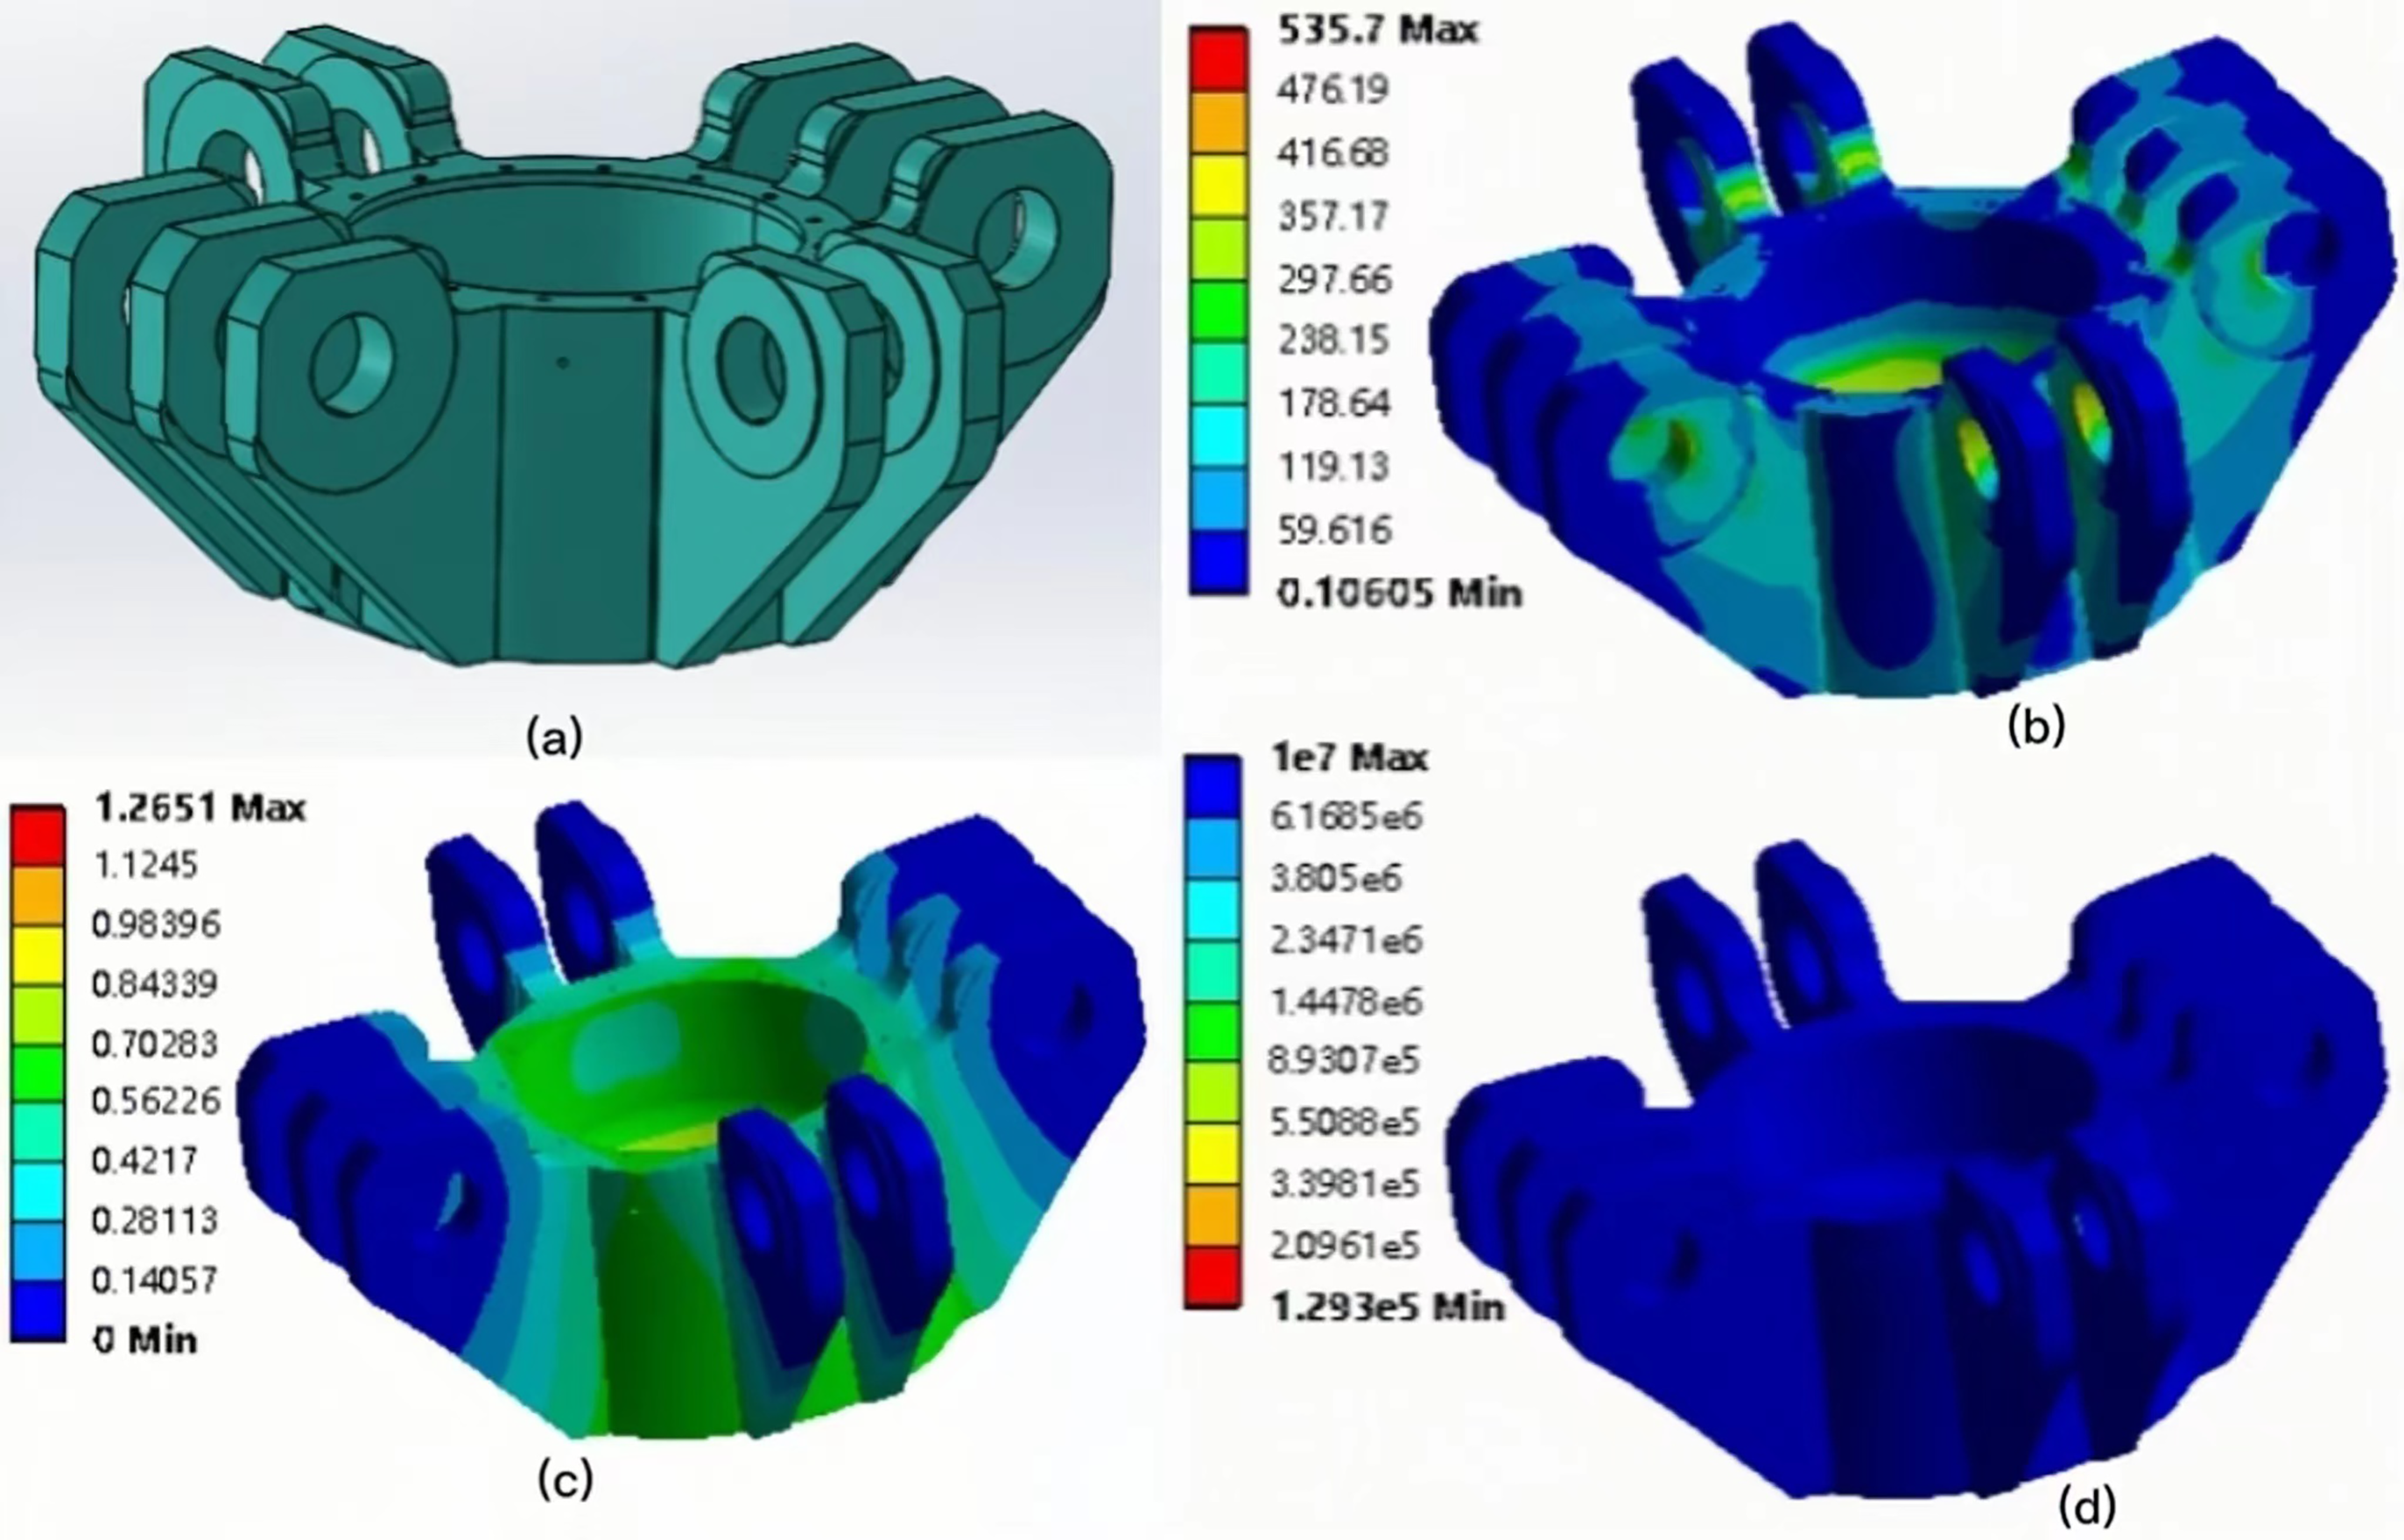
The simulation calculation results of the model C (a: model C, b: stress, c: deformation, and d: life).
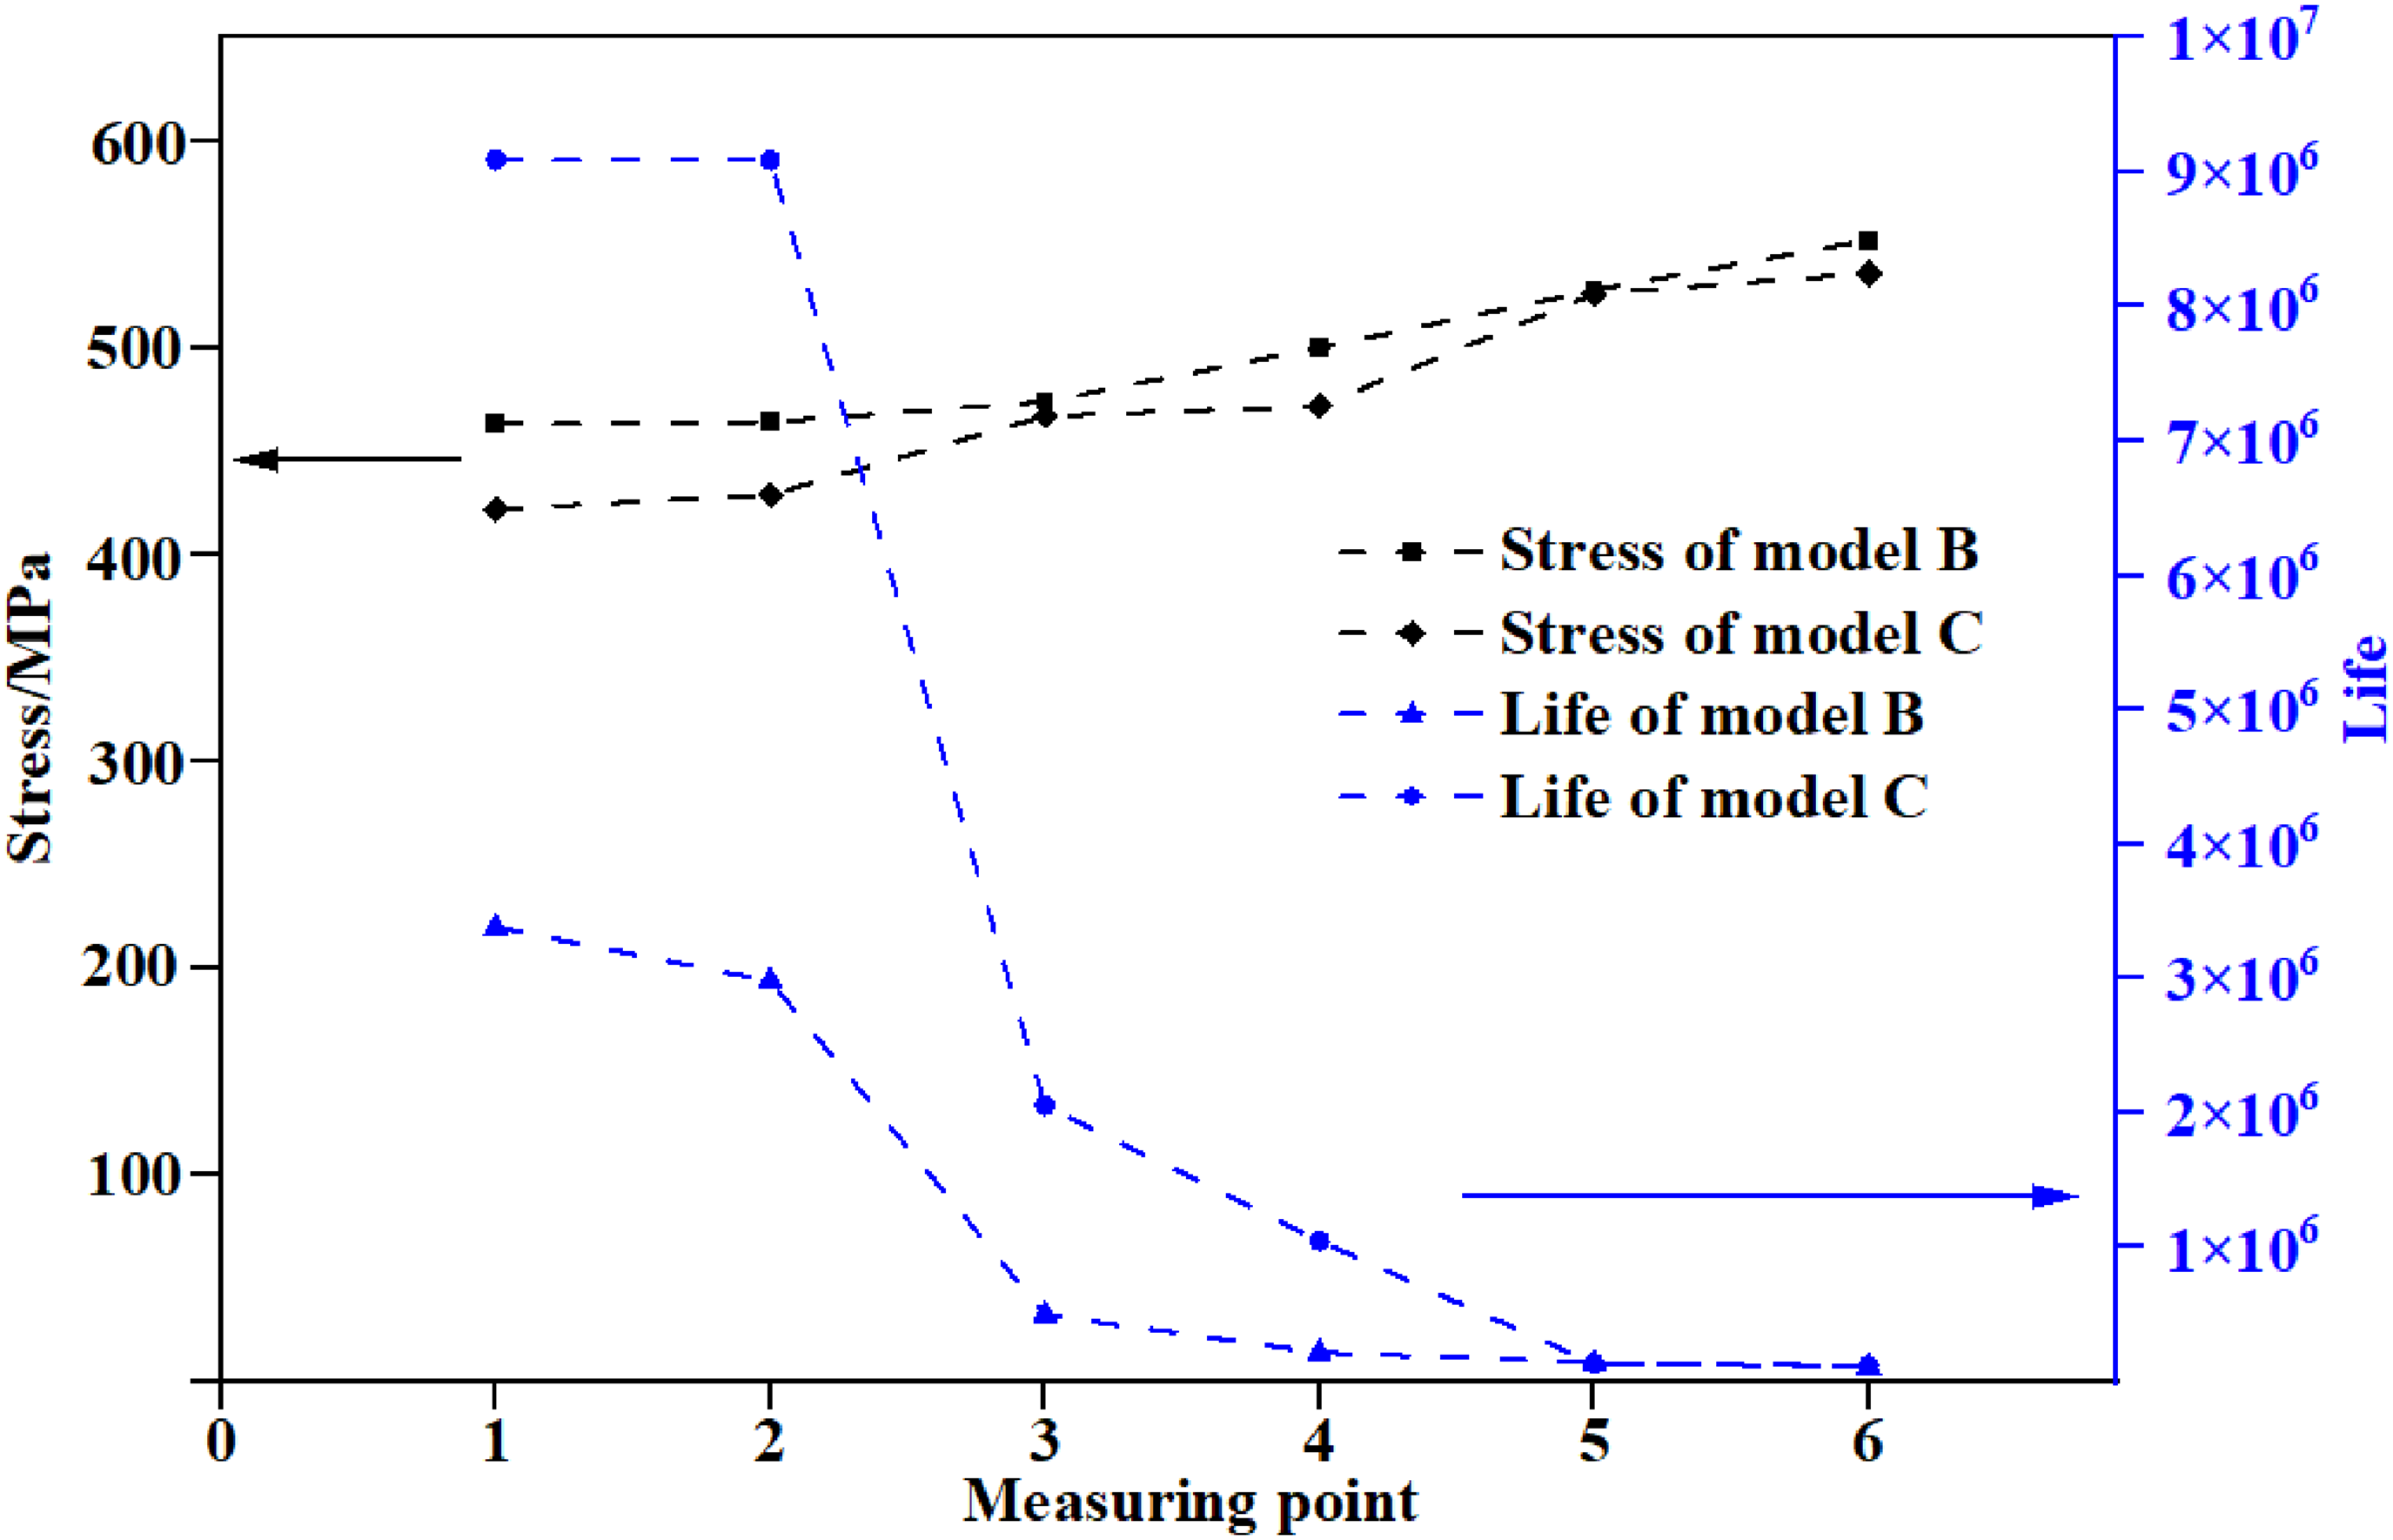
Models B, C stress and fatigue life trends.

Location of nodes.
The stresses and lifetimes of the control variable points for experimental group C (MPa, time).
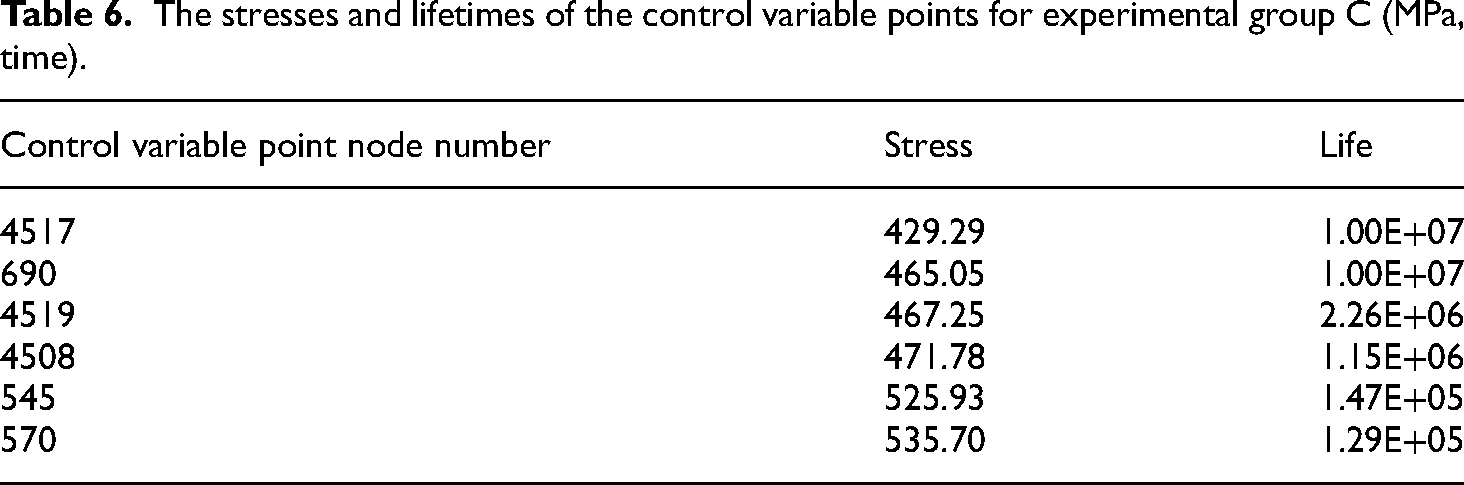
The weight of the HSC was reduced to 17.50%. The calculated data of model C showed that among the six control variables, the maximum stress occurred at node 570 with a maximum stress value of 536 MPa. The minimum failure point life of model C was 1.29E+05, which was higher than that of group B. To design an optimal lightweight HSC model by adjusting the control variable parameters and further optimizing, model D was obtained. The simulation results of the experimental group for model D are shown in Figure 19, and the control variable points are shown in Table 7. The stress and fatigue life trends of models C and D are shown in Figure 20. The location of the nodes is shown in Figure 21.

The simulation results of the experimental group for model D (a: model D, b: stress, c: deformation, and d: life).

The stress and fatigue life trends of models C and D.

Location of nodes.
The stresses and lifetimes of the control variable points for experimental group D (MPa, time).

When optimized for model D, the mass of HSC is reduced to 19.85%. Based on the calculation results, it can be observed that the stress level of model D gradually increases and the fatigue life decreases to 83881. This no longer complies with the lightweight design principle. Combined with the data comparison shown in Figure 20, the continuous reduction of the parameters in model C resulted in a significant reduction in the fatigue life of HSC compared to model D. To ensure that the model still met the fatigue life requirements while reducing its mass, the model parameters in the short life region were revised. After performing several correction calculations on the HSC model, the E model was obtained. The results of the ANSYS analysis for this model are shown in Figure 22. Figure 23 shows the stress and fatigue life trends of models C and D. A comparison of the minimum fatigue life at the control variable points for models A, B, C, D, and E is also shown in Figure 24.
The simulation calculation results of model E (a: model E, b: stress, c: deformation, and d: life).

The stress and fatigue life trends of models D and E.

Comparison of minimum fatigue life at control variable points for models A, B, C, D, and E.
Based on the simulation results presented in Figure 17, it is apparent that the maximum stress experienced by group E is 547 MPa, which is lower than the allowable stress of the material. Additionally, the deformation is 1.25 mm. Despite the weight reduction of 19.85%, model D has a fatigue life of only 83881, which fails to satisfy the design requirements. Conversely, model E, with a mass reduction of 19.83%, has a fatigue life of 1E+07 and a minimum failure life of 1.127E+05, thereby achieving the goal of lightweight design. In the optimized model, the life of models B and D is less than 1.10E+05, which fails to meet the design requirements, while the remaining model lives meet the criteria. Figure 19 compares the lifetimes of the models at the first failure point.
Validation of optimization results for the E model
The study obtained models for lightweight design by using static analysis, topology optimization, and fatigue life analysis. Among these models, model E was selected for comparison with the others, and experimental data were used to explain why model E was selected as the final model. Figure 25 shows the stress comparison between models A, B, C, D, and E (MPa).

Comparison of stresses in models A, B, C, D, and E.
After performing computational analysis on the optimization model E, the load–deflection curve was obtained as shown in Figure 26.

Load–deflection curve.
The calculations show that the curve is linear over a working pressure range of 90 MPa. This indicates that model E has sufficient strength and stiffness under load to withstand the working load without plastic deformation or failure. At this point, the stress–strain relationship of the structure is proportional, by Hooke's law. The stress–strain relationship of the structure is proportional, and the calculated results satisfy Hooke's law.
The optimized E model simulation calculation shows that the maximum stress appears at 0.683 X-axis coordinates, 0.052 Y-axis coordinates, and 0.069 Z-axis coordinates. The maximum equivalent force is 546.88 MPa, which meets the usage criteria. The minimum life of the model E under load conditions is 1.1277E+05, with an average value of fatigue stress of 9.5812E-005 for calculation. Assuming a rough material holding time of 30 minutes, the annual cycle number is 11520 (24 × 60 × 360/45), and the location of the minimum point of fatigue life is shown in Figure 27. The fatigue damage is displayed in Figure 28.

Fatigue life.

Fatigue damage.
The ANSYS calculation results show that the maximum damage point of HSC is at the convex ear position, and the damage caused by cyclic stress loading is DA = 8.868 × 10⁻⁶. According to the infinite life of 1 × 10⁸, the fatigue damage life of HSC is 24432 hours, which corresponds to a period of 780 seconds.
Comparison of models before and after optimization.

Based on different conditions, iterative calculations of structural parameters are performed within the range of design variables to find the globally optimal parameter combination. After screening, five lightweight design models were obtained. From the calculation results, it can be observed that the optimized model E has a reduced inner wall thickness of 105 mm, a reduced ear thickness of 110 mm, and an increased bottom thickness. This optimization allows for the maximization of structural layout and meets design requirements. According to the research, it can be concluded that the optimized model has reduced its weight by 1136.5 kg, a decrease of 19.83% compared to the original design weight. By reducing the amount of material used, the weight of the structure has been reduced, and manufacturing costs have been cut while still meeting the manufacturer's stress and fatigue life requirements. This shows that it is correct to find the structural optimal region using the results of topological iterative calculations. Then the solution based on the control variables’ points of force combined with the HSC structural design is feasible.
Conclusions
The purpose of this study was to optimize the HSC model using a method that corrects the size of the control variable region in conjunction with the information exchange system. The lightweight design of the HSC, based on the proposed method, can increase the effectiveness of the lightweight design as compared to the conventional one. This study summarizes the structural optimization methods employed by domestic and foreign experts in different mechanical parts. An information exchange system for the optimal design of HSC structures is proposed, which uses a more comprehensive analysis compared to previous research methods used by Chinese scholars in HSC models. The method considers the structural fatigue life based on topological design, allowing for optimal material distribution and shape, thereby ensuring maximum structural life and reliability. The result of this study was a reduction in HSC mass while meeting fatigue life requirements.
After finite element analysis, under loading working conditions, the stress analysis of HSC is not uniform, and there is a serious stress concentration. In the ear region, where fatigue failure will occur, the maximum equivalent stress is located. Using a mechanism for exchanging information, the HSC was effectively optimized. This study's optimal design of the HSC structure reduced mass by 19.83% while also taking fatigue life into account, which is better than the 15.7% mass reduction attained by HSC models developed by earlier researchers. In structural design, the initial thickness at the bottom of the structure was 265 mm, which had the greatest impact on the maximum stress. After optimization, the thickness increased to 280 mm, enhancing the strength of the structure. Through an optimization design based on an information exchange system, model E was obtained, which met the requirements of lightweight design and fatigue life. Static analysis is performed to obtain stress distribution data to optimize model E by adjusting the structural dimensions of the control variable point area. After iterative calculations, the optimized E model achieved a fatigue life of 1.1277E+05, which satisfies engineering requirements. Thus, this research method has significant guiding implications for HSC design.
Footnotes
Data availability statement
Important data are contained within the article. Additional data may be available upon reasonable request to the corresponding author.
Declaration of conflicting interests
The authors declared no potential conflicts of interest with respect to the research, authorship, and/or publication of this article.
Funding
The authors disclosed receipt of the following financial support for the research, authorship, and/or publication of this article: This work is supported by the Research and Practice Project on the Reform of Independent-Investigative-Cooperative Learning Teaching Methodology for Automation Majors under the Proposed Simulation Experimental Platform (Grant No. 2016JGB236). Additionally, it is also supported by the Guangxi Higher Education Undergraduate Teaching Reform Project (Grant No. 201802302102). Furthermore, New Material Technology Co., Ltd has provided support for the Transversal Project (20210320) titled “Strength Calculation and Optimization Analysis of HSC” from 2021-12 to 2024-12.