
Abstract
The digital image correlation method is a high precision and non-contact ground deformation monitoring method, which is widely used in surface deformation monitoring. However, according to its principle, different surface characteristics have great influence on the monitoring results. In this paper, a regional digital image slope monitoring method is established to meet the monitoring requirements of different areas of the same slope. Firstly, the features of different regions in the image are identified according to the optical region detection, and then the deformation calculation method is matched according to the features of different regions. Finally, according to the binocular vision principle, the three-dimensional displacement of the slope is obtained. Taking a highway slope in Qinhuangdao as an example, we realised all-weather and full-field deformation monitoring of slope, and verified the applicability and feasibility of regional digital image slope monitoring method. The applicability of digital image correlation method in slope monitoring is improved.
Introduction
Slope activity 1 refers to the temporal and spatial evolution of parameters such as slope displacement, velocity, acceleration and deformation. The monitoring of slope activity can accurately determine the movement of the slope. China is a mountainous country, forming a large number of natural slopes, and with the increasing number of engineering construction projects in China, a variety of artificial slopes have been created. Once the slopes become unstable and slide, it will pose a serious threat to the national economy. Therefore, it is very important to carry out slope activity monitoring research to grasp the state of slope movement and scientifically evaluate the stability of slope engineering.2,3
Slope activity monitoring has been a frontier topic in the field of international slope hazard research and environmental geology research, and is one of the key problems in reasonably solving the balance between human activities and natural geological bodies on the surface, and scholars at home and abroad have carried out a lot of work in this area.
At present, the commonly used slope monitoring methods include geodetic method, GPS method, 4 time domain reflection monitoring method,5,6 synthetic aperture radar interferometry, 7 and digital image correlation method. 8 Among them, the geodetic method and GPS method are point-based measurements, which cannot reflect the overall deformation of the slope; the time domain reflection monitoring method cannot determine the method of slope deformation; synthetic aperture radar interferometry is easily affected by atmospheric errors. With the emergence of a large number of slopes, the digital image correlation method, which can achieve full-field, high-precision, and low-cost monitoring, is still the focus of research in the field of slope engineering. Ohnishi et al. 9 established a digital camera-based slope monitoring system, and quantitatively verified the precision and accuracy of the technology, and tested its applicability in slope monitoring. Luo and Liu 10 set a panel with a symbol image on the slope as a measurement point, established local coordinates according to the relationship between the actual distance and the pixel distance of the photo, and obtained the relative displacement by comparing the identification results of the measurement points to realise the slope displacement measurement. This method has a cost low, high degree of automation advantages. Zhang et al. 11 applied digital photogrammetry technology to monitor the deformation characteristics of a slope project, and compared the monitoring results of digital photogrammetry with dial indicator indicators. The results show that the surface deformation measured by digital photogrammetry is similar to that obtained using a dial indicator. The maximum error between the two is less than 0.02 mm. Gance et al. 12 used image correlation complementary algorithms to detect and track natural or artificial target points in sequence images to achieve landslide displacement monitoring. Stumpf et al. 13 monitored landslide surface deformation, volume and displacement rates through multi-view stereo photogrammetry, and verified them against GPS monitoring data. Although the above research work has achieved many meaningful results, there is still a key problem in the slope monitoring research that has not been well solved. Usually, a slope has different regional characteristics, and different displacement calculation methods are proposed. Requirements, that is, the displacement calculation method needs to be able to adapt to different regional characteristics, and there is currently no matching displacement calculation method for different regional characteristics. Only in this way can the full-field and high-precision monitoring of the slope be realised.
In this paper, we carried out similar model tests on slopes, calculated the slope surface displacement field by digital image correlation method, studied the influence of the calculation accuracy of different regional feature image correlation methods, proposed a slope activity monitoring method based on digital scattering correlation method, and analyzed the spatial and temporal evolution law of a slope deformation field of Cheng-Qin Expressway in Qinhuangdao City.
Study of factors influencing area features by digital image methods
Slope similarity model test
When calculating using digital image correlation methods, the grey scale characteristics of the image are an important factor in the accuracy of the calculation. As a slope has different regional characteristics and the regions at different locations undergo different degrees of succession over time, it is important to analyse the characteristics of the different regions on the slope in relation to the image grey scale characteristics. In order to analyse the factors affecting the accuracy of the digital image correlation method, indoor slope similarity simulation experiments were carried out. Barite, quartz sand, and gypsum were chosen as the experimental materials and the slope model was constructed in the laboratory. The experimental data acquisition system mainly consists of a CCD camera, a cold light source, a rotating stand and a computer, as shown in Fig 1(a). According to the design requirements in Fig. 1(b), the surface of the slope was divided into three area types, labelled 1–3, where area 1 was the rock and soil area; area 2 was the rock and soil area after spraying scattered spots; and area 3 was the vegetation area.

Schematic diagram of the test arrangement.
The displacement error clouds in the x and y directions of each region of the slope were calculated by the digital scattering correlation method, as shown in Fig 2. As can be seen from Fig. 2, the displacement errors of area No. 2 and area No. 3 generally remain within 0.02 pixel, while area No. 1 is not scattered, resulting in relatively larger displacement errors in this area compared with other areas, of which the maximum displacement error in the x-direction is about 0.12 pixel and the maximum displacement error in the y-direction is about 0.18 pixel.

Displacement error cloud (unit:mm).
The grey-scale 3D topography and image information entropy14,15 are used to analyse the characteristics of different areas and their impact on monitoring accuracy. Information entropy is generally used to quantify the degree of information confusion, and can also be used to count the expected value of random variables, so image information entropy is chosen as a metric to measure the richness of grey-scale information in different areas of the slope image. The greater the image information entropy, the greater the randomness of the image, and the better the correlation matching effect when using digital image correlation methods. The above three image sub-regions and their grey-scale 3D morphology maps are extracted separately and the corresponding image information entropy is calculated. As shown in Fig 3, the grey scale value of sub-region 1 is mostly concentrated around 170–190, and the difference between the grey scale values of each pixel is relatively small, the image information entropy is 3.8994, the information entropy value is low, indicating that the image lacks sufficient random grey scale information, the grey scale features do not have sufficient recognition, it is difficult to be effectively identified, resulting in a large displacement error. The image information entropy is 6.4962, indicating that the image has a large amount of grey scale information and high randomness, the image sub-region can be uniquely identified and the displacement error is relatively small. Sub-region three belongs to the vegetation area, the grey scale value is mostly distributed below 80, the image sub-region is darker and has more repeated textures, the image information entropy is 5.5212, the image information is richer, but the vegetation The image information entropy is 5.5212, which is rich in information, but the vegetation area is obscured, which is difficult to reflect the real slope movement state. The analysis of the grey-scale distribution characteristics of the image sub-regions in different areas shows that the grey-scale and texture characteristics of different areas on the slope vary greatly, and the digital image correlation method alone cannot fully satisfy the calculation of the deformation of all slope area characteristics.
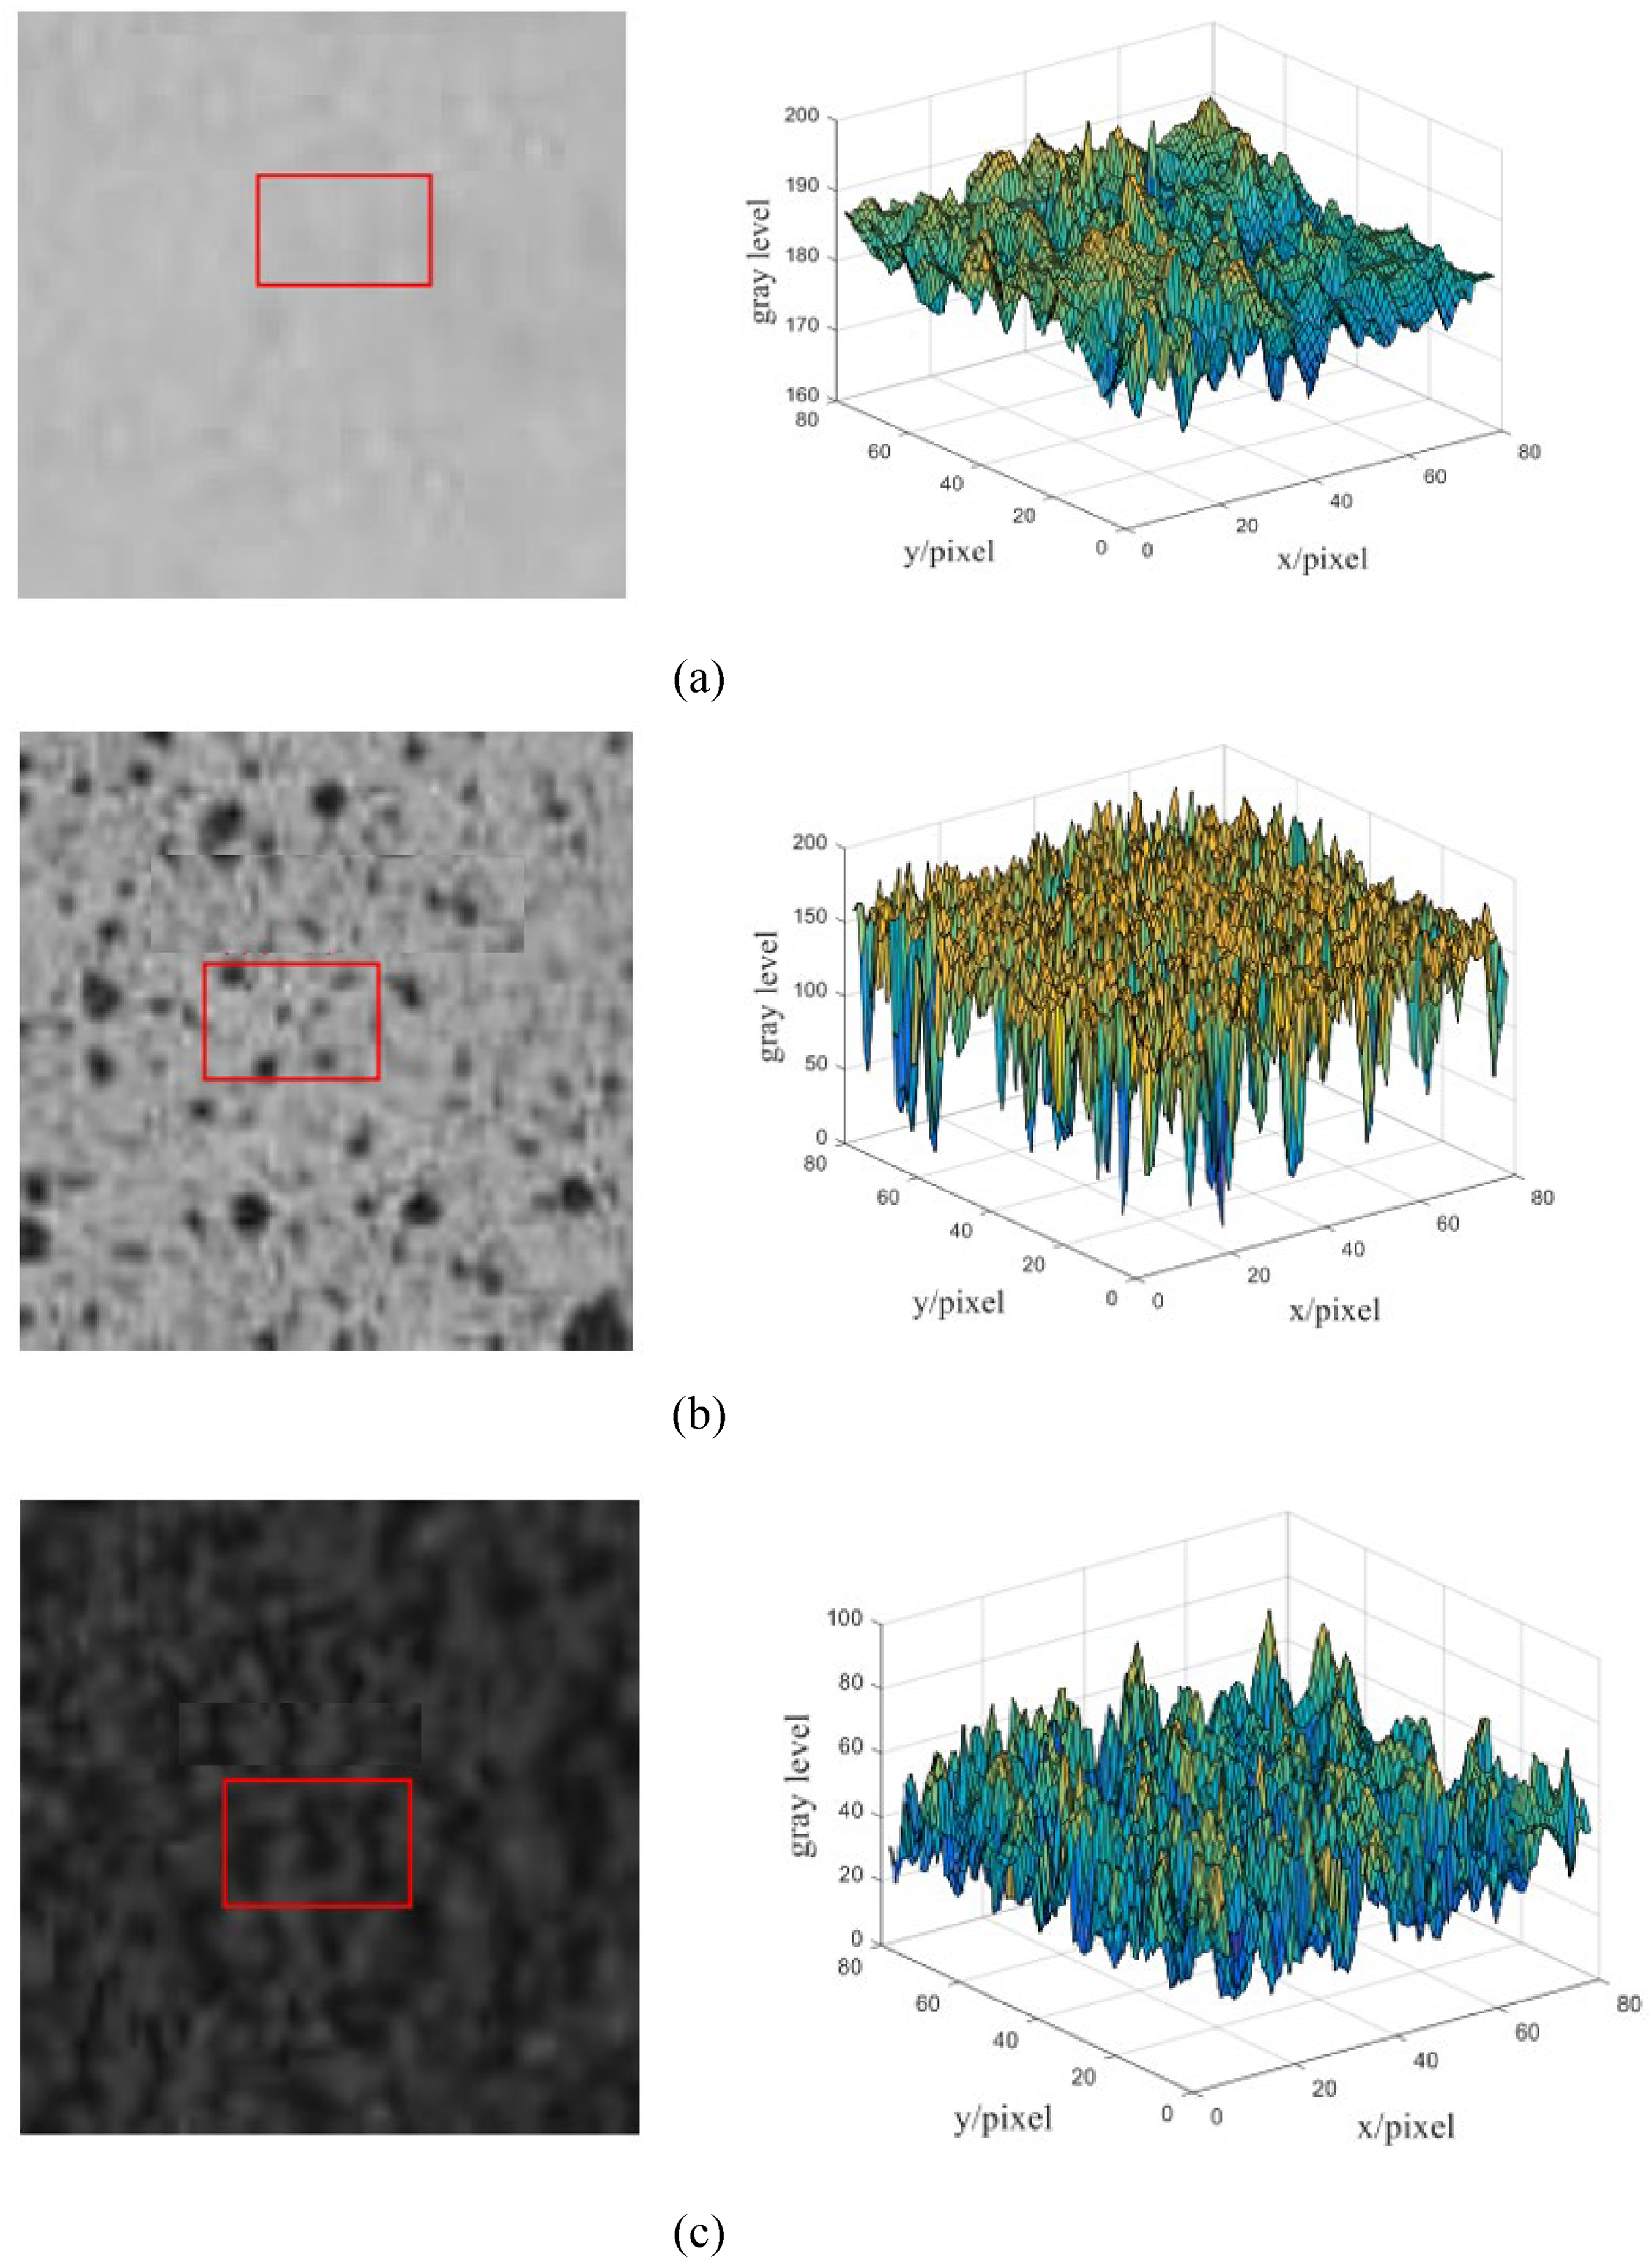
Sub-regions of the image in different regions and the corresponding grey-scale 3D distribution. (a) Sub-region of image No. 1 and its grey-scale 3D distribution. (b) Sub-region of image No. 2 and its grey-scale 3D distribution. (c) Sub-region of image No. 3 and its grey-scale 3D distribution.
Slope activity calculation methods
Digital scatter correlation method
The digital image correlation method is a deformation measurement method based on the grey scale features of an image.16,17 The basic principle of the digital speckle correlation method is to obtain deformation information by tracking the movement of the same point in the images before and after deformation (referred to as the reference image and the target image, respectively). When using the digital image correlation method for measurement, in order to obtain accurate and reliable displacement calculation results, the image sub-region should contain enough random grey-scale information to ensure that the sub-region window can be uniquely identified before and after deformation. The basic principle of the digital image correlation method is shown in Fig 4.
SIFT feature point method
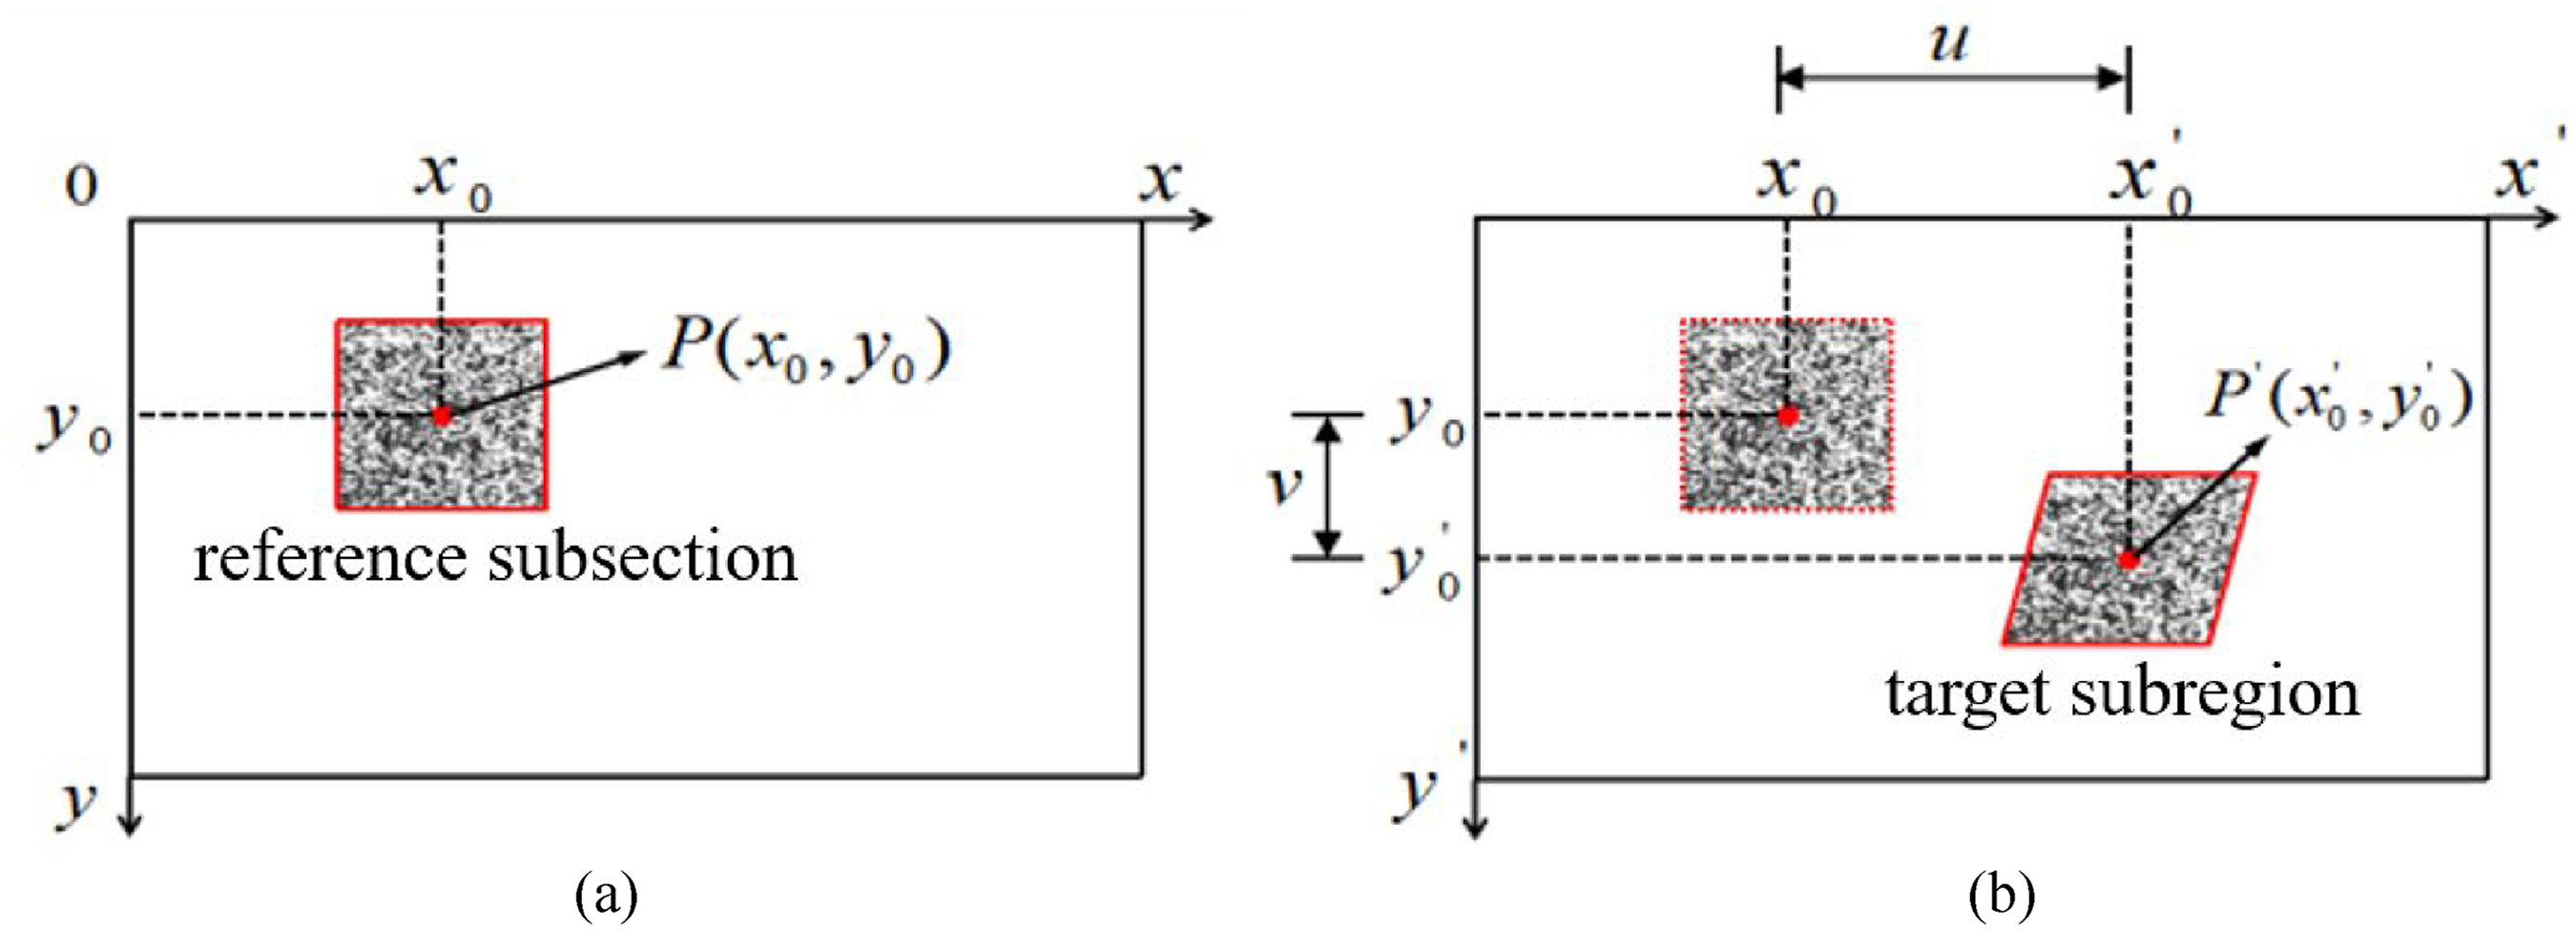
Schematic diagram of the principle of digital image correlation. (a) Reference image. (b) Target image.
The SIFT feature point algorithm is a matching algorithm based on local spatial features, which remains invariant to rotation, scale scaling, and luminance changes. 18 The algorithm flow is shown in Figure 5, where the SIFT feature points are extracted from the reference image and the target image respectively, the feature points are described using feature vectors, the corresponding points are matched based on the correlation of the feature vectors, and the mismatched points that do not meet the requirements are eliminated. As the Euclidean distance-based matching method is prone to a large number of false matching points, this paper converts it into a feature vector correlation calculation method by replacing the Euclidean distance method with the correlation coefficient for matching.
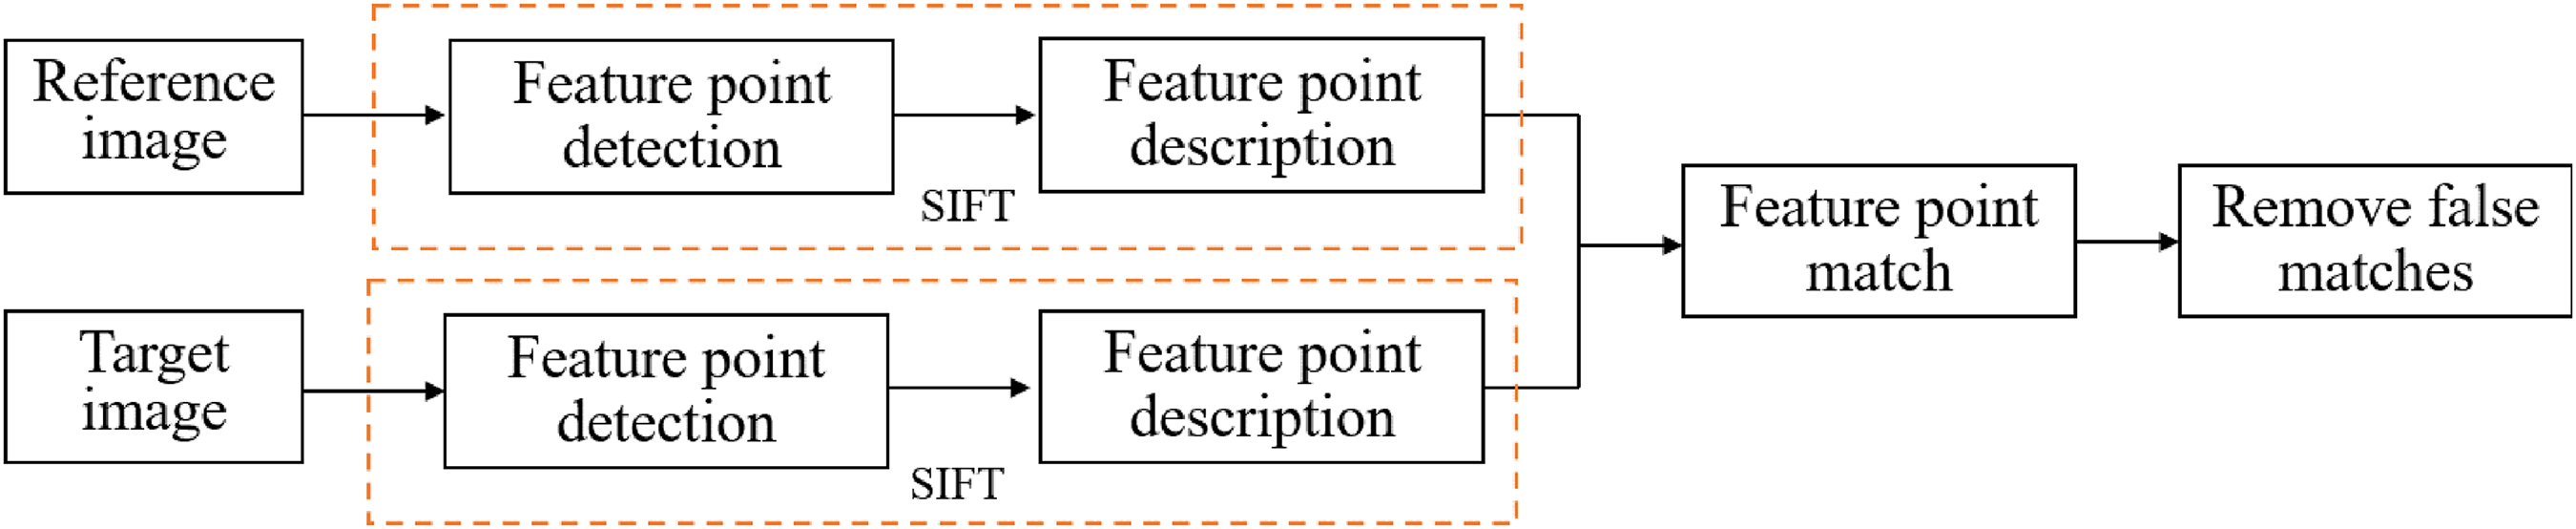
Flow chart of the SIFT algorithm.
Vegetation zone zoning method
The vegetation index uses the combination between NIR band and IR band to complete the separation and extraction of vegetation area and geotechnical area.
19
In this paper, the calculation method of ExG-ExR is chosen for the initial extraction of vegetation areas of slope images, as shown in Equation (1), VI ′ that is, the vegetation index of RGB images calculated as Method of analysis of the influence of grey-scale differences


Schematic diagram of vegetation area extraction.
It is not enough to divide the slope area into vegetation and geotechnical parts, but it is also necessary to divide the slope geotechnical area according to its grey scale value distribution characteristics and select the area suitable for the slope activity calculation method. In this paper, K-means clustering 20 is used to cluster the grey-scale images of the slope. K-means algorithm clusters K centres in the space by randomly selecting them, and based on the Euclidean distance from each sample point to the cluster centre, one or more groups of data are gathered to form K clusters, and then new clusters are formed by iteration until the optimal clustering result is found. Here, three clusters are used as the initial number of clusters to cluster the grey-scale image of the side slope, as shown in Figure 7. Observing the area circled by the rectangular box, we can find that the grey-scale value of each pixel point of the side slope image after the clustering process will be delineated into the corresponding grey-scale interval, reducing the grey-scale dimensionality of the image. According to the grey scale distribution characteristics of the image after dimensionality reduction, the region can be divided into two categories: among them, the left side of the region has a more uniform grey scale value, and the right side of the region presents the characteristics of alternate distribution of different grey scale values, with obvious grey scale difference, so the grey scale difference can be used as the principle of partitioning, and with the principle of image connected domain, the region with consistent grey scale value is extracted to realise the division of the above two parts of the region, and the partitioning result The result is shown in Figure 8.

Clustering results of slope images.

Schematic diagram of geotechnical area zoning.
The whole algorithm process is divided into three modules, namely pre-processing, deformation calculation and post-processing, the pre-processing includes slope photometric partitioning, the slope photometric partitioning is to use the program to automatically identify the characteristics of the image area and automatically divide the slope image into bare rock area, vegetation area and weathered soil area. The deformation calculation uses the results of the slope photometric zoning in the pre-processing to automatically match the appropriate calculation method according to the characteristics of different zones to achieve 3D measurement; the post-processing includes the calculation and processing of the 3D displacement data of the slope, and the calculation of the velocity and acceleration fields of the slope based on the time information between images.
Field application study of slope activity monitoring
Project example
In this chapter, the slope of the Cheng-Qin Expressway in Qinhuangdao City is used as the engineering background, and the observation site is selected at the slope on the side of the Cheng-Qin Expressway near the toll station in Qinglong Manchu Autonomous County, Qinhuangdao City, as shown in Figure 9. The slope is 50 m long and the highest point is 22 m from the highway level. The south and north sides of the slope are each partly covered by grass and trees, the overlying soil layer is mostly gravel and boulders, and the underlying bedrock is gneiss and granite porphyry. The Side slope site plan is shown in Figure 10.

Side slope location plan.

Side slope site plan.
The overall scheme of equipment arrangement is shown in Figure 11. After comparing the distance between the observation platform and the measurement point and the observation angle, according to the technical parameters of the monitoring camera, the selected camera model is Hikvision DS-2CD3T56WD-I3 monitoring camera with 8 mm camera lens, the resolution can reach 2560 × 1920, and the sampling frequency of the camera can reach 25fps. four monitoring points are set, and the concrete base is poured every 14 m, and the height of the column is 2.2 m.

Equipment layout plan.
Using the images collected in the field, an image from 7 May 2019 was used as an example to realise the division of this road slope photometric area according to the slope photometric area division method proposed in this paper, combined with the MATLAB compilation platform.
Vegetation area delineation
Firstly, the slope vegetation area is extracted according to the vegetation area extraction method, and then the slope geotechnical area is divided. Three clusters were used as the initial number of clusters, corresponding to the three grey-scale intervals of the image, and the K-means clustering method was used to downscale the grey-scale levels of the image. By extracting three types of areas, namely vegetation area, bare rock area and weathered soil area, the division of the slope photometric area was completed, as shown in Figure 12, the green marked area is the vegetation area, the light yellow marked area is the bare rock area, and the blue marked area on the slope is the weathered soil area.

Schematic diagram of the division of the slope photometric area.
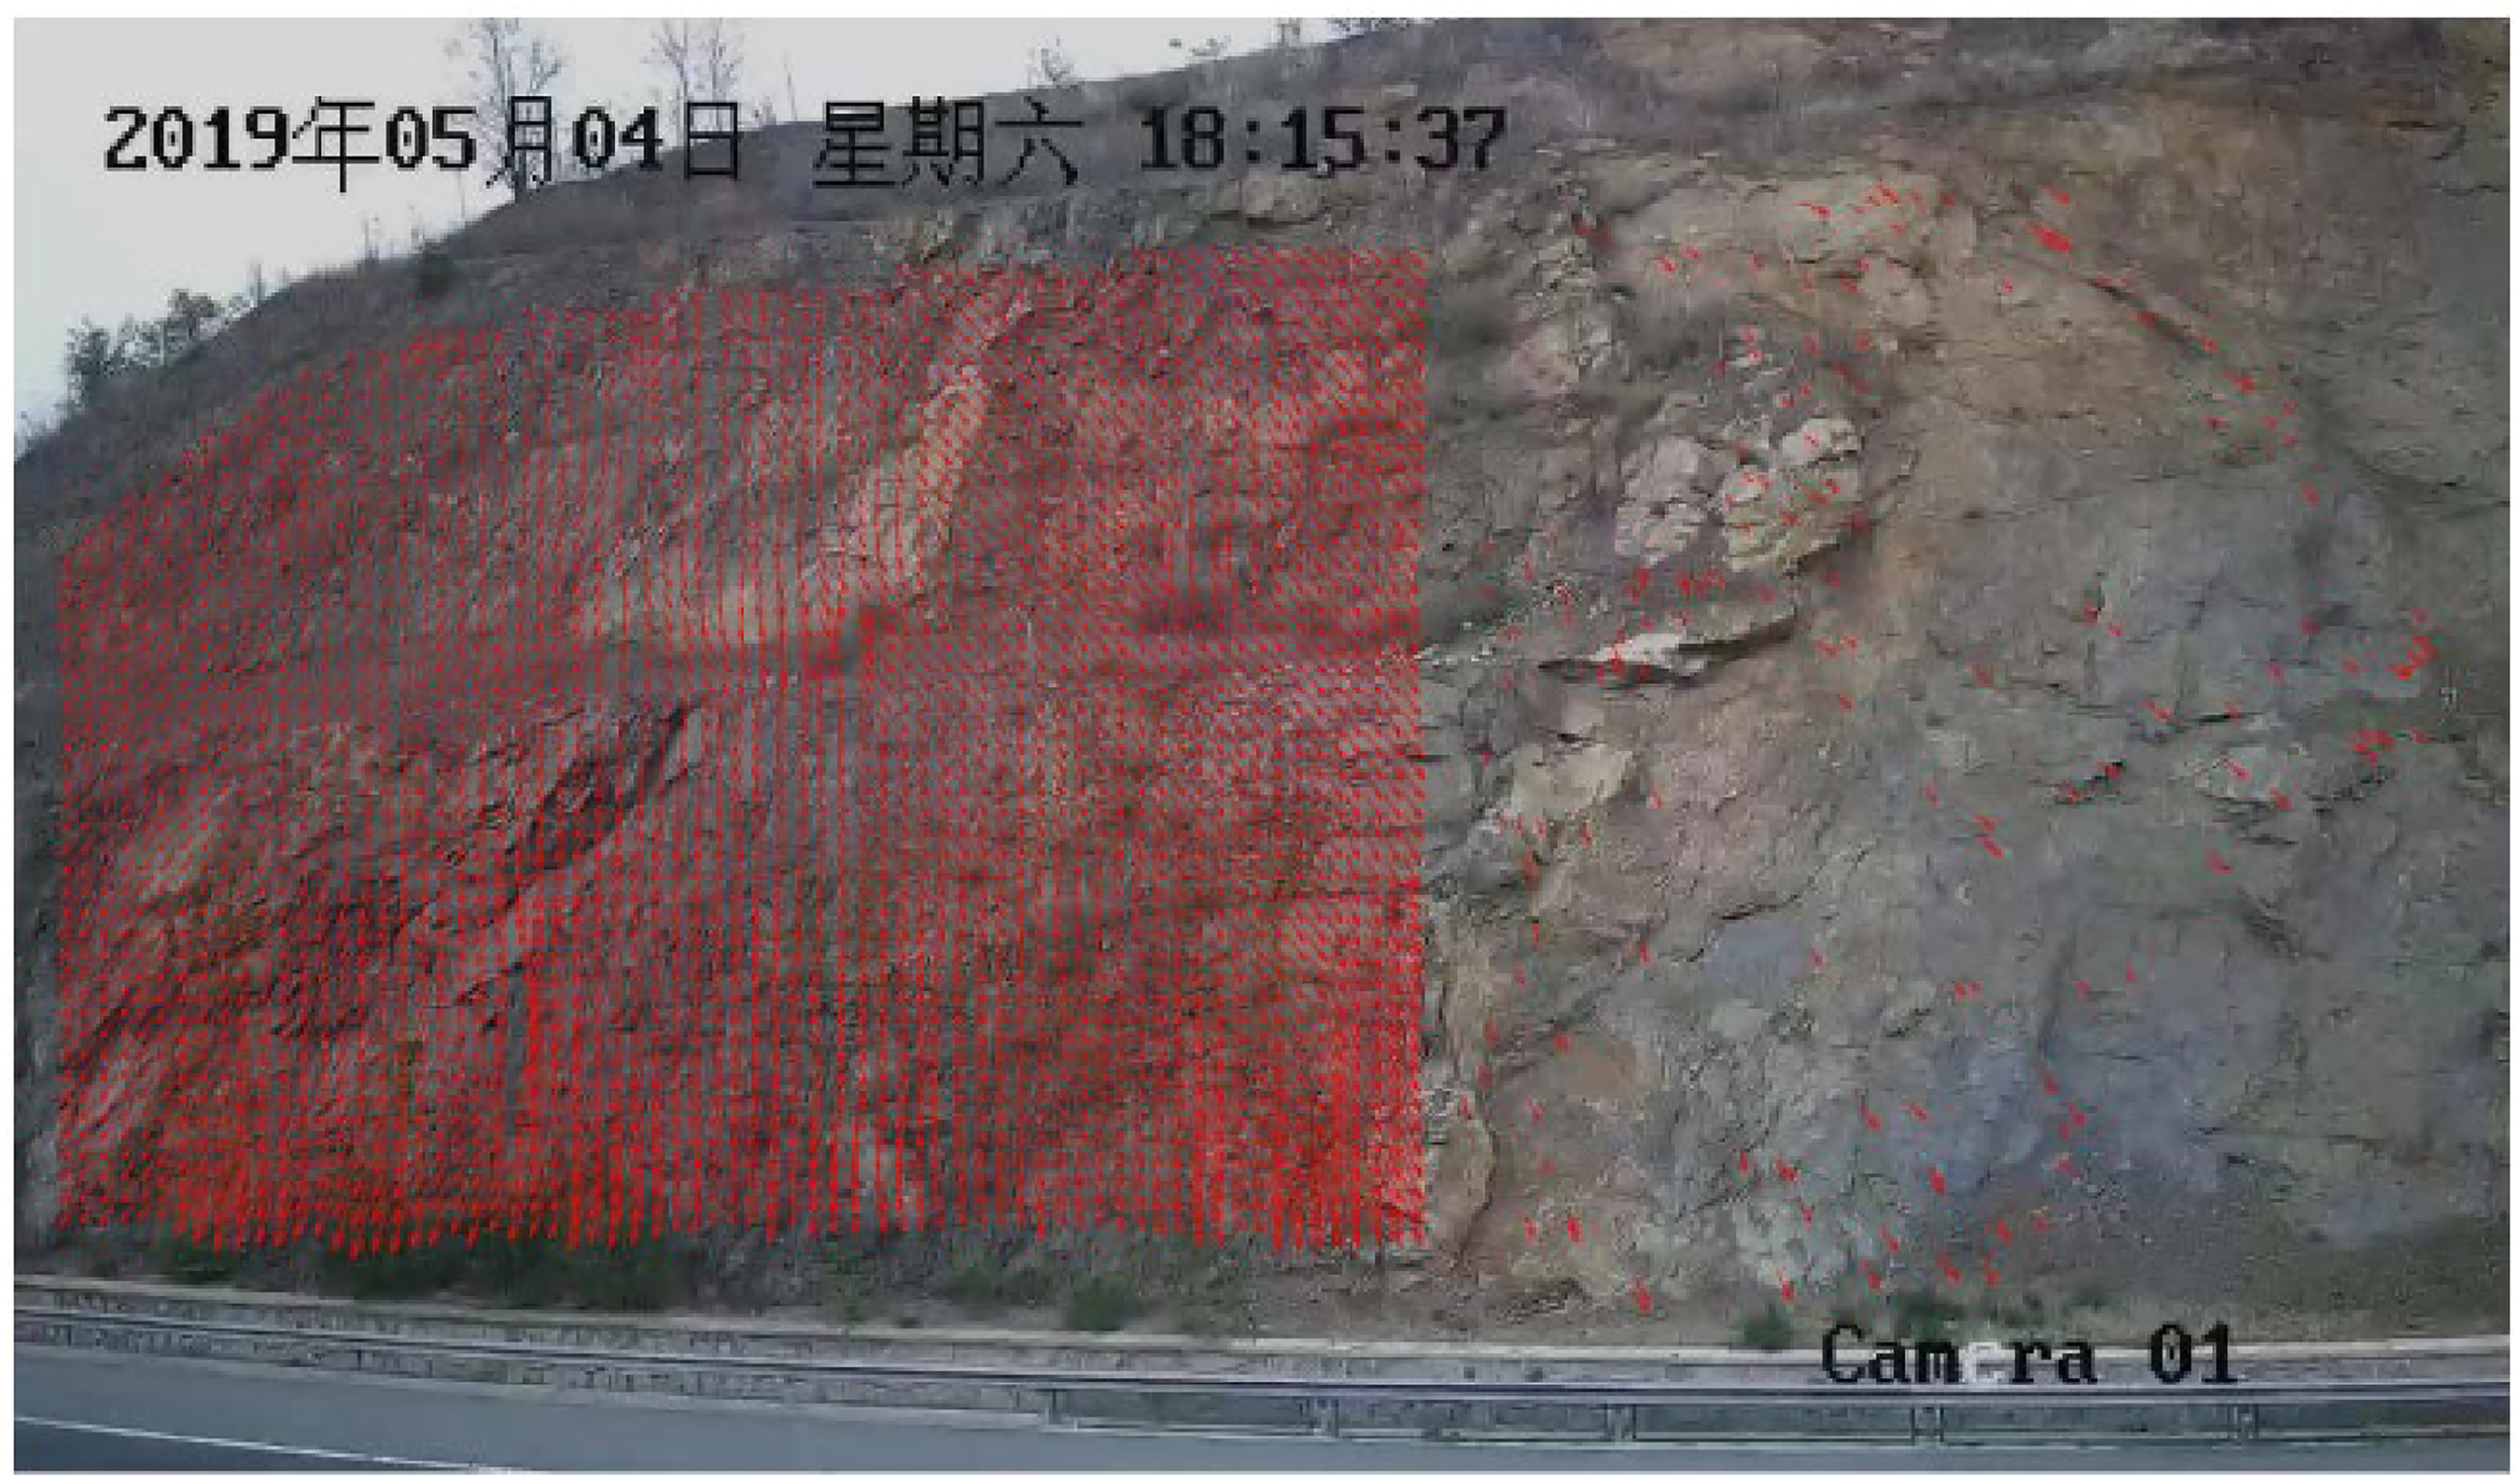
Using the slope activity calculation method proposed in this paper, the image of 26 January 2019 at 16:09 was used as the reference image to calculate the parameters of the deformation field, displacement vector map and displacement rate contour map of this highway slope in the time period of January-May 2019, and to conduct preliminary analysis of the deformation field and displacement vector parameters of the slope obtained from the actual measurement. The image at 18:15 on 4 May 2019 was selected as the deformation image. Based on the results of the photometric area delineation, the slope activity at this moment was calculated using the digital image correlation method and the SIFT feature point method. Figure 13 shows the displacement vectors of the slope from January to May, with the left region of the displacement field sliding to the left and the right region of the displacement field sliding to the right, and the displacement vector size increasing compared to the previous period.
Vector map of slope displacements for January–May 2019.
Figure 14 shows the displacement field components in each direction of x and y from January to May. From Figure 14(a), it can be seen that in the weathered soil area, the left and right parts of the horizontal displacement field form two independent movement areas with opposite movement directions, in which the left area moves towards the left and the displacement maximum value increases from 0.3 to 0.47 cm, and the right displacement maximum value increases from 0.4 to 0.5 cm; in the bare rock area In the bare rock area, the maximum displacement field value is 0.8 cm, showing a non-uniform distribution overall. From Fig. 14(b), we can see that the displacement field is positive in the vertical direction, indicating that the direction of movement of the slope is still downward, and from the colour of the colour scale, the distribution of the displacement field is also obviously different compared with that of the previous period. The maximum displacement value at the lowermost side of the displacement field increases from 0.6 cm to nearly 1.5 cm, due to the presence of some weeds and debris in some areas, resulting in a large variation of displacement values.
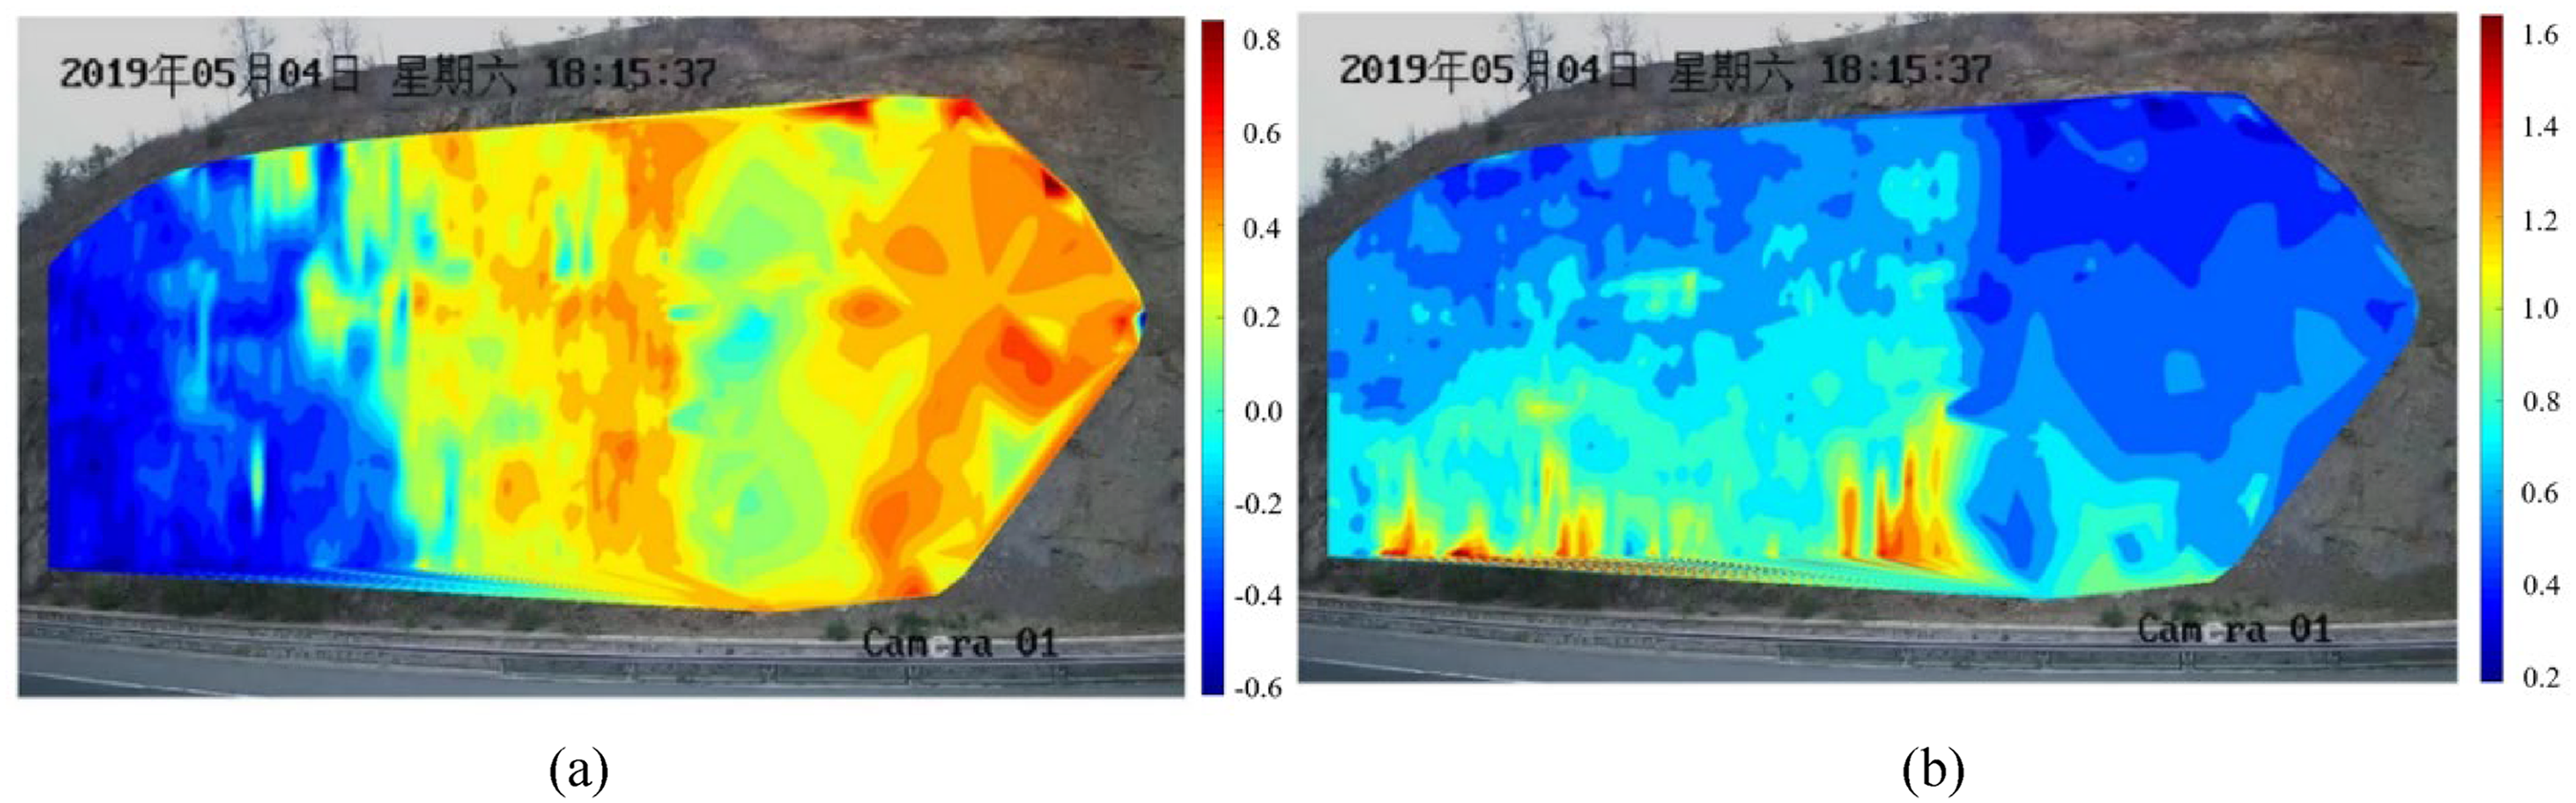
Slope Displacement Field January–May 2019 (Unit:cm). (a) displacement field in the x-direction. (b) displacement field in the y-direction.
Using the slope displacement field data obtained from the above calculation, the slope vertical displacement rate contour map is calculated and drawn based on the temporal information of the image, the displacement rate vector arrow can reflect the speed and direction of the slope displacement change in this time period. As shown in Figure 15, in the vertical direction, the vertical displacement rate of the upper part of the slope is 0.003 cm/day and the vertical displacement rate of the lower part is 0.035 cm/day, and the vertical deformation rate of the slope is 0.01–0.03 cm/day. In summary, by drawing the slope displacement field map, displacement vector map and displacement rate contour map, the overall deformation state of the slope is visualised and reliable slope activity data is provided.

Contour map of vertical rate of slopes for March–May 2019 (Unit:cm/day).
Combining binocular vision and the slope activity monitoring method in this paper, the two-dimensional measurement is extended to three-dimensional measurement. Figure 16 shows the three-dimensional displacement map of the slope. The three-dimensional displacement map of the slope can better reflect the three-dimensional movement of the slope, the size of the colour scale in the figure is the size of the combined displacement, the maximum displacement is about 1.5 cm, and combined with the image of the slope, it can be observed that there is no obvious deformation of the slope at this time.
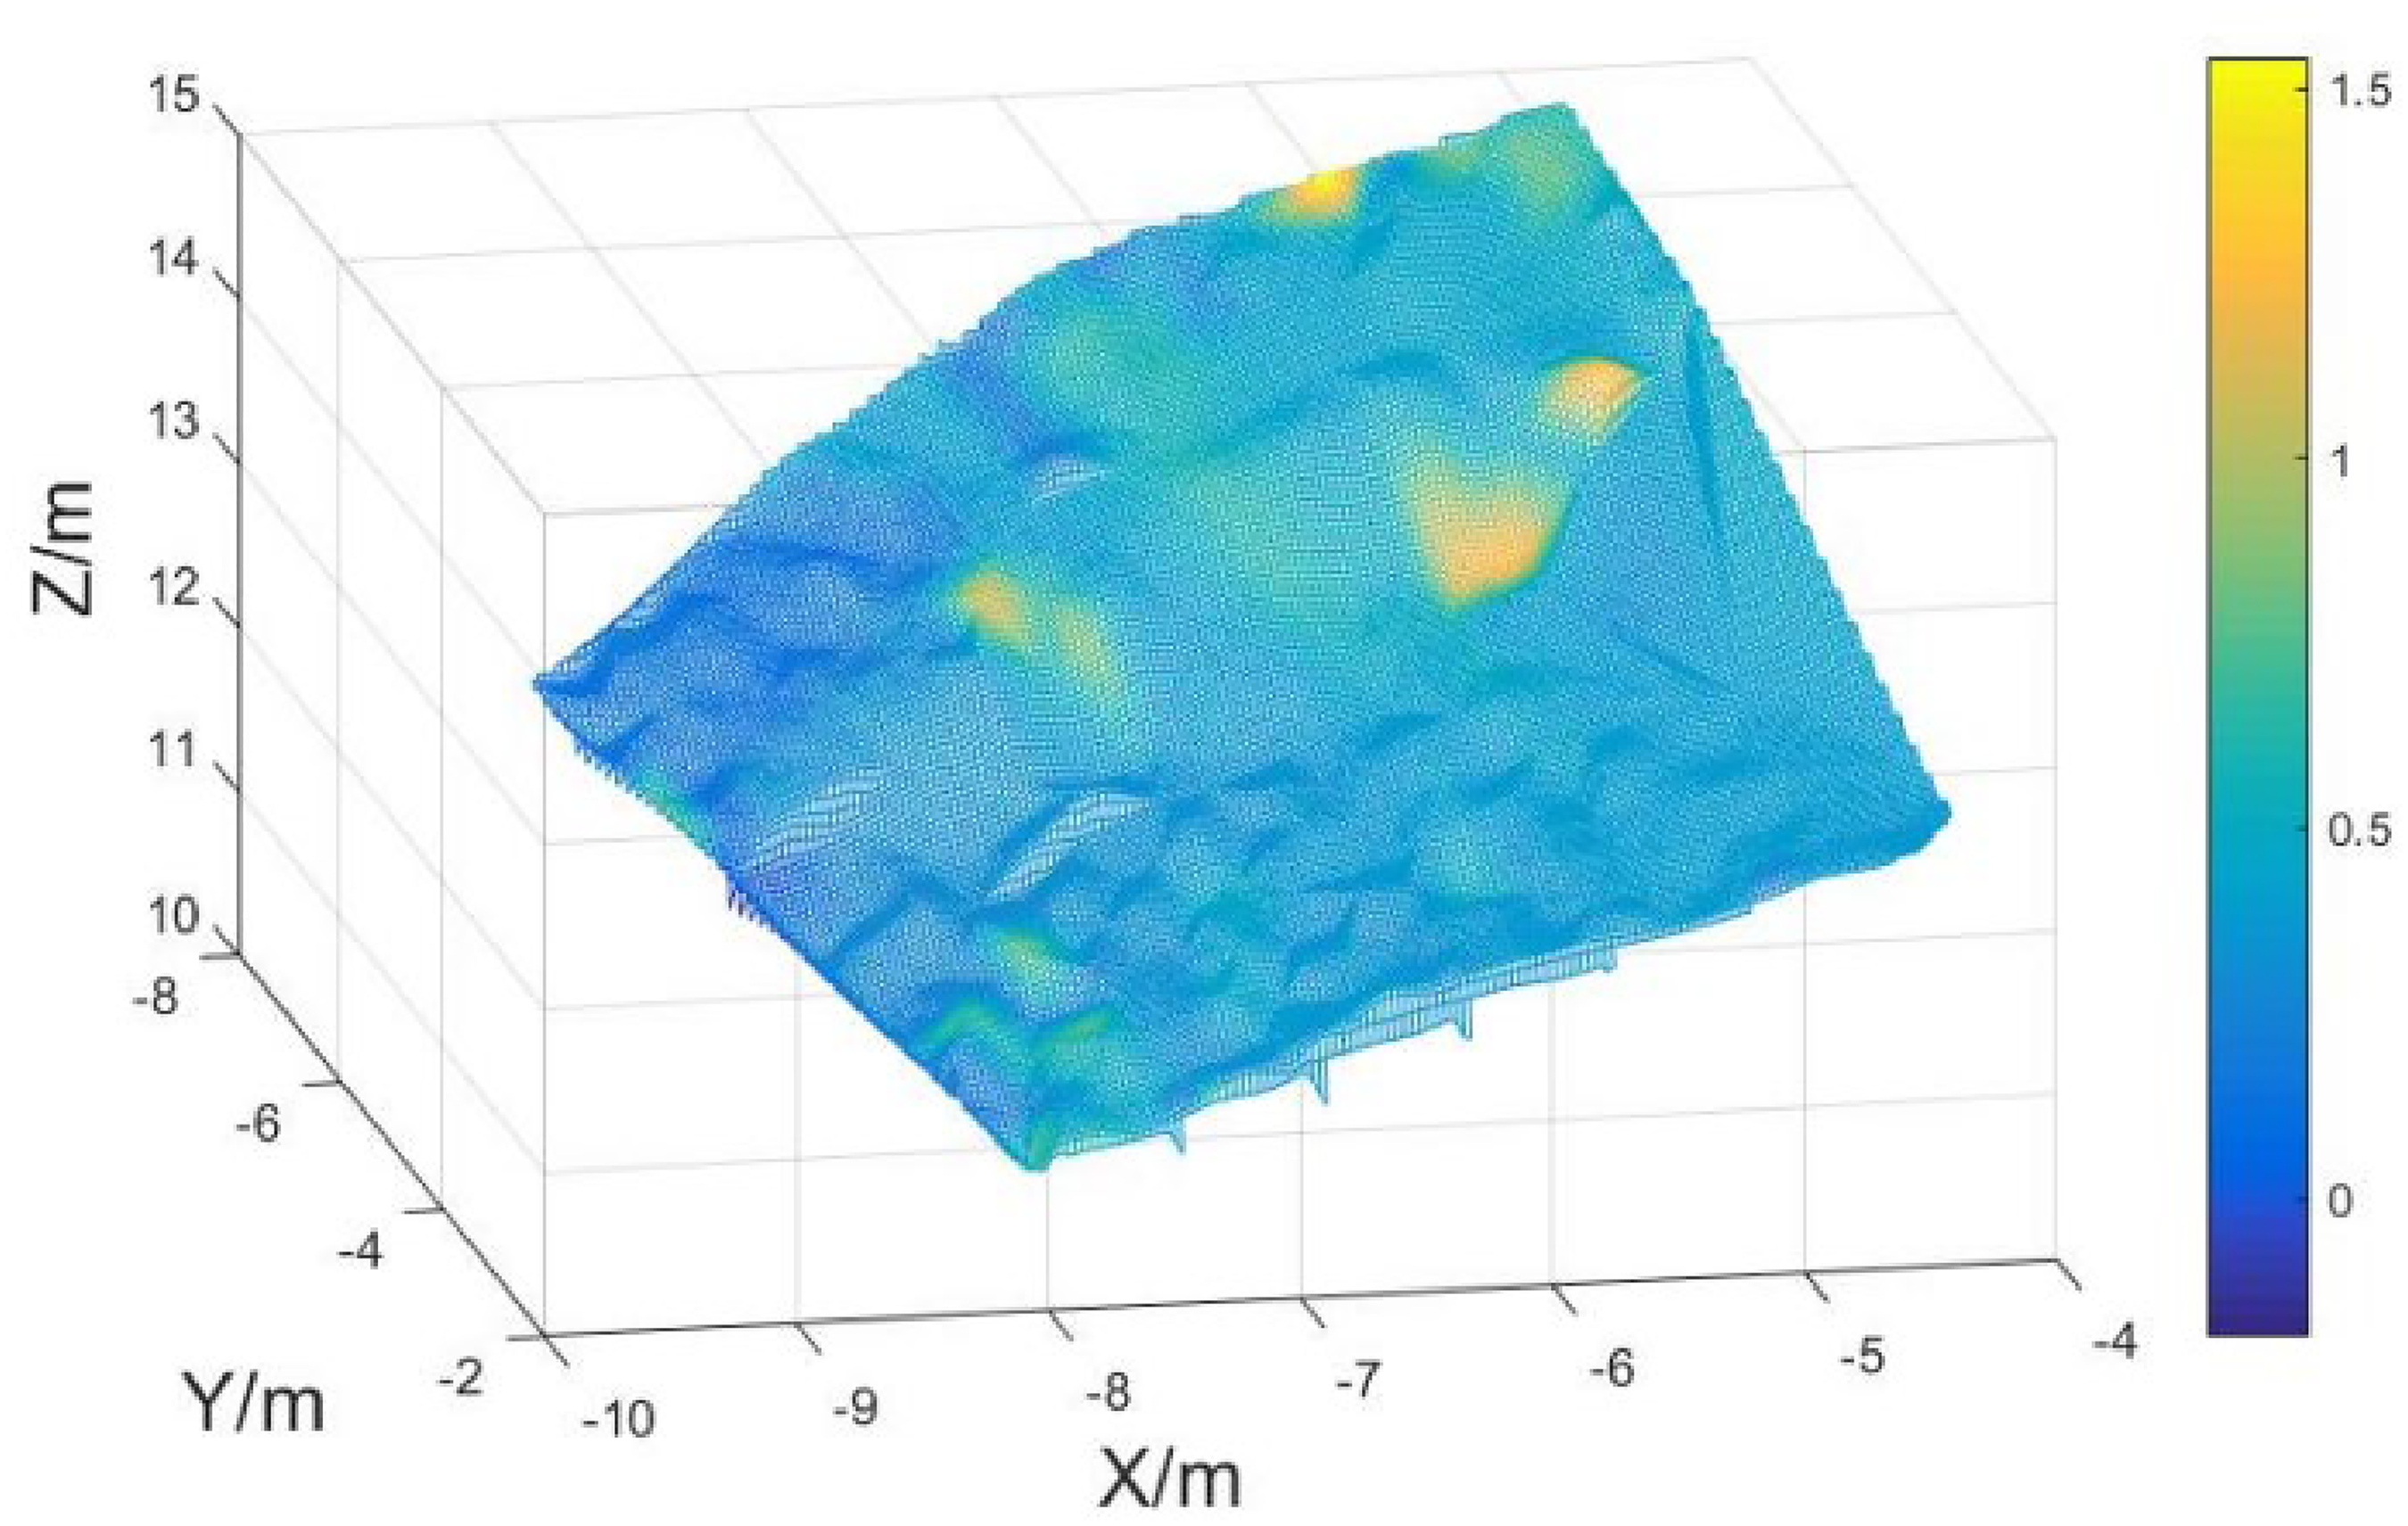
Three-dimensional displacement map of the slope (Unit:cm).
The numerical image correlation method was used to calculate the displacement fields in different areas of the slope, and the influence of different regional characteristics on the calculation accuracy of the digital image correlation method was studied. The results show that the information entropy of different regional features varies greatly, which affects the calculation accuracy of digital image correlation methods. The information entropy of the rock and soil region is the largest after the spraying point, indicating that this region has a large amount of characteristic grey information, so the calculation accuracy of this region is higher.
A slope monitoring method based on digital image partition is proposed to realise automatic partition and deformation calculation in different areas of slope. Firstly, the vegetation area of the slope is extracted by calculating the vegetation index, and then the bare rock area and the weathered soil area are extracted by grey scale clustering. Finally, the digital scattering correlation method and SIFT feature point method are combined as the displacement calculation methods, and according to the algorithm, according to the characteristics of different regions, the corresponding position shift calculation method is matched.
Through on-site monitoring of the slopes of the Cheng-Qin Expressway in Qinhuangdao City, Hebei Province, the overall movement state of the slopes is calculated by the regionalised digital image slope monitoring method, which provides detailed and reliable slope activity data. By analysing the evolution characteristics of the slope displacement field and velocity field, it is concluded that the slope is still in a relatively stable state at this time. And based on the principle of binocular vision, the three-dimensional measurement of the slope is realised, which can better reflect the three-dimensional movement state of the slope.
Footnotes
Author's note
LING Xiaokang is also affiliated at China Water Resoureces Pearl River Planning Surveying & Designing Co., Ltd, Guangzhou 510635, China.
Declaration of conflicting interests
The author(s) declared no potential conflicts of interest with respect to the research, authorship, and/or publication of this article.
Funding
The author(s) disclosed receipt of the following financial support for the research, authorship, and/or publication of this article: This work was supported by the National Natural Science Foundation of China, (grant number 51774015).
Author biographies
ZHANG Jingzong is an assistant professor at the School of Civil Engineering, North China University of Technology. His areas of research are survey engineering and geotechnical engineering monitoring.
LING Xiaokang is a researcher at China Water Resoureces Pearl River Planning Surveying& Designing Co., Ltd. His area of research is mine disaster prevention.
HE Zhijie holds a Master degree in Geotechnical engineering. His area of research is mine disaster prevention.
SONG Yimin is a professor at the School of Civil Engineering, North China University of Technology. His area of research is mine disaster prevention.
Xu Hailiang is an assistant professor at the School of Civil Engineering, North China University of Technology. His areas of research are underground engineering and rock burst.
AN Dong is a lecturer at the School of Civil Engineering, North China University of Technology. His areas of research are seismic engineering and energy absorption technology.