
Abstract
Nanoplastic pollution is an emerging environmental threat to the critical zone. The transport of nanoplastic particles in subsurface environments can be determined mainly by soil minerals because they provide surfaces that interact with nanoplastic particles. However, the interactions between mineral surfaces and nanoplastics are poorly understood. In this study, the deposition kinetics of polystyrene-nanoplastic particles onto representative oxide surfaces SiO2 and Al2O3 at circumneutral pH were investigated using a quartz crystal microbalance, with variations in the ionic strength (0.1–100 mM) of the well-dispersed nanoplastic particles suspension. While polystyrene-nanoplastic particles deposited minimally on the SiO2 surface at an ionic strength of < 100 mM (∼10 ng/cm2), substantial deposition occurred at 100 mM (3.7 ± 0.4 μg/cm2). On the Al2O3 surface, a significant amount of polystyrene-nanoplastic particle was deposited from the lowest ionic strength (4.5 ± 0.8 μg/cm2). The deposition mass at 100 mM NaCl was two times higher (7.2 ± 0.2 μg/cm2) than on the SiO2 surface, while the deposition rates were similar between the two surfaces (10–15 Hz/min). Our results indicate that alumina most likely exerts a stronger influence than quartz on the transport of nanoplastic particles in soils and groundwater aquifers. The deposition kinetics strongly depends on the mineral surface and solution ionic strength, and these quantitative results can serve as validation data in developing transport modeling of nanoplastic in subsurface environments.
Introduction
Plastics have been used in various fields including antiviral face masks, due to their incomparable durability and low manufacturing cost.1–3 Of more than 300 million metric tons of plastics produced annually, only a small fraction is recycled, 4 and mismanagement result in a significant amount of the plastic waste being targeted for disposal instead entering the natural environment.5,6 Plastics are typically composed of polymers such as polystyrene (PS), polyethylene, and polyethylene terephthalate.7–9 Plastics exposed to the environment are generally broken down into microplastic particles (< 5 mm) and further nanoplastic particles (NPs) (< 1 μm) through weathering processes.10,11 In karst regions, 6–15 microplastic particles/L have been detected, 8 whereas in the soil the amount is in the range of 67–253 microplastic particles per kg. 7 Direct evidence is scarce for nanoplastic concentrations in natural environments because of the analytical challenges. 12 However, a high prevalence of nanoplastics in natural environments has been proposed by recent weathering experiments. For example, while PS plastics are typically weak against heat and weathering, irradiation of ultraviolet light onto a 1 × 1 cm patch on a PS cup lid for 56 days produced 120 million NPs/mL. 13
Nanoplastics exposed to the subsurface environment are potentially toxic because of their small size and high surface reactivity, as they can penetrate cell membranes to cause genetic damage,14–18 impede feeding, survival, and fertility, and may be transferred to the next generation.19,20 Understanding the transport of nanoplastics in soils and groundwater is a prerequisite for an accurate assessment of their toxicity and for the development of management strategies. The transport of nanoplastics is likely dependent on minerals present along their transport paths because minerals are the major component in soils and groundwater aquifers and provide surfaces to which nanoplastics deposit. The interaction of nanoplastics with mineral surfaces has been examined using conventional column experiments,21,22 but there is a lack of research on the interactions with minerals other than quartz sands. In this study, we examine the interactions of nanoplastics with silica and alumina, the surface chemistry of which are electrostatically distinct from each other.
Recently, quartz crystal microbalance (QCM) has been applied to examine the interactions of nanoplastics with metal oxide surfaces,23–28 because the thin AT-cut piezoelectric quartz crystal sensor used in QCM has an extremely high sensitivity to nanoparticle adsorption and can be readily coated with various materials, such as organic matter and metal oxides. We investigate the deposition kinetics of PS-NPs to SiO2 and Al2O3 surfaces using QCM with variations in the ionic strength of the NP suspension, under which NPs are not aggregated but well dispersed. PS-NPs were selected as model nanoplastics because PS plastics are highly susceptible to decomposition into NPs. 29 The sizes of the NPs were determined by dynamic light scattering (DLS), and the morphology and distribution of PS-NPs deposited on the surface were characterized by scanning electron microscopy (SEM). The QCM data including initial deposition rates and mass were further analyzed using the Derjaguin–Landau–Verwey–Overbeek (DLVO) theory. Nanoplastics can deposit to the sensor surface via diffusion and gravitational sedimentation. We quantify the individual mechanism (diffusion and sedimentation) to the total deposition.
Materials and methods
A stock suspension of PS-NPs with a nominal size of 100 nm (Spherotech, Lake Forest, IL, USA) was sonicated for > 10 min to obtain a homogeneous suspension and then diluted to 0.05 g/L with NaCl. The ionic strength of groundwater usually ranges from 1 to 20 mM,27,28 although that of brine groundwater or near seawater can be as high as 500 mM. 30 In the current study, 0.1, 1, 10, or 100 mM NaCl solutions were used to represent different PS-NP suspensions exposed to different ionic strengths. The pH of the suspensions was 7.0 ± 0.2, adjusted with 10 mM NaOH and HCl, as groundwater pH is usually neutral.31,32 Ultrapure water purified through an EXL-3 water purification system (VIVAGEN, Seongnam, Korea) was used in the experiment. The hydrodynamic diameters and zeta potentials of PS-NPs (0.05 g/L) were measured in triplicate using a Zetasizer Nano ZSP (Malvern, UK) and DLS at 25 °C. The morphology and arrangement of the PS-NPs deposited onto the QCM sensor surfaces were determined using a field-emission SEM with an acceleration voltage of 2 kV (JSM-7900F; JEOL, Tokyo, Japan).
The QCM experiments were performed using QCM with dissipation monitoring (Q-Sense Explorer, Biolin Scientific, Stockholm, Sweden) to evaluate the deposition kinetics of the PS-NPs. Before each measurement, the SiO2-coated sensor crystal (QSX 303, Biolin Scientific) was immersed in 2% sodium dodecyl sulfate (SDS) for 30 min, and the Al2O3-coated sensor crystal (QSX 309, Biolin Scientific) was immersed in ethanol and then sonicated for 15 min. The cleaned sensor crystals were rinsed with ultrapure water and dried with N2 gas. The flow chamber and tubing were also cleaned under a flowing 2% SDS solution and ultrapure water at a flow rate of 300 μL/min using a peristaltic pump, for 15 and 45 min, respectively. Then they were dried with N2 gas.
The QCM frequency shift (Δfn) is related to the increase or decrease of deposited mass (Δm), as described by the Sauerbrey equation,
33


The DLVO theory was used to interpret the QCM deposition kinetic data. Specifically, a Derjaguin approximation model was used,
35
which calculates the interaction energy between a spherical particle and planar surface. The interaction energy (Vtotal) is defined by the sum of the van der Waals energy (VVDW) and electrical double-layer energy (VEDL)
36
:


Results
Nanoplastic particle sizes and zeta potentials
The SEM images of the PS-NPs deposited on the SiO2 sensor showed that the particles were spherical, with the size ranging from 40–120 nm (Supplemental Figure S1). The average diameter of PS-NPs was 72 ± 12 nm (Figure 1(a)). According to the DLS measurement, however, the average size of the PS-NPs in 0.1 mM NaCl was 93 ± 27 nm (Supplemental Figure S2; Figure 1(b)). SEM mostly probes electron-rich parts of particles, whereas DLS yields particle sizes based on the diffusion of the particles in the fluid. Thus, SEM tends to underestimate particle sizes, and the hydrodynamic sizes measured by DLS are generally larger than the SEM-based values. 40 As the ionic strength increased, both the hydrodynamic particle size and zeta potential tended to increase (Figure 1(b) and (c)), due to the compressed electrical double layers of the PS-NPs.41,42 However, because ∼20 nm increase in the hydrodynamic particle size at high ionic strengths was only a fraction of the PS particle size (Figure 1(b)), the majority of the PS-NPs in suspension were considered to be well dispersed under the ionic strength range we examined. According to a recent experiment, the critical coagulation concentration of 50-nm-diameter PS particles in NaCl (pH 6) was over 200 mM, 23 a much higher concentration than those tested in this study, which supports our interpretation of the PS-NP suspensions used in this study.

(a) SEM images of the SiO2 surface deposition of PS-NPs at an ionic strength of 10 mM. (b) Hydrodynamic particle sizes and (c) zeta potentials of PS-NPs at different ionic strengths and pH 7. The zeta potentials of SiO2 and Al2O3 in (c) are from Gemez et al. 35 and Mui et al., 36 respectively. SEM: scanning electron microscopy; PS-NPs: polystyrene nanoplastic particles.
Deposition on the SiO2 surface
The deposition of PS-NPs on the SiO2-coated surface was negligible until the ionic strength reached 10 mM (Figures 2(a) and 3(a)). As shown in equation 1, the amount of shift in the QCM resonant frequency is proportional to the deposition mass of the adsorbates. There was no shift in the resonance frequency of PS-NPs in 0.1 mM NaCl, but the frequency slightly shifted, by −0.6 Hz and −1.2 Hz in 1 mM and 10 mM NaCl, respectively, which corresponded to a deposition mass of ∼10 ng/cm2 and 20 ng/cm2, respectively. At an ionic strength of 100 mM, the frequency shift reached −230 Hz, which corresponded to an average deposition mass of 3.7 ± 0.4 μg/cm2. SEM images show that deposited PS-NPs formed aggregates on the surface (Figure 4(a)). The slope of the initial QCM frequency shift during the deposition of PS-NPs provided kinetic information on the deposition. The deposition rate was negligible for PS-NPs in 0.1–10 mM NaCl because deposition was minimal, but it was 14.9 ± 2.9 Hz/min for PS-NPs in 100 mM, indicating an effect of ionic strength on PS-NP deposition to mineral surfaces. In the previous QCM experiment performed with 50-nm-diameter PS particles, the deposition rate to the silica surface in 100mM NaCl (pH 6) was approximately 10 Hz/min. 23

Resonance frequency shifts of a QCM determined during the deposition of PS-NPs onto (a) SiO2- and (b) Al2O3-coated sensor surfaces at different ionic strengths of the NPs suspension. QCM: quartz crystal microbalance; PS-NPs: polystyrene nanoplastic particles.
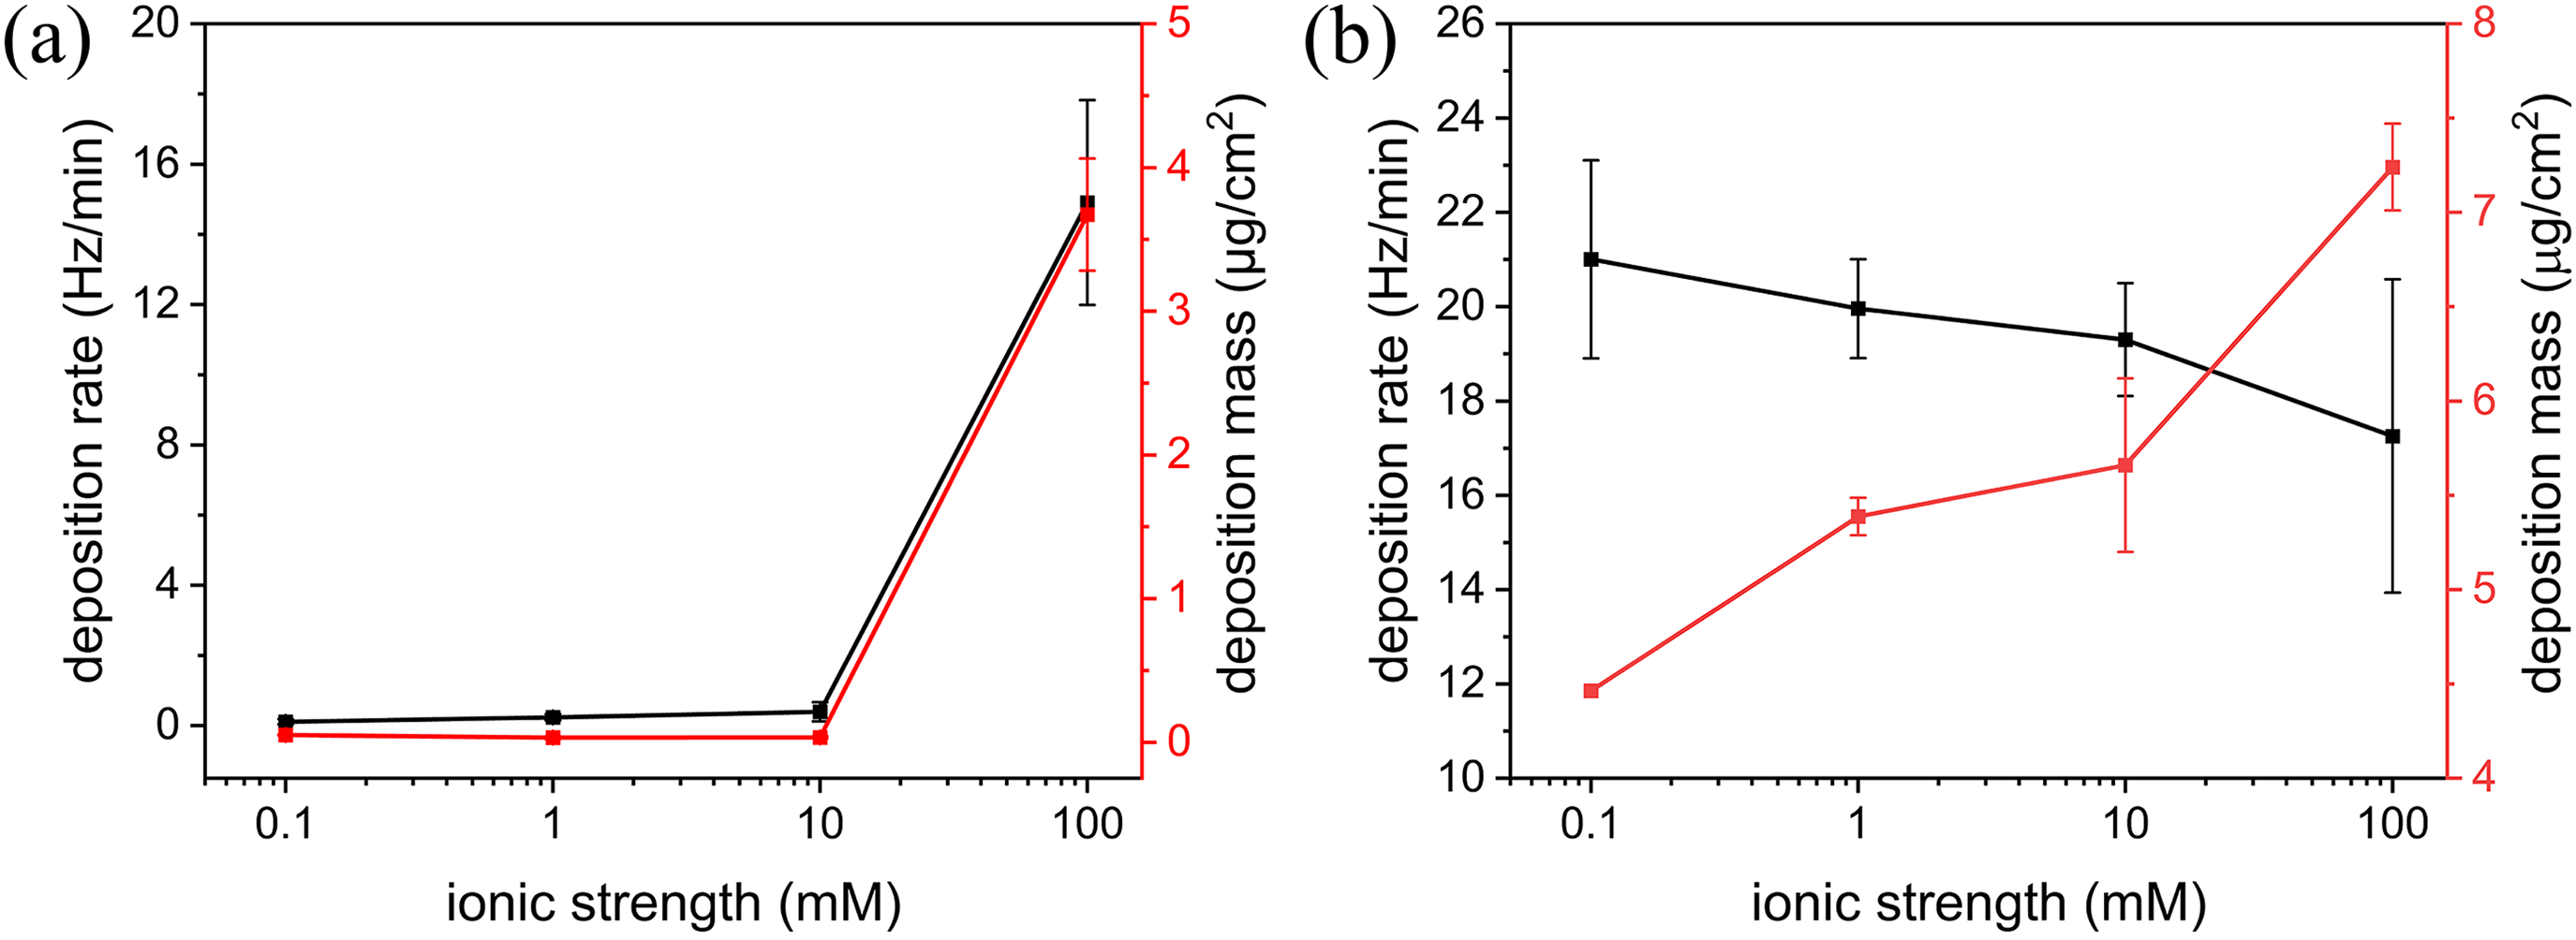
Deposition rates (black) and masses (red) of PS-NPs as a function of ionic strength on (a) SiO2- and (b) Al2O3-coated QCM sensor surfaces. QCM: quartz crystal microbalance; PS-NPs: polystyrene nanoplastic particles.

SEM images of PS-NP suspension at an ionic strength of 100 mM deposited onto (a) SiO2 surface and (b) Al2O3 surface. SEM: scanning electron microscopy; PS-NPs: polystyrene nanoplastic particles.
Deposition on the Al2O3 surface
Figure 2(b) shows the QCM results of PS-NPs deposition on the Al2O3-coated surface. In contrast to the SiO2 surface, there was a notable frequency shift (–255 Hz) at the lowest ionic strength (0.1 mM), which resulted in a deposition mass of 4.5 ± 0.8 μg/cm2. The frequency shift increased with increasing ionic strength, with the deposition mass reaching 7.2 ± 0.2 μg/cm2 for PS-NPs in 100 mM NaCl. Examination of the SEM images demonstrated the much greater deposition of PS-NPs on the Al2O3-coated surface than on the SiO2-coated surface (Figure 4). However, the deposition rate tended to decrease with increasing ionic strength (Figure 3(b)), contrary to the deposition rate of PS-NPs on the SiO2 surface (Figure 3(a)). As the ionic strength increased from 0.1 to 100 mM, the deposition rate decreased from 21.1 ± 2.1 to 17.3 ± 3.3 Hz/min. In the QCM experiment with 50-nm-diameter PS particles, the deposition rate to alumina surface in 100 mM NaCl (pH 6) was approximately 15 Hz/min. 23
Discussion
Diffusion-driven deposition
The deposition of NPs on the sensor surface of a QCM occurs via diffusion and gravitational sedimentation. In this study, the relative contributions of those processes to NP deposition were evaluated following an inverted-measurement QCM protocol,
34
in which deposition efficiencies are measured with the QCM chamber turned upside-down (Figure 5). In normal mode, the NP suspension flows through over the QCM sensor crystal, whereas in inverted mode, it flows beneath the QCM crystal such that gravity interferes with the deposition of the NPs to the sensor crystal. The deposition efficiencies (η) of normal and inverted modes can be written as

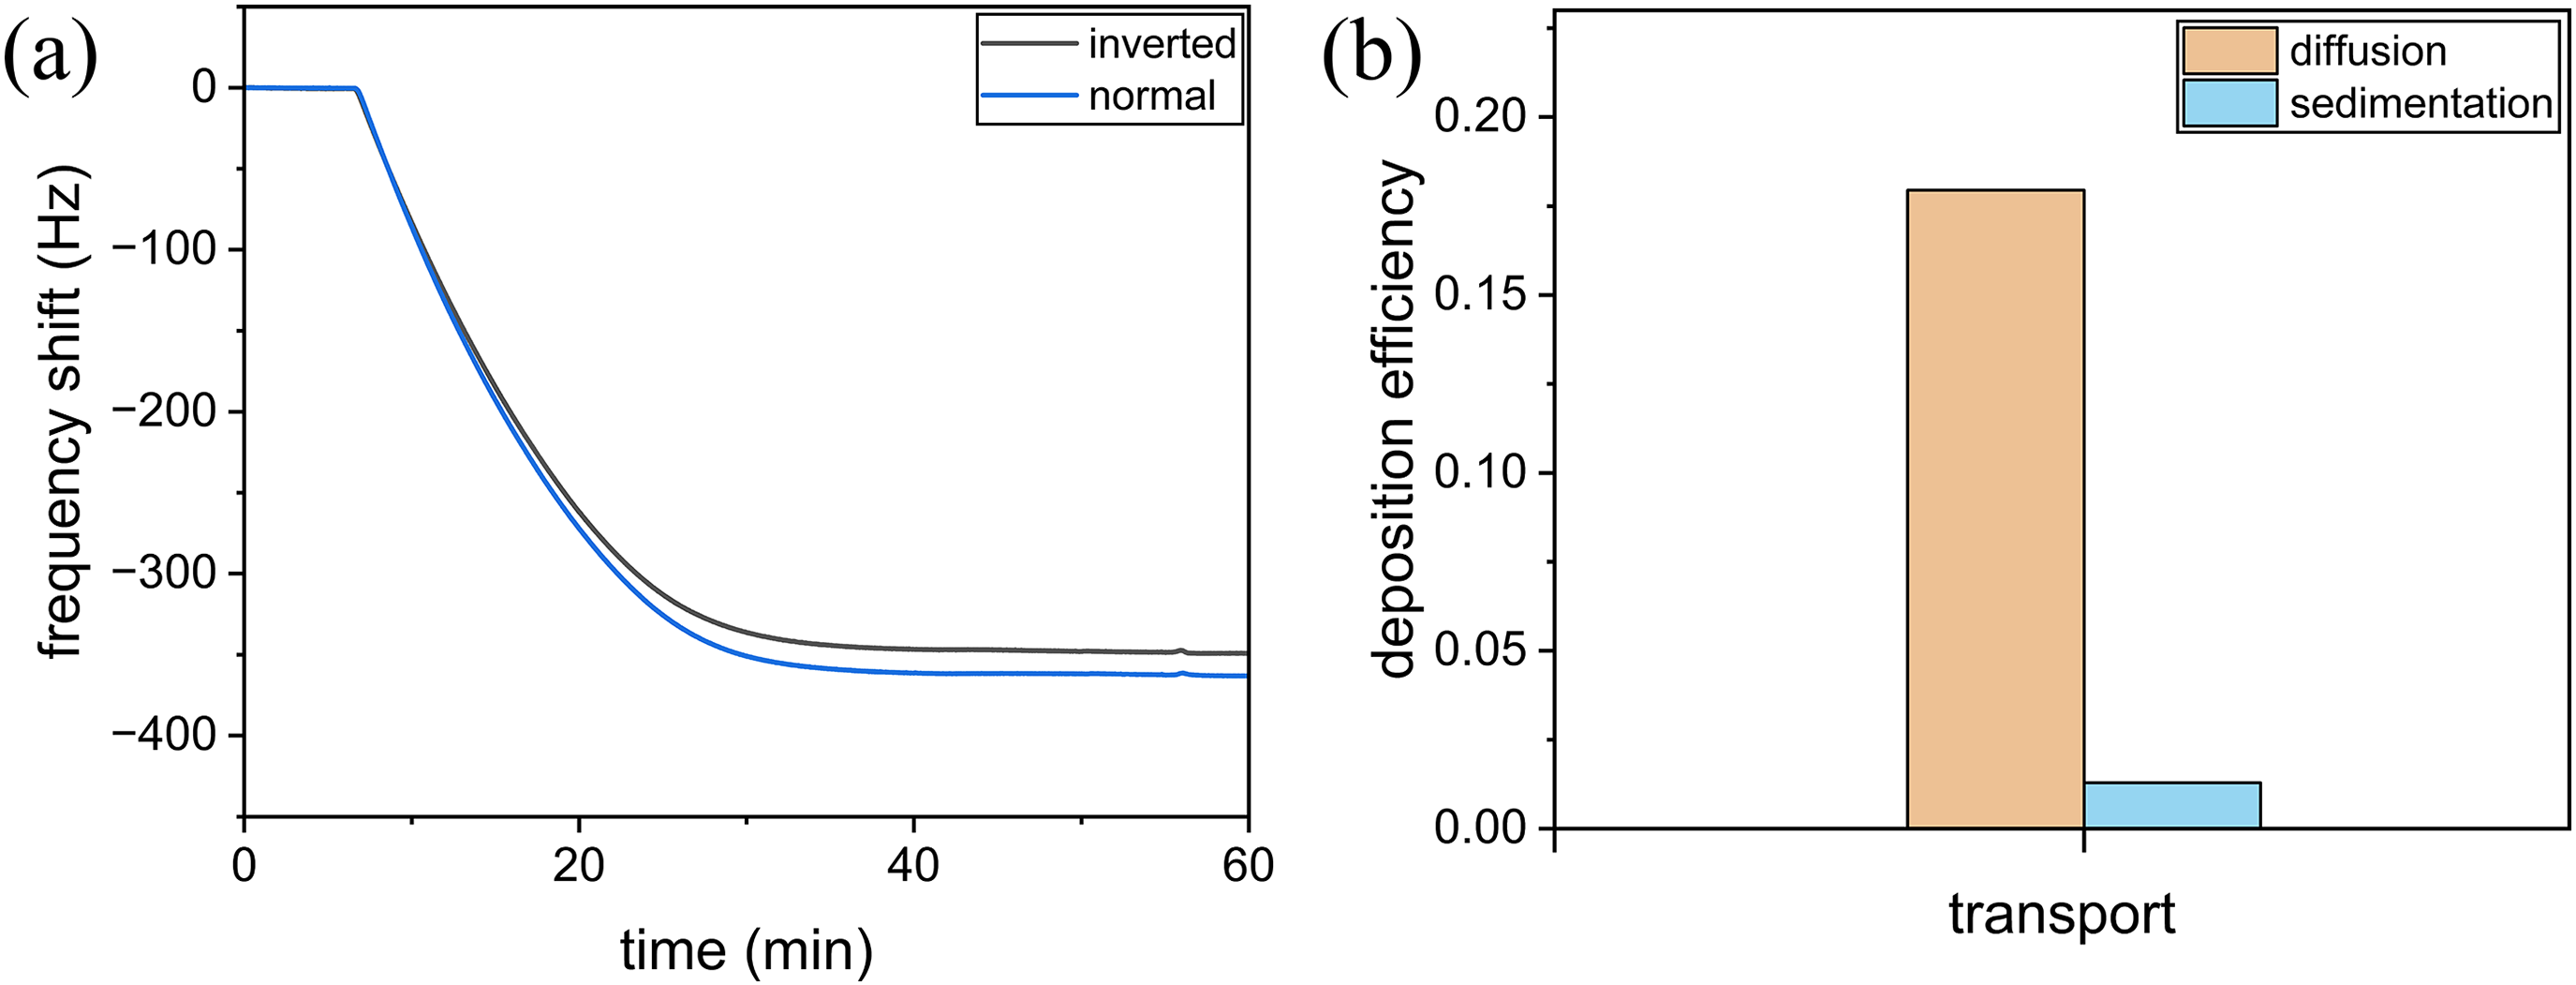
(a) Resonance frequency shifts of QCM during the deposition of PS-NPs onto Al2O3 surface measured in a QCM normal or inverted mode and (b) deposition efficiencies of PS-NPs deposited via diffusion or sedimentation. QCM: quartz crystal microbalance; PS-NPs: polystyrene nanoplastic particles.
The deposition efficiencies attributable to diffusion and sedimentation were 0.18 and 0.01, respectively (Figure 5(b)). The contribution of sedimentation to NP deposition on the surface of the sensors in the QCM experiments was small compared to the diffusion contribution. This result is consistent with a previous study in which diffusion, rather than sedimentation, was mainly responsible for the deposition of silica nanoparticles in QCM. 34 Our results indicated that the kinetic data on nanoplastic deposition obtained in this study represented diffusion through the Brownian motion of the NPs as well as the electrostatic interactions of the particles with the oxide surfaces.
Kinetics of PS-NP deposition on the SiO2 surface
The deposition rate and mass of PS-NPs in 0.1–10 mM NaCl suspension on the SiO2 surface were negligible but both increased for PS-NPs in the 100 mM NaCl suspension (Figure 3(a)). Because the zeta potentials of the PS-NPs and the SiO2 surface were both negative (Figure 1(c)), SiO2 was an unfavorable surface for PS-NP deposition. However, the zeta potentials of the particles and the SiO2 surface were less negative at high than low ionic strength (Figure 1(c)), such that the appreciable adsorption of PS-NPs at high ionic strength can be attributed to a reduced repulsive force between the particles and the SiO2 surface. This ionic-strength-dependent deposition can be explained by the DLVO interaction energy profiles.21,38,43–45 Figure 6(b) shows the presence of a high energy barrier to PS-NP deposition on the SiO2 surface, as expected from their zeta potentials. The high energy barriers at low ionic strengths prevented deposition at the primary energy minima, whereas at high ionic strength the energy barrier was significantly lower (+431 kBT in 0.1 mM vs. +7 kBT in 100 mM), such that the probability that it could be overcome by the PS-NPs was high, which would have resulted in deposition on the SiO2 surface, assuming sufficient flow rates. In addition, a secondary minimum formed at higher ionic strengths and especially at an ionic strength of 100 mM (–2.7 kBT), enabling a faster rate of deposition (Figure 3(a)).

Derjaguin–Landau–Verwey–Overbeek interaction energies (a) between PS-NPs, (b) between PS-NP and the SiO2 surface, and (c) between polystyrene nanoplastic particle (PS-NP) and the Al2O3 surface at different ionic strengths. The insets in (a) and (b) detail the presence of attractive interactions at high ionic strengths.
The DLVO energy profiles of the PS-NPs themselves were similar to those between the PS-NPs and the SiO2 surface (Figure 6(a) and (b)). As the ionic strength increased, the energy barrier between the PS-NPs decreased from +460 kBT to +10 kBT, with the appearance of a secondary minimum (–2.7 kBT) at a separation distance of 5 nm. The lowered energy barrier could not be overcome by the PS-NPs through the kinetic energy of their Brownian motion in suspension alone. The DLS analysis indicated only fractional aggregation and that most of the PS-NPs were well dispersed in the suspensions, within the range of tested ionic strengths (Figure 1(b)). The slight increase in the hydrodynamic size can be attributed to the formation of secondary energy minima at high ionic strength (Figure 6(a)). However, the PS-NPs in ionic strength suspensions of 100 mM became highly aggregated when deposited on the SiO2 surface, with aggregate sizes of 200–600 nm measured from the SEM image (Figure 4(a)). Thus, at high ionic strength, the PS-NPs in the QCM experiment readily overcame the energy barrier to self-aggregate. Sufficient flow rates and fluctuations in the internal energy of the PS-NPs trapped at the secondary minimum (Figure 6(a)) may have provided enough kinetic energy for the particles to overcome the energy barrier required for surface deposition (Figure 6(b)). 21 The deposited particles may have concurrently reduced the electrical double-layer repulsion between PS particles such that it was lower than the repulsion in suspension, resulting in a lower energy barrier. 46 However, the energy barrier change could not be calculated from the pair-potential-based DLVO interaction model used in this study. More sophisticated models 46 are required to account for the many-body effects on the two particles.
Kinetics of PS-NP deposition on the Al2O3 surface
Significant deposition of the PS-NPs on the Al2O3 surface occurred at all ionic strengths. This is because the zeta potential of the PS-NPs was negative but that of the Al2O3 surface was positive (Figure 1(c)), consistent with the presence of attractive, but not repulsive, forces in the DLVO energy profiles (Figure 6(c)). As the ionic strength of the suspension increased, the deposition rate decreased (Figure 3(b)), attributable to a corresponding reduction in the strength of the attractive forces between the PS-NPs and the surface (Figure 6(c)). The separation distance between the PS-NPs and the surface at which their attractive interaction became predominant decreased with increasing ionic strength. Thus, the surface deposition of PS-NPs at higher ionic strength required closer contact between the particle and the surface than was the case at low ionic strengths (i.e. slower deposition rates). Whereas the deposition rate decreased with increasing ionic strength, the deposition mass increased instead (Figures 3(b) and 4(b)). The increase in the deposition mass can’t be rationalized with the DLVO theory based on pair interactions. Sufficient flow rates may have led to PS-NP aggregation at high ionic strengths, and particles deposited on the oppositely charged Al2O3 may have also lowered the electrical repulsion of the PS-NPs, resulting in a high deposition mass.
Insights into the transport of nanoplastics
Understanding the interactions of NPs with mineral surfaces is critical to monitoring and predicting NP transport in the subsurface environment. Our QCM results show that PS-NPs preferentially deposit to Al2O3 over SiO2 surfaces, because of the electrostatic attraction by unlike-charged surfaces. Significant deposition of NPs on the SiO2 surface occurred only at high ionic strengths (∼10 ng/cm2 at < 100 mM; 3.7 ± 0.4 μg/cm2 at 100 mM), such that SiO2 may play an important role in NP transport in the areas such as surface water sites with an elevated ionic strength. Although SiO2 is a major mineral phase and Al2O3 is a minor phase constituting soils and groundwater aquifers, alumina or iron oxides most likely exert a stronger influence than quartz on NPs, as they would promote a higher deposition capacity. At the ionic strength of 100 mM, the deposition rates of NPs were similar between SiO2 and Al2O3 surfaces (10–15 Hz/min), but the deposition mass on Al2O3 surface was about twice larger than that on SiO2 surface (7.2 vs. 3.7 μg/cm2). These results can serve as validation data in developing NP transport models in subsurface environments. Mineral surfaces present in soils and groundwater aquifers are typically coated with organic matter. Because organic matter can also provide adsorption sites to nanoplastics, the effect of organic matter on the nanoplastic deposition kinetics is an important topic to investigate for future research.
Supplemental Material
sj-docx-1-sci-10.1177_00368504221150430 - Supplemental material for Kinetics of polystyrene nanoplastic deposition on SiO2 and Al2O3 surfaces: Ionic strength effects
Supplemental material, sj-docx-1-sci-10.1177_00368504221150430 for Kinetics of polystyrene nanoplastic deposition on SiO2 and Al2O3 surfaces: Ionic strength effects by Hyeonah Myeong, Juhyeok Kim, Jin-Yong Lee and Kideok D. Kwon in Science Progress
Footnotes
Declaration of conflicting interests
The author(s) declared no potential conflicts of interest with respect to the research, authorship, and/or publication of this article.
Funding
This work was supported by the Korea Environment Industry & Technology Institute (KEITI) through the Management of Microplastics Program, funded by Korea Ministry of Environment (MOE), Korea Environment Industry Technology Institute (grant number 2020003110010).
Supplemental material
Supplemental material for this article is available online.
Author biographies
Hyeonah Myeong holds an MSc degree in Geology.
Juhyeok Kim is a PhD student in Geology.
Jin-Yong Lee is a Professor in Hydrology. His area of research focuses on microplastics in soil and groundwater.
Kideok D. Kwon is a Professor in Mineralogy. His area of research is water-rock interaction focusing on a molecular scale understanding.
References
Supplementary Material
Please find the following supplemental material available below.
For Open Access articles published under a Creative Commons License, all supplemental material carries the same license as the article it is associated with.
For non-Open Access articles published, all supplemental material carries a non-exclusive license, and permission requests for re-use of supplemental material or any part of supplemental material shall be sent directly to the copyright owner as specified in the copyright notice associated with the article.