
Abstract
Identifying new therapeutic indications for existing drugs is a major challenge in drug repositioning. Most computational drug repositioning methods focus on known targets. Analyzing multiple aspects of various protein associations provides an opportunity to discover underlying drug-associated proteins that can be used to improve the performance of the drug repositioning approaches. In this study, machine learning models were developed based on the similarities of diversified biological features, including protein interaction, topological network, sequence alignment, and biological function to predict protein pairs associating with the same drugs. The crucial set of features was identified, and the high performances of protein pair predictions were achieved with an area under the curve (AUC) value of more than 93%. Based on drug chemical structures, the drug similarity levels of the promising protein pairs were used to quantify the inferred drug-associated proteins. Furthermore, these proteins were employed to establish an augmented drug-protein matrix to enhance the efficiency of three existing drug repositioning techniques: a similarity constrained matrix factorization for the drug-disease associations (SCMFDD), an ensemble meta-paths and singular value decomposition (EMP-SVD) model, and a topology similarity and singular value decomposition (TS-SVD) technique. The results showed that the augmented matrix helped to improve the performance up to 4% more in comparison to the original matrix for SCMFDD and EMP-SVD, and about 1% more for TS-SVD. In summary, inferring new protein pairs related to the same drugs increase the opportunity to reveal missing drug-associated proteins that are important for drug development via the drug repositioning technique.
Keywords
Introduction
The similarities among proteins have been applied to many bioinformatics fields, including drug repositioning. 1 The indication of a drug can be repurposed to treat another disease by targeting other similar target proteins. 2 However, there are no gold standard features to identify the similarities among proteins to repurpose the use of drugs. Therefore, investigating various features to describe proteins sharing common drugs can be beneficial in a drug repositioning technique.
Drug repositioning, also known as drug repurposing, is a technique for using existing drugs for new indications.3,4 In principle, the procedure of drug discovery involves i) screening and searching for the compounds associated with the disease in the laboratory, ii) confirmation of safety for indication uses, iii) clinical research phase I, iv) clinical research phase II, v) clinical research phase III to finally confirm the drug usage on people, vi) approval of the drug by Food and Drug Administration (FDA) reviews, and vii) FDA post-market safety to ensure public availability of the drug. 5 As the chemical structures of existing drugs are already known and these drugs are safe for humans, finding new indications of existing drugs can reduce the cost, resources, and time required to find a new drug to treat disease. 4 For example, Pfizer discovered Sildenafil for curing coronary artery disease. This drug has also been known as Viagra since 1989 6 whose usage is repurposed to treat erectile dysfunction by increasing blood flow to the penis.7,8
In drug repositioning, the identification of drug-disease associations is the first step to screen common existing drugs to cure various diseases. However, the in vitro experiments for identifying drug-disease associations are time intensive and costly. Therefore, the computational approaches of drug repositioning to predict novel drug-disease associations have become an important task. 9 One of the most important steps to infer new associations is the way to define common middle information that might be related or linked to both drugs and diseases. This common link can be a protein that is related to a certain drug or disease. Drug-protein associations play an important role in the identification of drug-disease associations. Drug-protein associations represent the binding between drugs and proteins to utilize poly-pharmacology concepts such as chemical substructures, pharmacophore functional sites, and pathways. 10 The identification of possible drug-protein target interactions is a vital procedure in accelerating drug development and drug design; particularly, in drug repositioning, since it reduces the number of chemical compounds that potentially bind to potential targets.11,12 The associations between drugs and protein targets play an important role to disclose the functions and chemical structures of pharmaceutically protein targets such as enzymes, ion channels, G-protein-coupled receptors (GPCRs), and nuclear receptors including structure similarity and sequence similarity between drugs and their targets. 13 The computational technique for drug repositioning is effective in predicting and guiding that an existing drug can be used to cure other diseases as well as to treat drug-resistant cases. Zhang et al. proposed the computational model of a similarity constrained matrix factorization for the drug-disease associations (SCMFDD) based on known drug-disease associations from a curated database, drug features, and disease semantic descriptors. 9 Protein target was utilized to account for computing drug-drug similarities features including substructures, enzymes, pathways, and drug-drug interactions while disease semantic information was calculated from MeSH information.
Several computational models have been developed for drug repositioning based on the similarities among target proteins. These techniques are established based on a similarity scheme, called guilt-by-association, 14 which can be expressed in many ways to define the similarities between two drugs and among the target proteins, including disease proteins. The similarity scheme is applied to predict drug-target interactions to support the drug repositioning approach.15–17 Gottlieb et al. proposed the PREDICT method to predict drug-disease indications based on the similarity of the drugs that are used to cure similar diseases. 1 This method combines the two schemes of the drug similarities and disease similarities. In the case of a drug similarities scheme, the authors investigated the information regarding protein-protein interaction (PPI) data, gene ontology, sequence alignment, and phenotypes from target-related drugs. Afterward, they ensembled the two similarity schemes using geometric means to represent the maximum similarity score for each candidate drug-disease pair. They obtained an area under the curve (AUC) of 0.92 for predicting drug indications. Zhang et al. introduced the Similarity-based LArge-margin learning of Multiple Sources (SLAMS) method based on the multiple data sources of a drug's chemical structures, protein targets and side-effect profiles to retrieve novel drugs for diseases. 2 The SLAMS method integrates various similarity-based features of drugs and protein targets, which can play an important role in the drug design, and are related to therapeutic use for helping in the drug repositioning model. With the same integrated multiple data sources, the SLAMS method achieved an AUC of 0.89, while the PREDICT method achieved an AUC of 0.87. Khalid et al. proposed the similarity scheme that predicts approved and novel drug targets with new disease associations (SPANTD) method, 7 which reveals various interesting features that can be combined into a scoring matrix. These features include similarity among proteins, similarity among proteins’ module pathways in the biological function, the pairwise binding site's structural similarity among proteins, and disease-disease similarity. The authors combined all similarity features with a scoring matrix for drug disease associations. Later, they applied a genetic algorithm to compute the scoring matrix and then predicted the drug-disease association. The SPANTD method achieved an AUC of 0.97 to predict candidate drug-disease associations.
Network-based methods have been successfully used for predicting several tasks, including disease-disease association predictions, 18 disease protein association predictions,19–25 and drug-disease association predictions.26,27 Several computational drug repositioning approaches focus on a heterogeneous network of different types of nodes such as drugs, proteins, and diseases. Wu et al. proposed the ensemble meta-paths and singular value decomposition (EMP-SVD) model, which generates five meta-paths, and constructed the latent features of drugs and diseases using the singular value decomposition (SVD) technique. 28 They investigated the reliable negative, which is the set of drugs that cannot treat diseases. Then, for each meta-path, they employed a random forest algorithm to construct a classifier corresponding to each path. All five classifiers were ensembled to predict candidate drugs for new indications. Moreover, the EMP-SVD method was improved to a new version called topology similarity and singular value decomposition (TS-SVD). 29 This method integrates the common neighbors count matrices of drugs and diseases constructed based on a heterogeneous network to achieve topological similarity matrices of drugs and diseases. After that, the dimension of the topological similarity matrix of drug and disease was reduced using SVD to represent drug-disease pairs. Then, the authors employed a random forest classifier to predict potential drug-disease associations based on the reliable negative, which is defined by the k-step neighbors among drugs and diseases. Both the EMP-SVD and TS-SVD models were generated based on proteins, which were presented as the middle nodes to link drugs and diseases in a heterogeneous network. Another technique that utilized the function of proteins or gene ontology (GO) profiles as the middle nodes to link drugs and diseases in the tripartite network, called meta-path-based gene ontology profiles for predicting drug-disease associations (MGP-DDA), was proposed. 26 The MGP-DDA model integrates a meta-path based on GO terms to construct a drug repositioning model.
Recently, the protein-protein similarity vectors (PPSVs) technique has been proposed to develop drug repositioning based on the multi-data aspects of protein similarity, such as network topology, proteomic data, functional analysis, and druggable property to determine the associations between proteins and their approved drug. 27 The PPSVs exploited the manner of separating the drug-disease matrix for individual diseases to emphasize the potential drugs that can treat a specific disease. Then, the random forest classifier was applied to predict candidate drug-disease associations. The PPSVs achieved an AUC of 98.9%. As several previous studies have used the scheme of similarities among target proteins to predict drug-disease pairs, the similarity of protein interactions might also be crucial to explain the common drugs among the target proteins.
In this study, the relationship among drug-associated proteins based on several biological aspects is applied to drug repositioning approaches. The similarities of protein pairs that are related to the same drugs can play a potential role in the drug repositioning technique. The prediction of the associated proteins sharing the same drugs is performed by a machine learning technique, and the prediction results are used to create an augmented drug-protein matrix that enhances the efficiency of existing drug repositioning models. Section 2 characterizes the proposed method for investigating protein pairs that share the same drugs and the process of achieving an augmented drug-protein matrix. Section 3 demonstrates the performance of predicting protein pairs associating the same drugs. This section also compares the performances of the original drug-protein and the augmented drug-protein matrices when subjected to drug repositioning approaches. Section 4 discusses the results. Section 5 concludes the study and presents future work.
Materials and methods
The overview of this study is summarized in five steps, as shown in Figure 1. First, data on drugs, diseases, gene ontologies, protein interactions, and drug-disease interactions are collected based on several published databases. Second, feature analysis is performed by feature selection in different biological meanings categorized into four groups: (1) protein interactions, (2) topological network, (3) sequence alignment, and (4) similarity of functions among proteins. Third, the prediction process is established from ensemble random forest classifiers. Fourth, an augmented drug-protein matrix is inferred based on the target protein prediction. Finally, the drug-disease associations were predicted using the existing drug repositioning models with the augmented drug-protein matrices.

Overview of this study.
Dataset
The human (Homo sapiens) proteins were fetched from the Search Tool for the Retrieval of Interacting Genes/Proteins (STRING v.11) database. 30 The ensemble protein IDs in STRING were converted to protein symbols by using the Universal Protein Resource (Uniprot) database. 31 This mapping resulted in 3,591,273 interactions of human proteins. The DrugBank database was employed to identify the approved drugs and their target proteins as well as their genes. 32 Only the published evidence of the approved drugs and their target proteins was considered from the DrugBank database.
The human protein pairs having common approved drugs were assigned as positive labels. Otherwise, the protein pairs were assigned negative labels. In total, we obtained 27,683 and 3,563,590 human protein pairs for the positive and negative labels, respectively. The protein sequences were retrieved from uniprot.org by protein symbols using the getUniProt in the R language. 33 The level modules for understanding functions in biological systems were obtained from the Kyoto Encyclopedia of Genes and Genomes (KEGG) database.34–36 GO annotation was achieved from the Gene Ontology Annotation (GOA) database. 37 The computational drug similarity was retrieved from DD.chem.data, represented in the bionetdata package v1.0.1 of R language.38,39 The DD.chem.data provides the scoring matrix, which represents the chemical structure similarity among the approved drugs from the DrugBank database. The scoring matrix contains the real value, where zero represents a completely different chemical structure between drugs, and one means an identical chemical structure between drugs.
In drug repositioning approaches, information on drug-disease interactions was extracted from the Comparative Toxicogenomics Database (CTD). 40 Moreover, the set of genes or proteins that interact with diseases originated from a database of gene-disease associations (DisGeNET). 41
Features analysis
We observed similarity among proteins in several biological aspects categorized into four different groups: PPI, topological network, sequence alignment, and biological functions. We obtained a total of 13 features, as described below:
PPI data
Seven features of protein interactions were retrieved from the STRING v.11 database.
30
Conserved neighborhood: This is the inter-gene nucleotide counting that occurs repeatedly in a close neighborhood of genomes. Fusion: The score is obtained from individual gene-fused events in other species. Co-occurrence: This is derived from the presence or absence of similar patterns of genes in the phylogenetic profile. Co-expression: The score is computed from similar patterns of mRNA expression levels in the same or other species. Experiments: This is the list of significant protein interactions obtained from affinity chromatography. Databases: The score is derived from various curated databases. Text mining: This is computed from the co-occurrence of genes or protein names in the abstract of scientific literature.
Topological network data
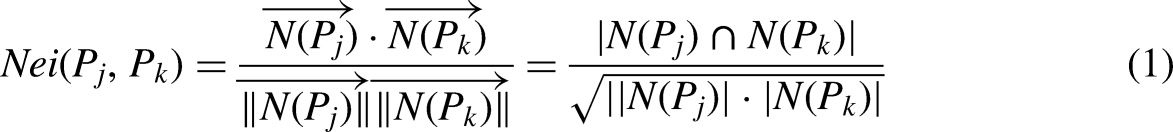
To extract topological network data, a PPI network model was constructed by retrieving protein interactions from the STRING database. Only interactions with high confidence scores (more than 800) were selected. Then, a weighted adjacency matrix of this was used to calculate two topological features which were common neighbors and closer proteins as follows.
Common neighbors: The common neighbor score, Closer proteins: The closer protein score,

Sequence alignment data
The similarity of proteins’ sequences regions was identified. The similarity between the two sequences can conserve the structure, function, or evolution of these proteins.
42
Two approaches, local and global alignments, were used to identify similarities.
Local alignment: The local alignment score represents the alignment of the most similar regions between the two protein sequences. The local alignment method employs BLOSUM62 for the substitution matrix. The gap opening is assigned a value of 10, while the gap extension is assigned 0.5. Global alignment: The global alignment score represents the alignment of similarities in the whole sequences of any two proteins. The global alignment parameter is the same substitution matrix as that used in the local alignment approach.
Biological function data
The biological functions between proteins in terms of the similarity of modules, including GO domains, were integrated. The common modules and GO are detailed as below.
Common modules: The common module, GO: The gene ontology,


This study attempted to collect several related biological features for protein pairs. All biological features were rescaled to standard values between zero and one. However, some of these features might be irrelevant to classifying protein pairs that share common drugs. To verify the features, a feature selection technique was employed to retrieve the crucial features for prediction. These are detailed as follows:
Forward selection: This method starts with no feature and then continues adding the most relevant feature which improves the performance value of the AUC score. The method repeatedly adds the feature until the added feature can no longer improve the performance value.
Predicting protein pairs associated with the same drugs
This study employed a random forest classifier to predict protein pairs sharing the same drugs. A grid search technique was utilized to identify the best hyperparameters in the forest The parameters were set in increments of 50 from 50 to 300 for the number of trees and were set as the square root of the number of features to examine the best split. The vector of label classes is assigned as a binary vector, in which one represents a positive label (protein pairs that have common approved drugs) and zero represents a negative label.
The framework for determining crucial features is illustrated in Figure 2. First, the data of protein pairs are randomly split, with 20% for a test set and the remaining for a training set. To split the protein pairs data into a training set and a test set, the proportion of positive and negative labels remains with the same proportion in the protein pair data. Second, the negative labels are randomly selected to obtain the balance data between the positive and negative labels for both a training set and a test set. Third, the protein pairs in the training set are randomly split, with 80% for generating a random forest classifier based on a forward selection and 20% for validating the performance of forward selection. Fourth, 20% of the test set is applied to evaluate the performance of the optimal feature model in one experiment. Later, all four steps above are repeated in 10 experiments to prevent bias from randomly splitting the data. After that, 10 optimal feature sets are obtained from 10 experiments. Then, all 10 optimal feature sets are voted to achieve crucial features. Next, the crucial features are applied to a random forest model to predict protein pairs sharing common drugs. The protein pair data are randomly split, with 20% for a test set and the remaining for a training set. A random forest model with crucial features obtained from the training set was generated. The performance of the model was evaluated on the test set. These training and testing processes were performed for five iterations, and the average performance was evaluated. Finally, the protein pairs with an average score exceeding 0.5 were inferred to share common drugs.
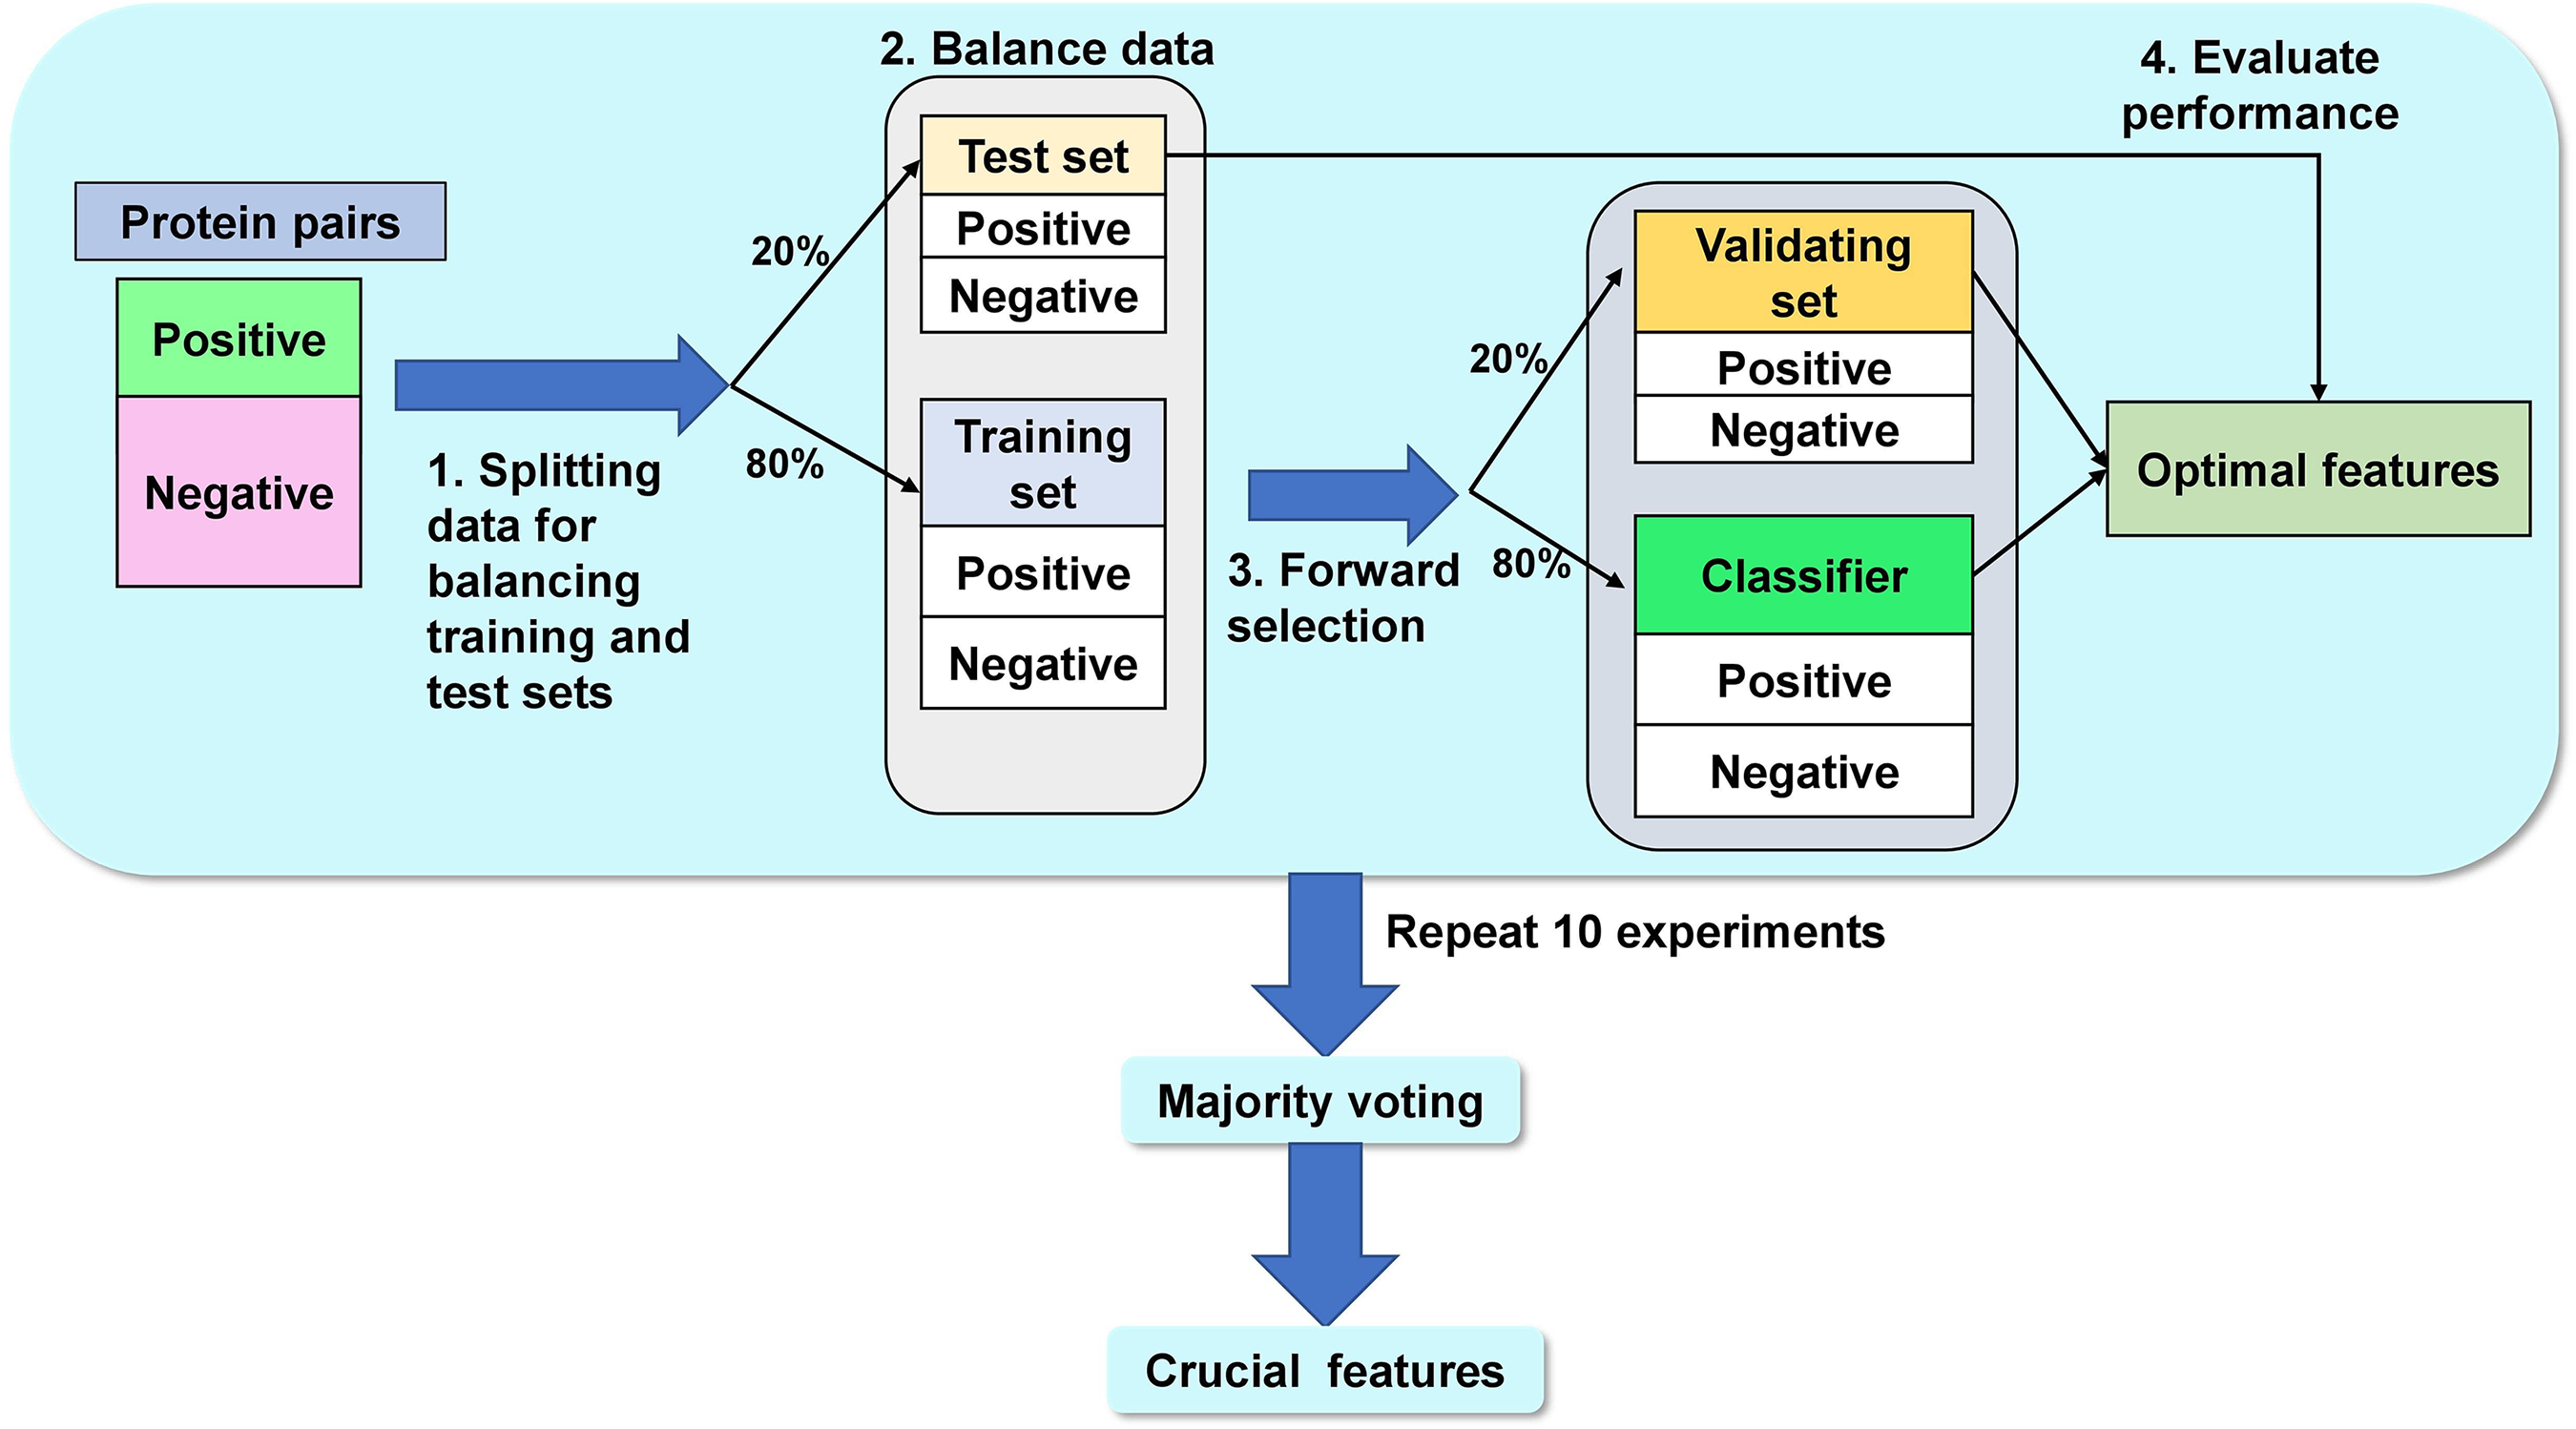
Framework to achieve crucial features.
Generating an augmented drug-protein matrix
This study focuses on drug-protein associations to reinforce the performance of the existing drug repositioning approaches such as EMP-SVD and TS-SVD. The protein pairs predicted to share common drugs were employed to augment the drug-protein matrix used in the approaches. The EMP-SVD and TS-SVD methods were used based on a heterogeneous network with three node types: drugs, proteins, and diseases. The edges represent interactions between nodes, including drug-protein, drug-disease, and protein-disease interactions. The data on approved drug-protein interactions were insufficient. Therefore, the prediction of protein pairs sharing common drugs was applied to generate an augmented drug-protein matrix (

Evaluating performance
In this study, evaluation metrics of classification performance include AUC, accuracy, precision, sensitivity, F1, and area under precision-recall curve (AUPR) scores. The performance scores can be explained as follows.
The AUC value is the area under the curve of the receiver operating characteristic (ROC) which is plotted between sensitivity


The accuracy (


Results
This section demonstrates the performance outcomes of predicting protein pairs that might have common drugs based on crucial features. Moreover, the analysis of drugs’ similarities between protein pairs is considered. In addition, we apply the protein pairs that might have common drugs to generate an augmented drug-protein matrix to enhance the performance of the EMP-SVD, an existing drug repositioning approach.
Identification of optimal features to classify protein pairs sharing common drugs
To obtain significant features for identifying protein pairs sharing common drugs, we employed a forward selection technique to determine the crucial features. This technique starts adding the most relevant features for prediction and then adds the other relevant feature. These processes are performed continuously in each step until the algorithm cannot find any features that can improve performance. In our experiments, we used AUC as our performance measure. We performed overall 10 experiments to obtain the set of optimal features. All procedures are shown in Figure 3. Local alignment was used as an initial feature in all 10 experiments; the results showed an AUC greater than 0.93. To perform the majority votes, we observed whether a feature was visible in all sets of optimal features. Interestingly, the fusion feature was found in only three sets of optimal features. The database and co-occurrence features were found in seven and eight sets of optimal features, respectively. The remaining features were found in all 10 sets of optimal features, respectively. Therefore, we discarded only the fusion feature. The results are shown in Figure 4. Finally, we obtained 12 optimal features: (1) local alignment, (2) GO, (3) experiments, (4) common modules, (5) text mining, (6) global alignment, (7) co-expression, (8) common neighbors, (9) conserved neighborhood, (10) closer proteins, (11) databases, and (12) co-occurrence. These crucial features were used by the random forest classifiers to predict protein pairs sharing common drugs. The optimal features in each experiment, as well as their performance values, are shown in Supplementary Table S1.
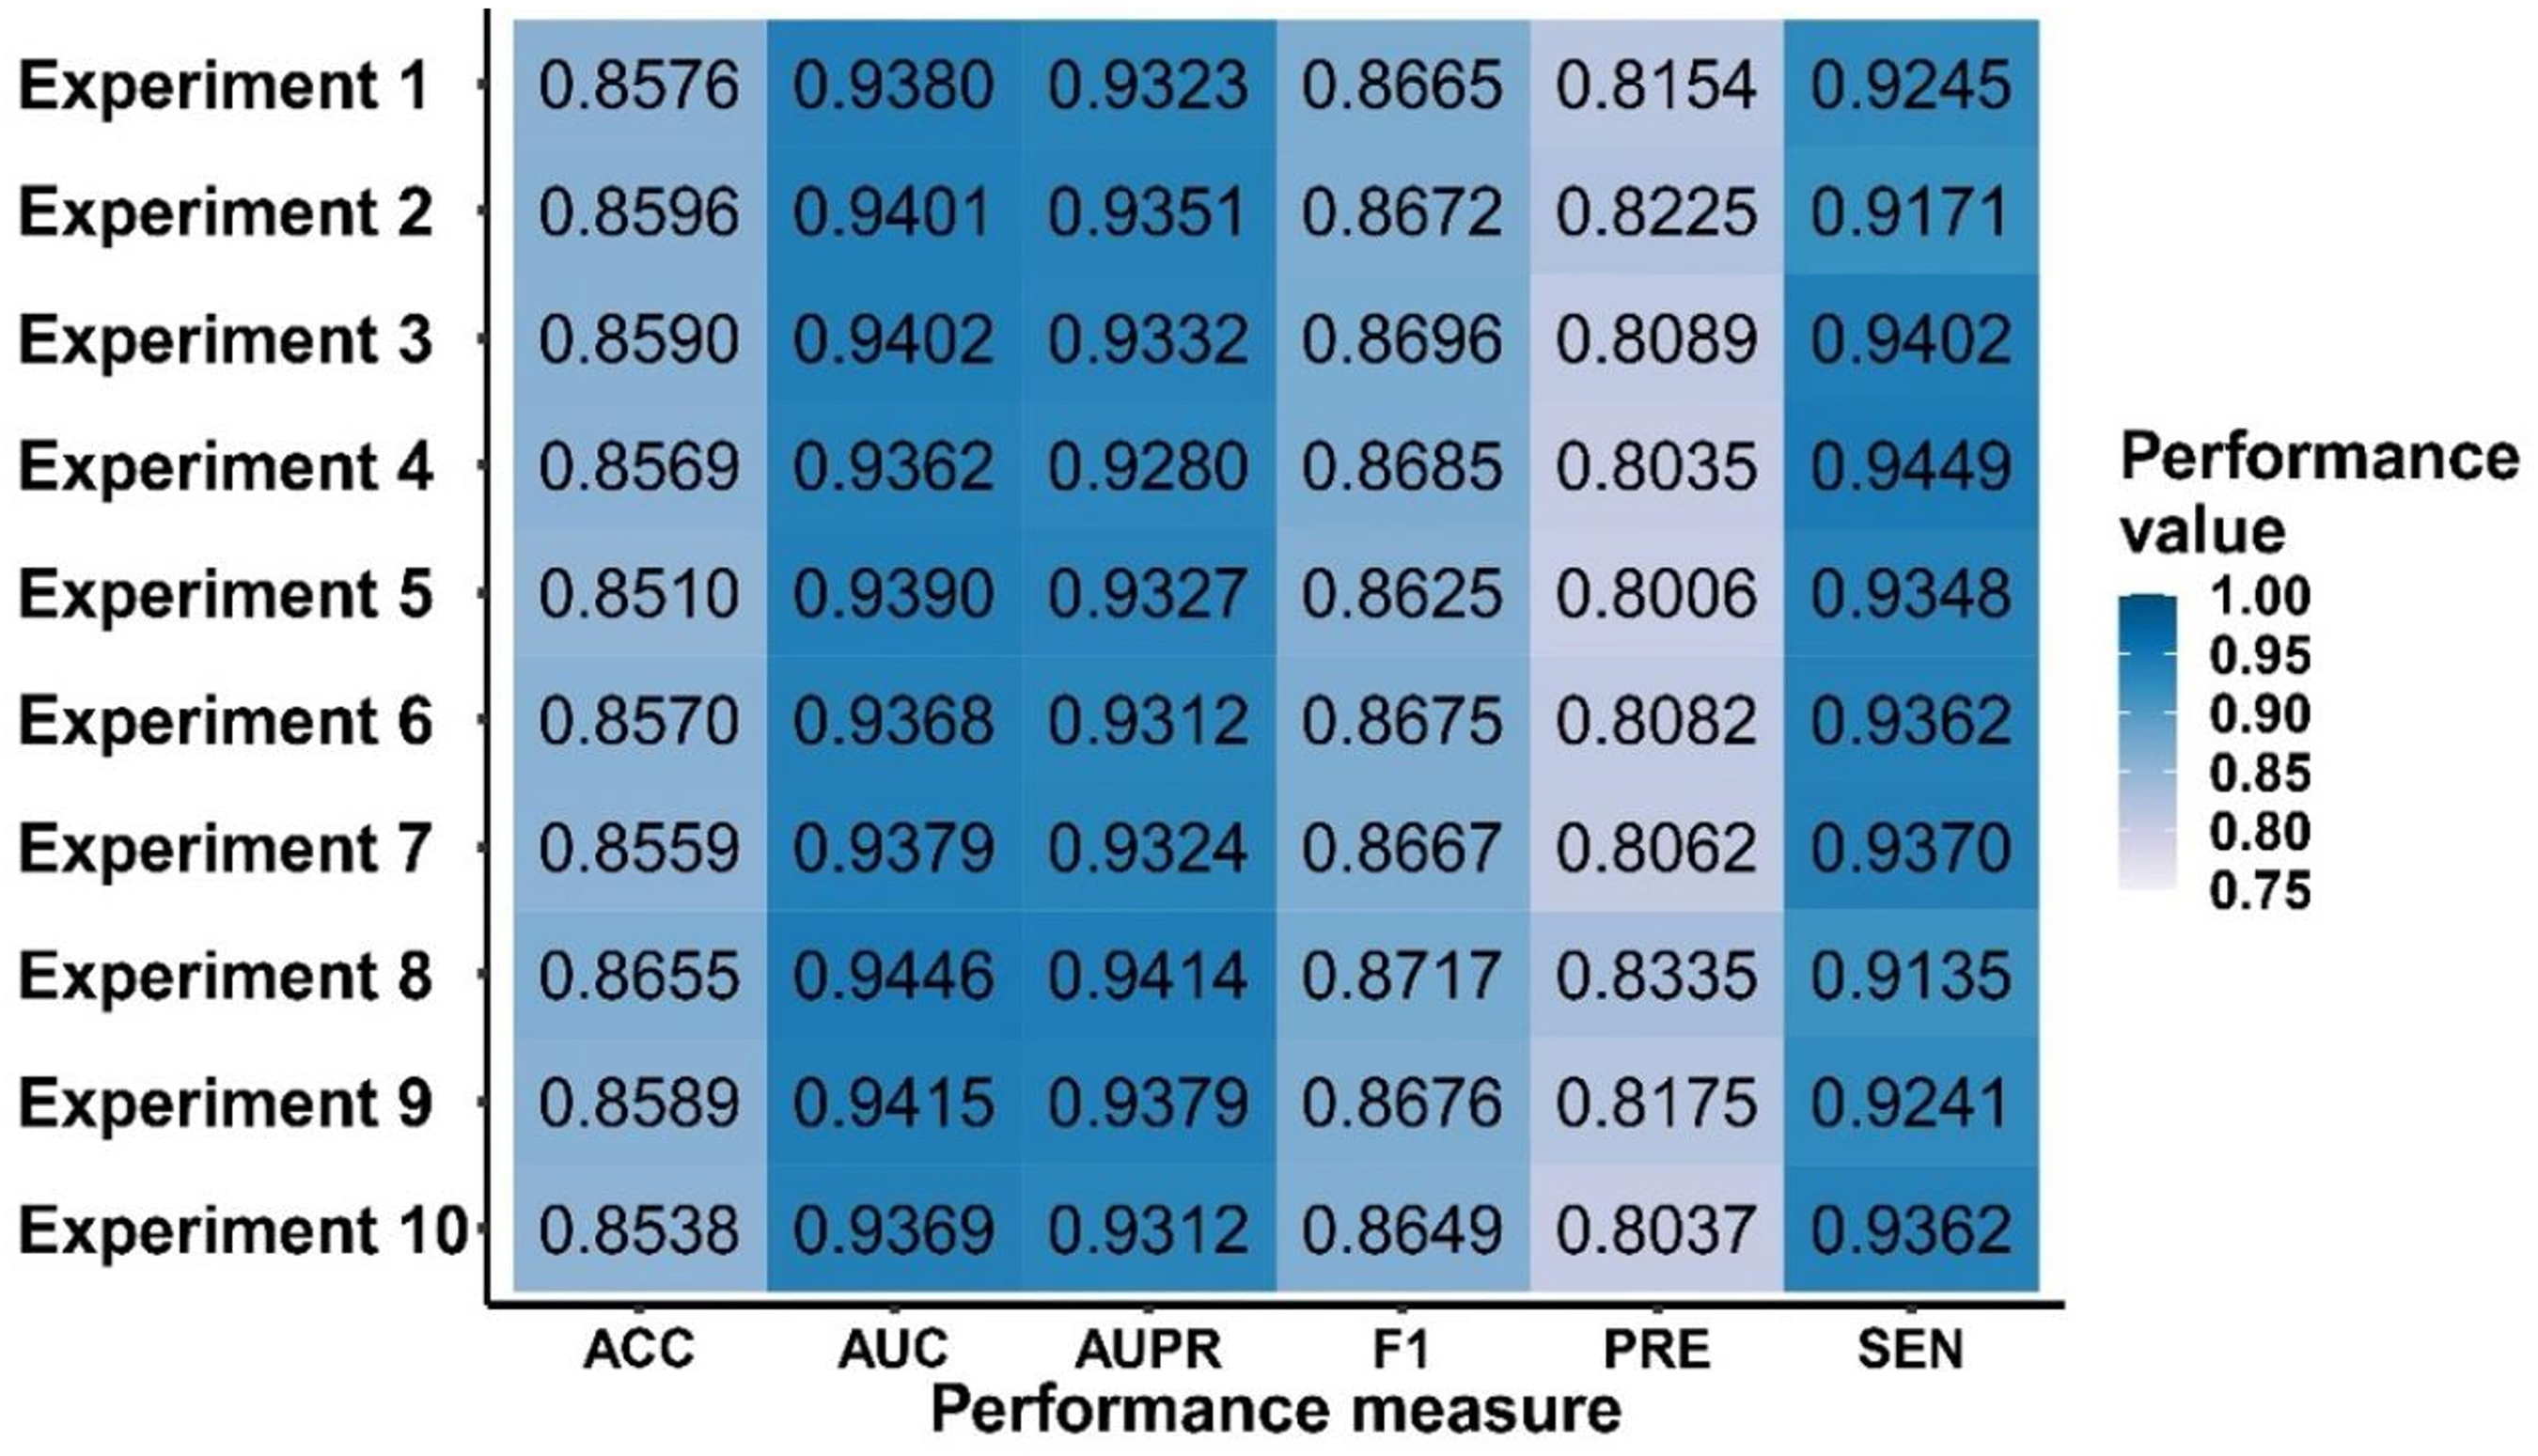
Performance of 10 experiments using the forward selection technique.

The number of experiments in which the observing feature was found.
Performance of predicting protein pairs sharing common drugs
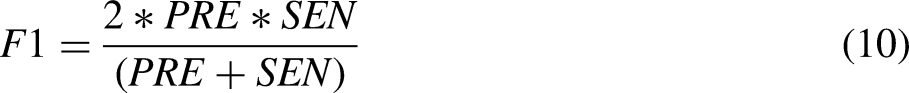
The crucial features obtained from the forward selection method were used by the random forest classifiers. Classifications with the random forest model were performed for five iterations with random sets of training and test data. Table 1 shows the classification performances and their average values. The results showed an average accuracy score of 85.7%, representing an overall correct prediction. The average precision and sensitivity of the model approximated as 0.813 and 0.928, respectively. This means that the model correctly predicted positive labels from all positive predictions with 81.3% accuracy and actual positives with 92.8% accuracy. The F1 score, which is the harmonic mean of precision and sensitivity showed an average value of 0.867. In addition, the area under the ROC curve was 0.939. The ROC curve for the five iterations is shown in Figure 5. There is more than 93% chance of the model classifying positive and negative labels for all five iterations. Moreover, the average AUPR is 0.932. The precision-recall curve for five iterations is illustrated in Figure 6.

ROC curve for five iterations.

Pr curve for five iterations.
Performance of predicting protein pairs for five iterations.

Novel drug associations corresponding to the predicted protein pairs
The average prediction score of each protein pair was calculated from the prediction scores of the pairs from all five classification models. If the average prediction score was greater than 0.5, then the protein pair was inferred to share common drugs. However, the amount of positive data was dominated by that of negative data (positive labels: 27,683 and negative labels: 3,563,590). Positive data can be unrevealed in the negative data group. Our results indicated 638,830 false positive pairs which is much higher than the number of true positive pairs (27,479). Therefore, we investigated the group of false positive prediction pairs using the similarity levels of the drug's chemical structures. These levels were derived from the maximum values of the chemical structure similarity of all possible drug pairs for a protein pair using the DD.CHEM database.38,39 The highest level of drug similarity was one, which indicates an identical chemical structure between two drugs. A higher level of drug similarity indicates the similarity of their chemical structures. Therefore, our predicted protein pairs with high drug similarity levels can presumably be proteins that are related to the same drugs. In the false positive group, there are 4718 pairs with drug similarity levels greater than or equal to 0.5. A quarter of these pairs have a level ≥ 0.7. There are up to 85 protein pairs having the highest level of 1. This is a hint that several protein pairs are yet to be discovered to share common drugs. All protein pairs having drug similarity levels greater than or equal to 0.5 are reported in Supplementary Table S2. Table 2 shows an example of 10 protein pairs with the highest drug similarity level of 1.
Ten protein pairs with the highest drug similarity levels.

We further investigated the similarity between the two drugs, as shown in Table 2. We employed the CTD database, which reports inferred associations based on chemical-gene interactions. If gene A has a curated association with chemical C and that with disease B, then chemical C has been reported as an inferred association with disease B. The gene that links the drug and disease of the inferred association is called the inferred gene. The inferred associations, on the other hand, report a relationship between a chemical and a condition; it does not imply that the drug has a potential therapeutic role in that disease. The database indicates an inferred association between epinastine (DB00751) and COVID-19 (MESH: C000657245) 43 and an inferred association between norepinephrine (DB00368) and COVID-19 (MESH: C000657245).43–45 Directed evidence of marker association was found. Asenapine (DB06216) and morphine (DB00295) are related to basal ganglia disease (MESH:D001480).46,47
Additionally, both butorphanol (DB00611) and loxapine (DB00408) have inferred associations with Arrhythmias, cardiac disease (MESH:D001145).48–51 The database also provides the inferred associations between naltrexone (DB00704) and amyotrophic lateral sclerosis 1 (MESH:C531617), 52 as well as those between phenylpropanolamine (DB00397) and amyotrophic lateral sclerosis 1 (MESH:C531617).52–70
The drugs that have been reported as inferred associations with COVID-19 (MESH:C000657245) are albuterol (DB01001), morphine (DB00295), buprenorphine (DB00921), and norepinephrine (DB00368).43–45,71 In addition, the chemical morphine (DB00295) is marker-directed evidence for vertigo disease (MESH: D014717),72,73 while dihydroergocornine (DB11273) is its therapeutic-directed evidence. 74 Moreover, naltrexone (DB00704) and phenylpropanolamine (DB00397) have inferred associations with esophageal squamous cell carcinoma (MESH:D000077277).75,76 For the drug pair between ergoloid mesylate (DB01049) and morphine (DB00295) and the pair between DL-methylephedrine (DB11278) and morphine (DB00295), we could not find evident support for their associations. The full list of inferred associations between drug and disease with inferred gene symbols and the literature support for the drug-drug pairs listed in Table 2 is shown in Supplementary Table S3.
Augmented drug-protein matrix
Drug-protein associations can be drawn from various aspects such as direct targets and functional relations. However, the limitation of the associations between drug and protein targets affects the efficiency of inferring new indications of drug repositioning approaches. In this case, the number of protein targets of drugs in the DrugBank database was investigated and revealed that one drug is mostly associated with one protein, as shown in Figure 7. To achieve the aim of drug repositioning, we attempted to find more proteins associated with the drugs. Therefore, our analysis addressed the associations between the proteins and the approved drugs.

The frequency of drugs and their associated proteins are based on direct target protein information from all approved drugs.
The prediction results of protein pairs sharing the same drugs were employed to further obtain more drug-protein associations. Using the criteria in Equation (5), the number of drug-protein associations in

Frequency of drugs and their associated proteins based on our prediction results of protein pairs related to the same drugs.
Performance of drug-repositioning approaches with the augmented drug-protein matrix
To demonstrate the enhanced efficiency of the drug-repositioning approaches with the use of the augmented drug-protein matrix, SCMFDD, 9 EMP-SVD, 28 and TS-SVD 29 were implemented using the augmented drug-protein matrix. Table 3 shows the performance of each method with the use of the original drug-protein matrix and the augmented drug-protein matrix. These three methods yielded better performance in all performance measures with the use of the augmented drug-protein matrix. TS-SVD with the augmented matrix provided the best performance.
Performance of the drug-repositioning techniques with the use of the augmented drug-protein matrix.

In SCMFDD, 9 the augmented drug-protein matrix was modified by converting the drugs' name from ‘DrugBank ID’ to ‘Chemical MeSH ID’ for enhancing the possibility of drug-protein associations in the drug-protein matrix to compute drug-drug similarities based on Jaccard similarity in SCMFDD method. The SCMFDD method utilized drug feature similarities and disease semantic similarity in low-rank spaces using the matrix factorization technique. 9 The disease semantic similarity was computed from MeSH information. There are five drug features into account drug feature-based similarities such as substructures, protein targets, pathways, enzymes, and drug-drug interactions. Only protein target features can be improved with the augmented drug-protein association. Since the SCMFDD method individually employed drug feature-based similarities to generate predictive models, the result in Table 3 shows the performance of the SCMFDD using the protein target features to compute the drug feature-based similarities. The dataset of the SCMFDD method contains 269 drugs and 598 diseases with 18,416 known drug-disease associations. For drug feature-based dataset composes 881 types of compound substructures, 623 protein targets, 247 enzymes, 465 pathways, and 2086 interactions among drugs. 9 Consequently, the dataset of drugs and proteins from the augmented drug-protein matrix were mapped into the same dataset of the SCMFDD method. The dimensions of the original drug-protein and augmented drug-protein matrix for the SCMFDD method were 269 × 529. The original drug-protein matrix of SCMFDD has 1,526 associations between drugs and proteins while the number of drug-protein associations increased to 39,420 associations in the augmented drug-protein matrix of the SCMFDD method. The performance of SCMFDD with the augmented drug-protein matrix in Table 3 was superior to that of SCMFDD with the original drug-protein matrix when using protein targets to compute drug feature-based similarity.
The augmented drug-protein matrix was applied to enhance the performance of the existing drug repositioning models (EMP-SVD 28 and TS-SVD. 29 ) Both models required information on the drug-protein matrix, disease-protein matrix, and drug-disease matrix. All matrices were constructed using various databases such as DrugBank, CTD, and DisGeNET. Consequently, the dimensions of the drug-protein matrix and augmented drug-protein matrix were 2,120 × 9,314, and those of the drug-disease and disease-protein matrices were 2,120 × 1,437 and 1,437 × 9,314, respectively.
The EMP-SVD model employed five meta-paths. 28 Meta-path 1 was an adjacency matrix between drugs and diseases. Meta-path 2 described the path from drug to disease when passing a protein. Meta-path 3 described the path of drug-protein-drug-disease. Meta-path 4 described the drug-disease-drug-disease path. Meta-path 5 described the drug-disease-protein-disease path. We conducted experiments for every single meta-path and the ensemble meta-path and compared the performances of EMP-SVD when using the augmented and original drug-disease matrices. The performances of EMP-SVD with the original drug-protein and augmented drug-protein matrices are shown in Tables 4 and 5, respectively. The results showed that the performance of EMP-SVD with the augmented drug-protein matrix for all five meta-paths and the ensemble five meta-paths was superior to that of EMP-SVD with the original drug-protein matrix.
Performance of EMP-SVD when using the original drug-protein matrix.
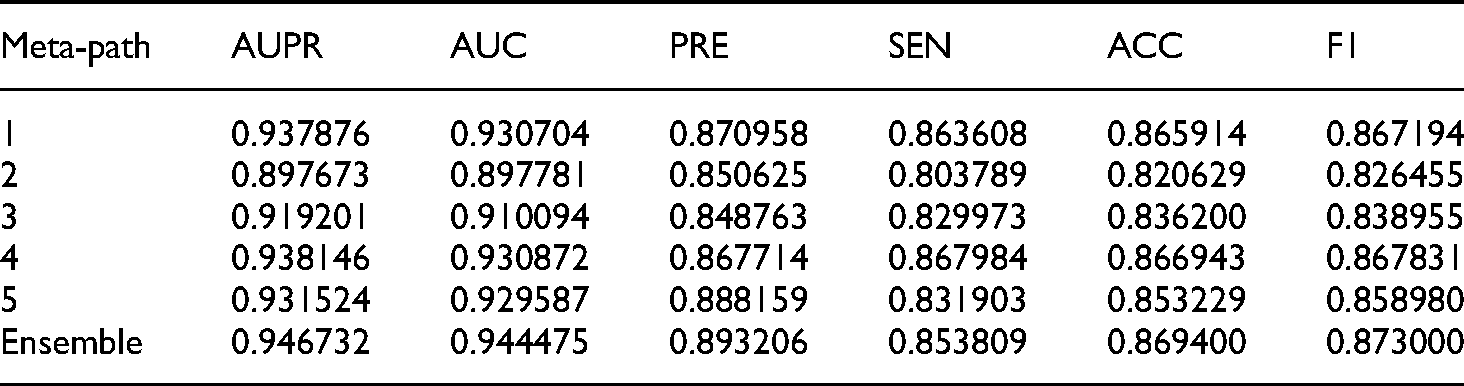
Performance of EMP-SVD when using an augmented drug-protein matrix.

The EMP-SVD model was proposed based on five meta-paths, SVD techniques, and the reliable negative. 28 The TS-SVD method was based on the common neighbors’ count matrix of drugs and diseases to achieve a topological similarity matrix, SVD, and a reliable negative, which was defined by k-step neighbors among drugs and diseases. 29 We then investigated the performances of TS-SVD model with the augmented and original drug-protein matrices. These performances are presented in Table 6. The results showed that the TS-SVD with the augmented drug-protein matrix performed better than that with the original drug-protein matrix. Thus, our predictions of protein pairs sharing common drugs are efficient and can be used to improve the performance of existing drug repositioning models.
Performance comparison of the TS-SVD method between the original and augmented drug-protein matrices.

The augmented drug-protein matrix integrating the predictions of protein pairs sharing common drugs can discover the unrevealed associations of drug-associated proteins. The augmented drug-protein matrix enhances the performances of both EMP-SVD and TS-SVD. In EMP-SVD, the augmented drug-protein matrix influenced meta-path 2 and meta-path 3, which are composed of a direct path from the drug to protein. Tables 4 and 5 indicate that the augmented drug-protein matrix enhances the AUC values for meta-path 2 and meta-path 3 to 6.3% and 4.7%, respectively. Meanwhile, the augmented drug-protein matrix enhances the AUC value to 2.6%, 2.6%, 3.3%, and 3.3% for meta-paths 1, 4, and 5, respectively. In addition, EMP-SVD determined the reliable negative, which is the drug that cannot treat the disease, including that there are no common proteins between the drug and disease based on a heterogeneous network. Therefore, the augmented drug-protein matrix also impacts a reliable negative set for splitting a training set and a test set. Consequently, the augmented drug-protein matrix also has a minimal effect on the performance of meta-paths 1, 4, and 5.
Comparing the performance between the original and augmented drug-protein matrices based on the EMP-SVD and TS-SVD methods using the same set of drug-protein, disease-protein, and drug-disease associations, the performance scores of the TS-SVD method outperformed those of the EMP-SVD method when using the augmented drug-protein matrix. From the five-fold cross-validation, the prediction results from EMP-SVD and TS-SVD methods with prediction scores of more than 0.5 are shown in Supplementary Table S4 and S5, respectively.
Candidate drug-disease associations with the use of an augmented drug-protein matrix
New candidate drug-disease associations can be identified by selecting the false positives with high prediction scores from EMP-SVD and TS-SVD methods with the augmented matrix. The threshold for the candidate pairs was arbitrary to choose from the scores of range from 0.5 to 1.0. Therefore, with high confidence with scores of more than 0.9, there were about four drug-disease associations predicted by the EMP-SVD method (see Table 7) and only one drug-disease association found by the TS-SVD (see Table 8). However, to describe the relevance of a potential existing drug to treat another disease of the prediction results, the top 10 candidates of both methods were then validated with the present knowledge in the databases and literature as follows.
The top 10 candidate drug-disease associations in the false positive group are predicted from the EMP-SVD method when using an augmented drug-protein matrix.

The top 10 candidate drug-disease associations in false positive group are predicted from the TS-SVD method when using an augmented drug-protein matrix.

The top 10 novels of drug-disease pairs based on prediction scores from EMP-SVD and TS-SVD are shown in Tables 7 and 8, respectively. These pairs have not been reported as approved drug-disease pairs yet. Additionally, most of the novel drug-disease associations are found in the relationship based on the CTD database, 40 which reports inferred associations by determining between chemical-gene interaction and disease-gene interaction. The gene that links chemicals and disease is called the inference gene. With the chemical-gene interaction and the disease-gene interaction on the CTD database, false positive pairs from EMP-SVD were further validated by their inference genes while all false positive pairs from TS-SVD were not found any inference genes involved with. For the top prediction score of candidate drug-disease pairs from EMP-SVD using the augmented drug-protein matrix, valsartan (DB00177) is used to treat hypertension to lower the risk of cardiovascular events, such as strokes and myocardial infarctions; while hyperglycemia (MESH:D006943) is frequently associated with diabetes in which there is too much sugar in the blood due to a lack of insulin to transport glucose into the bloodstream. 32 The CTD database reports that valsartan and hyperglycemia have an inferred association; moreover, inference genes are CCL2, CD163, COL3A1, IL6, NOS3, PTGS2.62,77–79 Furthermore, valsartan is assessed for the safety and efficiency of diabetes in clinical testing (ClinicalTrials.gov Identifier: NCT00097786), the result indicates that valsartan has a relative reduction of 14% for patients with a glucose tolerance problem. 80
In addition, the CTD database presents that, rutin (DB01698) and poisoning (MESH:D011041),81,82 acetylsalicylic acid or aspirin (DB00945) and encephalomyelitis (MESH:D004681),83,84 metformin (DB00331) and medulloblastoma (MESH:D008527),85–88 clarithromycin (DB01211) and diarrhea (MESH:D003967), 89 fulvestrant (DB00947) and amnesia (MESH:D000647),90–94 omeprazole (DB00338) and respiratory insufficiency (MESH:D012131), 95 lipoic acid (DB00166) and neointima (MESH:D058426),96–98 and nicorandil (DB09220) and catalepsy (MESH:D002375) 99 have reported as inferred associations between drugs and diseases, as shown in Table 7. Based on the CTD database, folic acid or vitamin B9 (DB00158) which is located in many supplements that are used to treat megaloblastic anemia 32 therapeutic evidence is not found or an inferred association with dyskinesias (MESH:D020820). Dyskinesias is an unpredictable writhing movement of the face, arms, or legs. Dyskinesias indication is a side effect of certain Parkinson's drugs such as levodopa. 100 However, Folic Acid, vitamin B6, and vitamin B12 which are a supplement for Parkinson's disease are evaluated for safety and efficiency of treatment in clinical testing (ClinicalTrials.gov Identifier: NCT00853879).
Discussion
This study exploits the various aspects of similarities among proteins to predict protein pairs that share common drugs and create an augmented drug-protein matrix to enhance the performance of drug repositioning approaches. The similarities among proteins in diversified biological meanings were categorized into four groups: PPI data, network, sequence alignment, and biological functions. The PPI data provide information on the relationships among protein pairs in physical and functional interactions. The network representing the associations among proteins indicates interactions between two proteins through the network structure and their neighborhood. Sequence alignment describes the structural and evolutionary similarities among protein pairs. The biological functions characterize the molecular interaction, reaction, and relation as well as the biological process among proteins.
For all 10 experiments, the forward selection algorithm yields the importance of features by ordering. The feature that appears first is the most important, while the one that turns up last is the least important, as shown in Supplementary Table S1. The local alignment feature is an outstanding feature for predicting protein pairs sharing common drugs. If the regions in the sequence of the two proteins are similar, then the common drugs can bind to these similar regions. The GO feature and common module feature are remarkable for most relevant features because they explain similar biological functions. The common drug might affect proteins in the same module of the complex system. The experimental feature is also one of the most relevant features for prediction. If the experimental data indicate directed interactions among proteins, they should operate together in some biological mechanisms. Then, the common drugs of these two proteins might relate to these two interacting proteins. The experimental results show that the fusion feature is irrelevant for our prediction, indicating that the score of an individual gene fused in other species is not suitable for inferring common drugs between two proteins. From the feature selection algorithm, the crucial features are effect for predicting protein pairs sharing common drugs and yield a relatively high performance with an AUC of 0.939. Therefore, with the high prediction of predicting protein pairs, an augmented matrix for drugs and proteins was created to provide more relative information to infer new drug-disease associations.
To evaluate the performance of the use of an augmented drug-protein matrix for drug repositioning approaches, SCMFDD, 9 EMP-SVD, 28 and TS-SVD 29 were implemented and compared. These three methods yielded better performance when using the augmented matrix. The SCMFDD method employed the drug feature similarities and disease semantic similarities for predicting a new drug-disease pair. 9 The augmented matrix directly improved the protein target features for computing drug similarities. Thus, it resulted in better performance when using the augmented matrix. The EMP-SVD and TS-SVD were the methods based on meta-paths and topologies that directly applied a drug-protein matrix in their models. The EMP-SVD model was proposed based on five meta-paths, SVD techniques, and the reliable negative. 28 Recently, a drug-repositioning method with topological similarity and singular value decomposition (TS-SVD), 29 an improved version of EMP-SVD, was developed. The TS-SVD method was based on the common neighbors’ count matrix of drugs and diseases to achieve a topological similarity matrix, SVD, and a reliable negative, which was defined by k-step neighbors among drugs and diseases. We then investigated the performances of the TS-SVD model with the original and augmented drug-protein matrices. The performances were improved from 0.9946 to 0.9995 using the augmented matrices. The performance scores of the TS-SVD are quite high because the TS-SVD performed a filtering process of the reliable negative sample before fitting the model. We investigated the impact of the filtering process and compared the performances with filtering and without filtering reliable negative samples based on drug-protein associations via DrugBank database are shown in the Supplementary Table S6. The performances were decreased when generating a predictive model without selecting reliable negative samples. This result showed that filtering the reliable negative data based on k-step neighbors among drugs and diseases impacts predicting the drug repositioning approach. However, this filtering process might be considered to bias by separating positive and real negative samples to refine the data before generating a predictive model. Nevertheless, the augmented drug-protein matrix could improve the performance showing that the TS-SVD with the augmented drug-protein matrix performed better than that with the original drug-protein matrix. Thus, our predictions of protein pairs sharing common drugs are efficient and can be used to improve the performance of existing drug repositioning models.
Our study reveals 10 promising protein pairs sharing the same drugs, whose corresponding drugs show high similarity in terms of the chemical structure. However, these protein pairs have not been reported as directed evidence of sharing common drugs in the database. Therefore, these potential pairs are compelling for further studies of drug development and design. One limitation of this study is the insufficient data available for approved drugs related to protein pairs, generating noisy data in the negative set.
Conclusions
This study proposes the use of a random forest model for predicting protein pairs that share common drugs. The features of the model were based on the relationships among proteins in various biological aspects. This study could be useful in enhancing the opportunity to discover missing drug-associated proteins. The forward selection technique provides a set of crucial features for prediction. The results obtained from the feature selection technique revealed crucial features, such as local alignment, GO, experiments, common modules, text mining, global alignment, co-expression, common neighbors, conserved neighborhood, closer proteins, databases, and co-occurrence. The model yielded high performance, with an AUC exceeding 93%.
Moreover, this study suggested 10 novel potential protein pairs predicted to share common drugs. These protein pairs have not yet been known to share the same drug in DrugBank. They achieved a very high chemical structure similarity score. Therefore, these 10 protein pairs are very interesting for further investigation.
Furthermore, this study proposes an augmented drug-protein matrix based on the predictions of protein pairs sharing the same drugs. The augmented matrix can enhance the performance of existing drug repositioning techniques.. Hence, the predictions of protein pairs sharing the same drugs can be used for drug repositioning.
Supplemental Material
sj-docx-1-sci-10.1177_00368504221109215 - Supplemental material for Integration of various protein similarities using random forest technique to infer augmented drug-protein matrix for enhancing drug-disease association prediction
Supplemental material, sj-docx-1-sci-10.1177_00368504221109215 for Integration of various protein similarities using random forest technique to infer augmented drug-protein matrix for enhancing drug-disease association prediction by Satanat Kitsiranuwat, Apichat Suratanee and Kitiporn Plaimas in Science Progress
Supplemental Material
sj-xlsx-2-sci-10.1177_00368504221109215 - Supplemental material for Integration of various protein similarities using random forest technique to infer augmented drug-protein matrix for enhancing drug-disease association prediction
Supplemental material, sj-xlsx-2-sci-10.1177_00368504221109215 for Integration of various protein similarities using random forest technique to infer augmented drug-protein matrix for enhancing drug-disease association prediction by Satanat Kitsiranuwat, Apichat Suratanee and Kitiporn Plaimas in Science Progress
Supplemental Material
sj-docx-3-sci-10.1177_00368504221109215 - Supplemental material for Integration of various protein similarities using random forest technique to infer augmented drug-protein matrix for enhancing drug-disease association prediction
Supplemental material, sj-docx-3-sci-10.1177_00368504221109215 for Integration of various protein similarities using random forest technique to infer augmented drug-protein matrix for enhancing drug-disease association prediction by Satanat Kitsiranuwat, Apichat Suratanee and Kitiporn Plaimas in Science Progress
Supplemental Material
sj-xlsx-4-sci-10.1177_00368504221109215 - Supplemental material for Integration of various protein similarities using random forest technique to infer augmented drug-protein matrix for enhancing drug-disease association prediction
Supplemental material, sj-xlsx-4-sci-10.1177_00368504221109215 for Integration of various protein similarities using random forest technique to infer augmented drug-protein matrix for enhancing drug-disease association prediction by Satanat Kitsiranuwat, Apichat Suratanee and Kitiporn Plaimas in Science Progress
Supplemental Material
sj-xlsx-5-sci-10.1177_00368504221109215 - Supplemental material for Integration of various protein similarities using random forest technique to infer augmented drug-protein matrix for enhancing drug-disease association prediction
Supplemental material, sj-xlsx-5-sci-10.1177_00368504221109215 for Integration of various protein similarities using random forest technique to infer augmented drug-protein matrix for enhancing drug-disease association prediction by Satanat Kitsiranuwat, Apichat Suratanee and Kitiporn Plaimas in Science Progress
Supplemental Material
sj-xlsx-6-sci-10.1177_00368504221109215 - Supplemental material for Integration of various protein similarities using random forest technique to infer augmented drug-protein matrix for enhancing drug-disease association prediction
Supplemental material, sj-xlsx-6-sci-10.1177_00368504221109215 for Integration of various protein similarities using random forest technique to infer augmented drug-protein matrix for enhancing drug-disease association prediction by Satanat Kitsiranuwat, Apichat Suratanee and Kitiporn Plaimas in Science Progress
Footnotes
Author contributions
Conceptualization, S.K., A.S. and K.P.; methodology, S.K., A.S. and K.P.; funding acquisition, A.S.; formal analysis, S.K.; validation, S.K., A.S. and K.P.; writing—original draft preparation, S.K.; writing—review and editing, S.K., A.S. and K.P.; supervision K.P. and A.S.
All authors have read and agreed to the published version of the manuscript.
Institutional Review Board Statement
Not applicable.
Informed Consent Statement
Not applicable.
Data Availability Statement
Data sharing is not applicable to this article.
Acknowledgments
Declaration of conflicting interests
The author(s) declared no potential conflicts of interest with respect to the research, authorship, and/or publication of this article.
Funding
The author(s) disclosed receipt of the following financial support for the research, authorship, and/or publication of this article: This work was supported by the King Mongkut's University of Technology North Bangkok, (grant number KMUTNB-64-KNOW-21).
References
Supplementary Material
Please find the following supplemental material available below.
For Open Access articles published under a Creative Commons License, all supplemental material carries the same license as the article it is associated with.
For non-Open Access articles published, all supplemental material carries a non-exclusive license, and permission requests for re-use of supplemental material or any part of supplemental material shall be sent directly to the copyright owner as specified in the copyright notice associated with the article.