
Abstract
As one of the essential components of the braking system, the high-speed train brake disc is an integral part of ensuring the safety of the train. The main objective of this study is to conduct thermal analysis and reliable life prediction on brake discs. The research was conducted by developing a programmer spectrum of brake discs with high-speed train brake discs. According to the results of numerical analysis and the S-N curve of the material, the temperature distribution on the surface of the brake disc is determined, and the fatigue life of the brake disc is predicted. The comparison with the service life of the brake disc verifies the rationality of the calculation results. In addition, a fatigue damage probability model of brake discs is established based on the theory of fatigue cumulative damage. Through the relationship between the reliability of mechanical parts and the number of load cycles, the reliable life of the brake disc under different working conditions is predicted. This work establishes a method of reliable life analysis for brake discs of high-speed trains based on the load spectrum, which could analyze the life and reliability of brake discs more systematically.
Keywords
Introduction
The brake disc's fatigue life may be anticipated using the collected load during train operation in conjunction with the fatigue-related mechanism or S-N curve. As a result, to precisely anticipate the brake disc's fatigue life, it is important to examine the load signals obtained. There are several mature research approaches for handling load signals.
The service life of high-speed train brake discs is related to the ambient temperature, braking pressure, and random load from the track. 1 When the train is braking, the brake disc temperature rises rapidly due to the braking force. Due to the different heat dissipation effects of each part of the brake disc, there is a temperature gradient in the brake disc, which provides conditions for the generation of thermal stress. Thermal stress could easily cause thermal fatigue of the brake disc and accelerate the formation of cracks inside the brake disc. 2 In addition, brake disc surface temperature is also related to the brake disc material. The brake disc is usually made of cast steel or forged steel. Due to the limitation of casting level, the qualified rate of cast steel brake disc is low, and defects are prone to appear in the casting process. Generally, the brake discs of high-speed trains are mostly made of forged steel. Forged steel shows good mechanical properties at high temperatures, ensuring the processing quality of brake discs. Jin et al. 2016 3 studied the change of material parameters of train brake disc with temperature, which provided methods for brake disc design and process improvement.
Wang et al. 2009 4 analyze the temperature distribution on the surface of the brake disc, and the numerical solution is usually needed. A simulation tool could be used to analyze the temperature field and stress field of the brake disc. Guo et al. 2016 5 used the differential quadrature method to solve the temperature distribution along the radial direction of three different materials of brake discs. They found that the temperature distribution along the radial direction of materials with good thermal conductivity usually presented uniform distribution. Que et al. 2019 6 analyzed the stress field of a forged steel brake disc and verified that a forged steel brake disc could meet the requirements of safe braking. Wang et al. 2008 7 conducted numerical analysis on the braking process of the high-speed train, and the theoretical results were consistent with bench test results. Zhang et al. 2011 8 found that the highest temperature exists on the friction surface through simulation analysis. The convective heat transfer coefficient was obtained by Yang et al. 2008 9 through CFD (Computational Fluid Dynamics) numerical simulation, which did not need to rely on the traditional theory for calculation.
Belhocine et al.10–12 calculated the temperature change of brake disc surface during train braking and related numerical calculation. The heat source of the brake disc could be analyzed based on the change of heat source. The process of friction heat generation of brake disc was studied, and the change of mechanical properties of brake disc material after temperature rise was obtained.13,14
The mechanism of mechanical stress formation in the brake disc was studied by Chen et al. 2021. 15 Wang et al. 2019 16 analyzed how continuous thermal and mechanical stresses affect crack extension and microstructural evolution in brake discs. Li et al. 2015 17 conducted thermal cycling tests to simulate the temperature change during braking, and the volume change of the steel caused by microstructural transformation was considered in the numerical simulation. Sawczuk et al. 2018 18 presented the results of several years of investigations on the railway disc brake under varying wear conditions in relation to the UIC (International Union of Railways) requirements for brake pad approval. Besides, Yan et al. 2015 19 used numerical simulations to systematically compare the thermofluid properties of cross-drilled ventilated brake discs with standard and included radial vanes. The heat transfer enhancement mechanism of the cross-drilled hole is elucidated. Li et al. 2021 20 discussed the current research status and development trend of automotive disc brake materials.
Bench tests are usually used for brake discs of high-speed trains to collect load signals during driving. Due to the limitations of the test conditions and the inevitable signal interference, the collected brake disc load signals generally contain interference signals such as noise and abnormal values. Therefore, it is necessary to preprocess the original signals, such as wavelet threshold denoising.21,22 According to the principle of load analysis, the amplitude, mean value, extreme value, and standard deviation of load signals could reflect the overall characteristics of load signals.23–25 For the preprocessed signals, extracting the average load amplitude is usually necessary. The commonly used method is the rain flow counting method, which is widely used to extract the load amplitude of mechanical structures and vehicle parts.26,27 In order to reflect the train driving conditions more honestly, it is often necessary to extrapolate the collected load signals. Commonly used extrapolation methods include over threshold extrapolation, parameter extrapolation, and extrapolation by mileage or quantile. 28 It is necessary to compile the program spectrum. 29 Liu et al. 2017, 30 Liu et al. 202231,32 described the compilation process of load spectrum in detail and studied the life of relevant parts through load spectrum.
Therefore, considering the service condition of the brake disc, it is necessary to carry out a thermal analysis. The main content of this work is as follows. Firstly, a load spectrum is constructed from the collected brake disc load signals. Secondly, the thermal fatigue analysis of the brake disc is carried out. Next, the reliability of the brake disc is analyzed. Based on the collected load spectrum, a reliable life analysis method of high-speed train brake discs is proposed, which could analyze the life and reliability of brake discs more systematically.
Load signals analysis of the brake disc
The research process of this paper is shown in Figure 1.

Flow chart of brake disc fatigue life.
As an important part of the braking system, the load form and material of the brake disc will affect the braking efficiency. Therefore, a high-reliability level of the brake disc is the premise to ensure the safe operation of the train. 33
The driving conditions of the high-speed train could be roughly divided into three stages: accelerating process at a lower speed, approximately driving at a uniform speed and decelerating process. Generally, the train also experiences a similar acceleration and deceleration process when passing through a station. Section 2 mainly studies the load on the brake disc during the deceleration process of the train.
Load signals preprocessing
In engineering, to save workforce and material resources, a braking test is usually carried out on the test bench. 34 Acceleration signals collected by the sensor device are shown in Figure 2. Due to the inevitable interference of environmental factors, the collected acceleration signals contain some abnormal values. These inevitable abnormal signals will affect the compilation of the acceleration spectrum and even affect the accuracy of the service life prediction with the brake disc. Therefore, it is necessary to preprocess the original load signals.

Acceleration of train during braking.
Due to the interference of the service environment, some unavoidable abnormal loads will appear in collected signals. These abnormal signals will have a great impact on fatigue life prediction. To predict the service life of the brake disc accurately, it is necessary to eliminate them. This paper uses a
For a group of test data, the mean value and standard deviation could be obtained from equations (1) and (2).


If the signal value conforms to equation (3), it is judged as an abnormal value. Otherwise, it is regarded as a normal value for subsequent processing.
Due to the noise of collected signals, interference will be produced when the load spectrum is processed. Therefore, to obtain the ideal load signals, it is necessary to remove the noise signals. For signal de-noising, the threshold method could be used to separate noise and useful signals. The threshold method has a better denoising effect and can further improve the signal-to-noise ratio of the signal. Threshold processing generally includes two parts: threshold and threshold function.
The threshold function could quantize the wavelet coefficients. There are two common thresholding methods: Hard thresholding and Soft thresholding. Both methods have their limitations: the hard threshold function has discontinuities in some areas, while the soft threshold function has deviations. Therefore, we could reset the function domain to obtain a better processing effect. According to the above analysis, signal processing toolboxes are used to complete the load signals preprocessing. Select the appropriate number of decomposition layers for the load signals following outlier elimination; a comparison of load signals is presented in Figure 3.

Original signal and De-noised signals.
It could be seen from Figure 3 that the denoising process is mainly to remove outliers and oscillation signals. After denoising, the load signals present a gentler trend. The above work lays a foundation for the extraction of load average amplitude.
Analysis of load distribution characteristics
The initial speed of train braking is 250 km/h, and the average amplitude of load signals of the brake disc could be extracted after preprocessing. The amplitude could reflect the overall characteristics of load signals, and it could be used to program the load spectrum and predict the fatigue life of structural components. Before extracting the amplitude of load signals, the loads should be counted. In mechanical fatigue, load counting transforms the load-time history into a regular load cycle process. The two-parameter method could better reflect the overall characteristics of the load. This study uses the rain flow counting method to extract the mean and amplitude. 37
Before further analyzing the distribution characteristics of load signals, extracting the amplitude, and counting the frequency of collected load signals, 38 the rain flow counting method is used to extract the load cycles, and their mean and amplitude are counted. The counting results are shown in Figures 4 and 5.

Statistical histogram of mean frequency.

Statistical histogram of amplitude frequency.
In Figures 4 and 5, the load is braking force, converting the acceleration of the train into braking force is for subsequent stress analysis.
It could be seen from Figure 4 that the mean frequency distribution is peak-symmetrical, and the distribution function part could conform to the t-location-scale distribution, logical distribution and normal distribution. As shown in Figure 5, the amplitude-frequency distribution is a unimodal distribution, and its distribution may conform to the Weibull distribution, lognormal distribution and gamma distribution. Therefore, the probability distribution density function with unimodal characteristics is used to fit the mean and amplitude of load signals.
The distribution model is obtained by fitting the probability density function according to the load signals distribution in Figures 4 and 5, which could more intuitively reflect load distribution characteristics. The common probability distribution models include exponential distribution, normal distribution, gamma distribution, Weibull distribution and lognormal distribution. The expressions of several common probability distribution density functions are shown in Table 1.
One-dimensional distribution ndensity function.

Different probability density functions are used to fit the frequency statistical histogram to obtain the probability distribution functions. In addition, log likelihood estimation is used to fit the functions. The fitting results are shown in Figures 6 and 7, and log likelihood estimation results are shown in Tables 2 and 3.

Mean fitting.

Amplitude fitting.
Log likelihood estimation test of mean under different mathematic models.

Log likelihood estimation test of amplitude under different mathematic models.

As shown in Figure 6, the t-Location-scale, logistic, and normal distribution all fit better to the mean. They can be tested using the log-likelihood estimation method to determine the best fit. The log-likelihood estimates are shown in Table 2. In the log-likelihood estimation test, a larger estimate indicates a better fit. In Table 2, the estimated value of the normal distribution is the largest among several distribution models, and the normal distribution is the best fit compared with the other two distribution models.
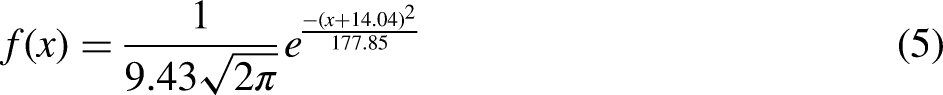
The probability density function of normal distribution is shown in equation (4)
According to equation (6), the probability density function of lognormal distribution could be expressed as follows

Load extrapolation
The data collected in the bench test is data for a period or under certain conditions, while the actual working condition of the train is long-distance operation. Therefore, to predict the fatigue life of the brake disc more reasonably, it is necessary to extrapolate the collected load signals. Due to the stable running state of the train during driving, this section uses the parameter method combined with the mileage to extrapolate the load signals.
1
According to the statistical point of view, 106 cycles could represent the real load condition, and the load signals are extrapolated to 106 cycles. The load signals are extrapolated by using the methods, as shown in equation (8)
Program spectrum compilation
Due to the load signals obtained could not be directly applied to the fatigue life prediction, it is necessary to compile the collected load signals into the program load spectrum. The program spectrum is equivalent to loading loads of different amplitudes in a certain order, which is more in line with the working conditions of the mechanical structure in service. 39 Generally, a one-dimensional 8-level load could better reflect the overall characteristics of load signals. In this paper, the fatigue life of the brake disc is predicted by compiling a one-dimensional 8-level program load spectrum.
To reflect the overall characteristics of the load signals more accurately, this study uses the amplitude scale coefficient to divide collected load signals into unequal intervals. 40 In the process of compiling the load spectrum, the commonly used amplitude scale factor is shown in Table 4.
Amplitude scale factor.

One dimensional load program spectrum is compiled by load amplitude and its corresponding frequency. The amplitude ratio coefficient method is used to divide the amplitude and compile the 8-level load spectrum of the brake disc. The division of the amplitude interval is shown in equation (9).
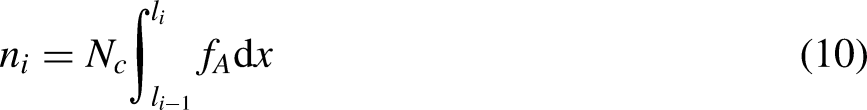
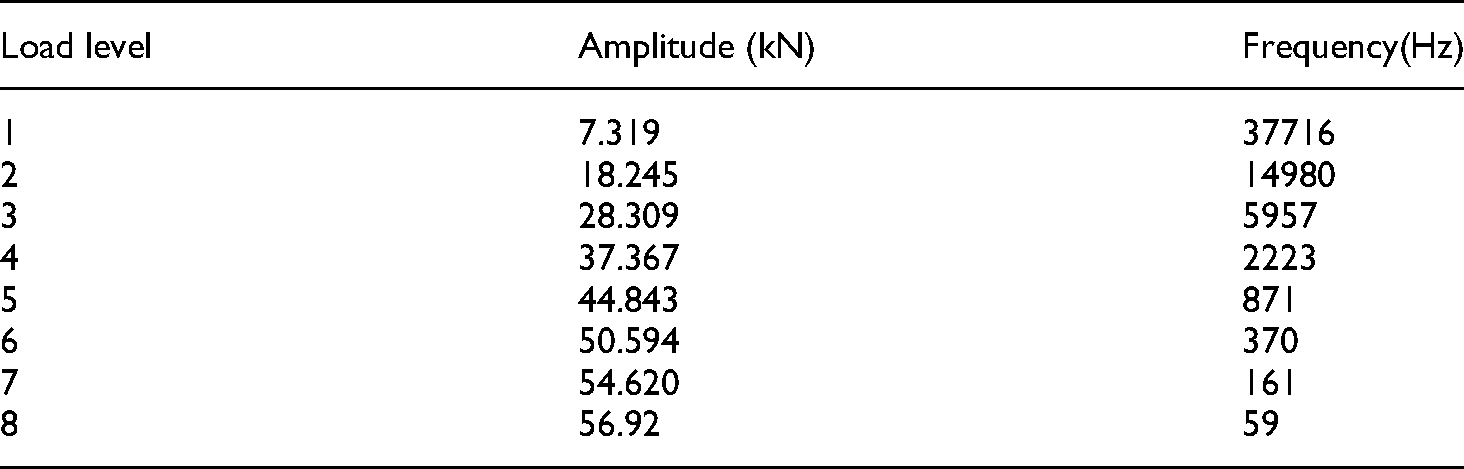
According to the program spectrum construction method shown in equation (9) and equation (10), the one-dimensional program load spectrum shown in Table 5 could be obtained.
Braking load program spectrum.
Thermal stress analysis of the brake disc
In the braking process of high-speed trains, the purpose of deceleration is achieved through the surface friction between the friction plate and brake disc. Due to the uneven heat dissipation on the surface of the brake disc, there is a temperature gradient inside the brake disc, which leads to the generation of thermal stress. Relevant literature research showed that the influence of thermal stress on the service life of high-speed train brake disc is far greater than the random load caused by road vibration.41–43 Therefore, based on the thermodynamic theory, the temperature distribution on the surface of the brake disc is obtained by numerical analysis. At the same time, the fatigue life of the brake disc is calculated according to the material parameters of the brake disc and the S-N curve of 25Cr2MoV steel.
Heat transfer parameters
Heat transfer usually occurs between two objects with temperature differences. The phenomenon of heat transfer will last for a period until the temperature difference between objects disappears. There are three common ways of heat transfer: heat conduction, heat convection and heat radiation. 44
(1) If there is a temperature difference inside an object or between several close objects, heat will be transferred from high temperature to low temperature. In this case, the heat conduction law is shown in equation (11).
(2) Thermal convection usually occurs on the surface of solid and liquid in contact. Thermal convection could be divided into natural convection and forced convection. The convective heat could be described by equation (12).
(3) Generally, when an object radiates energy outward, it will also absorb the energy radiated by other objects. The net heat transfer between objects could be calculated by Stefan Boltzmann equation.
(4) In the braking process, the coefficient of the fluid heat transfer system will change with the train speed, fluid motion state and fluid properties. If the convective heat transfer coefficient is expressed by H, the expression is


Relationship between convective heat transfer coefficient and vehicle speed.
It could be seen from Figure 8 that when the train speed decreases, the convective heat transfer coefficient also decreases. When the running speed is lower than 50 km/h, the change rate is larger. The increase in H-factor leads to an increase in thermal stress and a decrease in fatigue life.
Calculation of heat flux
If kinetic energy in the braking process is converted into heat energy, there is
The heat generation rate is obtained by deriving equation (17).

According to the brake disc size, train braking acceleration and other relevant parameters, as shown in Table 6.
Heat flux at speed of 250 km/h.

According to the data in Table 6, the change of heat flux during train braking is shown in Figure 9.

Heat flux variation of the brake disc.
It could be seen from Figure 9 that during train braking, the heat flux first decreases from a higher level and then increases slowly. When the train starts braking, the braking pressure exerted by the braking system is large. When the vehicle speed decreases, a small braking force is applied to ensure the safe operation of the train. Moreover, the heat generation is reduced, which is conducive to improving the service life of the brake disc.
Thermal stress analysis of the brake disc
There are two sources of stress on the brake disc: one is the thermal stress caused by the temperature gradient inside the brake disc. The other is the inertia force and braking pressure from the brake disc, as well as the random load brought by the track. According to relevant research, the internal thermal stress of the brake disc is much greater than that of the wheel rail and external environment. 7 Therefore, for the stress analysis of the brake disc, mainly considers the influence of thermal stress on the fatigue life of the brake disc.
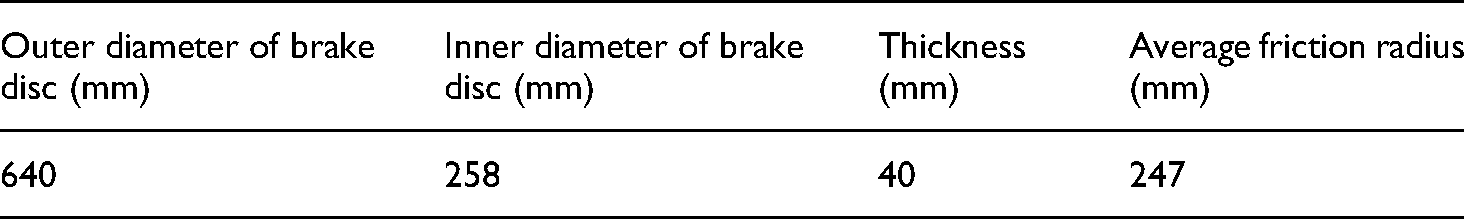
The brake disc material studied in this paper is 25Cr2MoV, and the dimension parameters of the brake disc are shown in Table 7. 44
Brake disc size parameters.
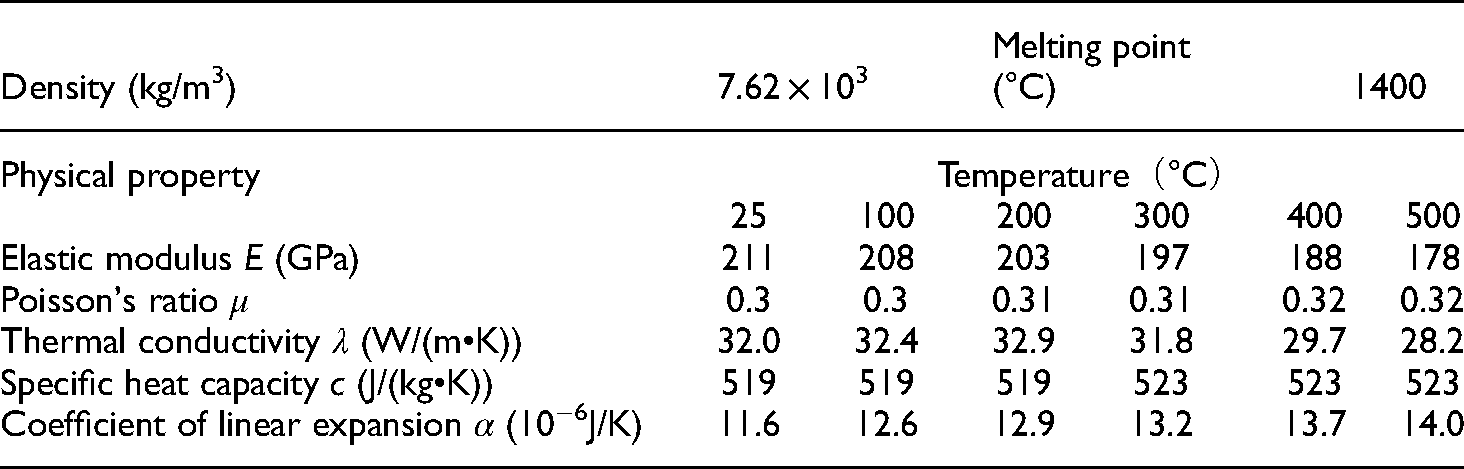
The material parameters of 25Cr2MoV are shown in Table 8. 43
Physical property parameters of 25Cr2MoV steel.
To study the temperature distribution on the surface of the brake disc, presents thermal sensors in bench tests may be used to acquire the temperature distribution on the surface of the brake disc. Then, the commonly applied numerical analysis approach is employed to investigate the brake disc's surface temperature distribution.
Some assumptions are made to perform numerical analysis.
The brake disc is in full contact with the friction plate; The braking pressure acting on the friction plate is evenly distributed; The wear of brake disc and friction plate is not considered;
This paper uses Abaqus 2020 software for numerical modeling and analysis. The surface temperature distribution of the brake disc could be obtained as shown in Figure 10.

Surface temperature distribution of brake disc.
For the brake disc studied in this paper, the initial speed of train braking is 250 km/ h and the initial temperature in the braking process is close to room temperature. The result in Figure 11 is the time at which the temperature difference reaches its maximum or the time at which the larger braking force is converted to a smaller braking force. It could be seen from Figure 10 that there are temperature gradients in different radius directions, which is the cause of thermal stress. Under the average friction radius, the maximum temperature is 479.1 °C. Along the radial direction of the brake disc, the temperature value shows a downward trend.
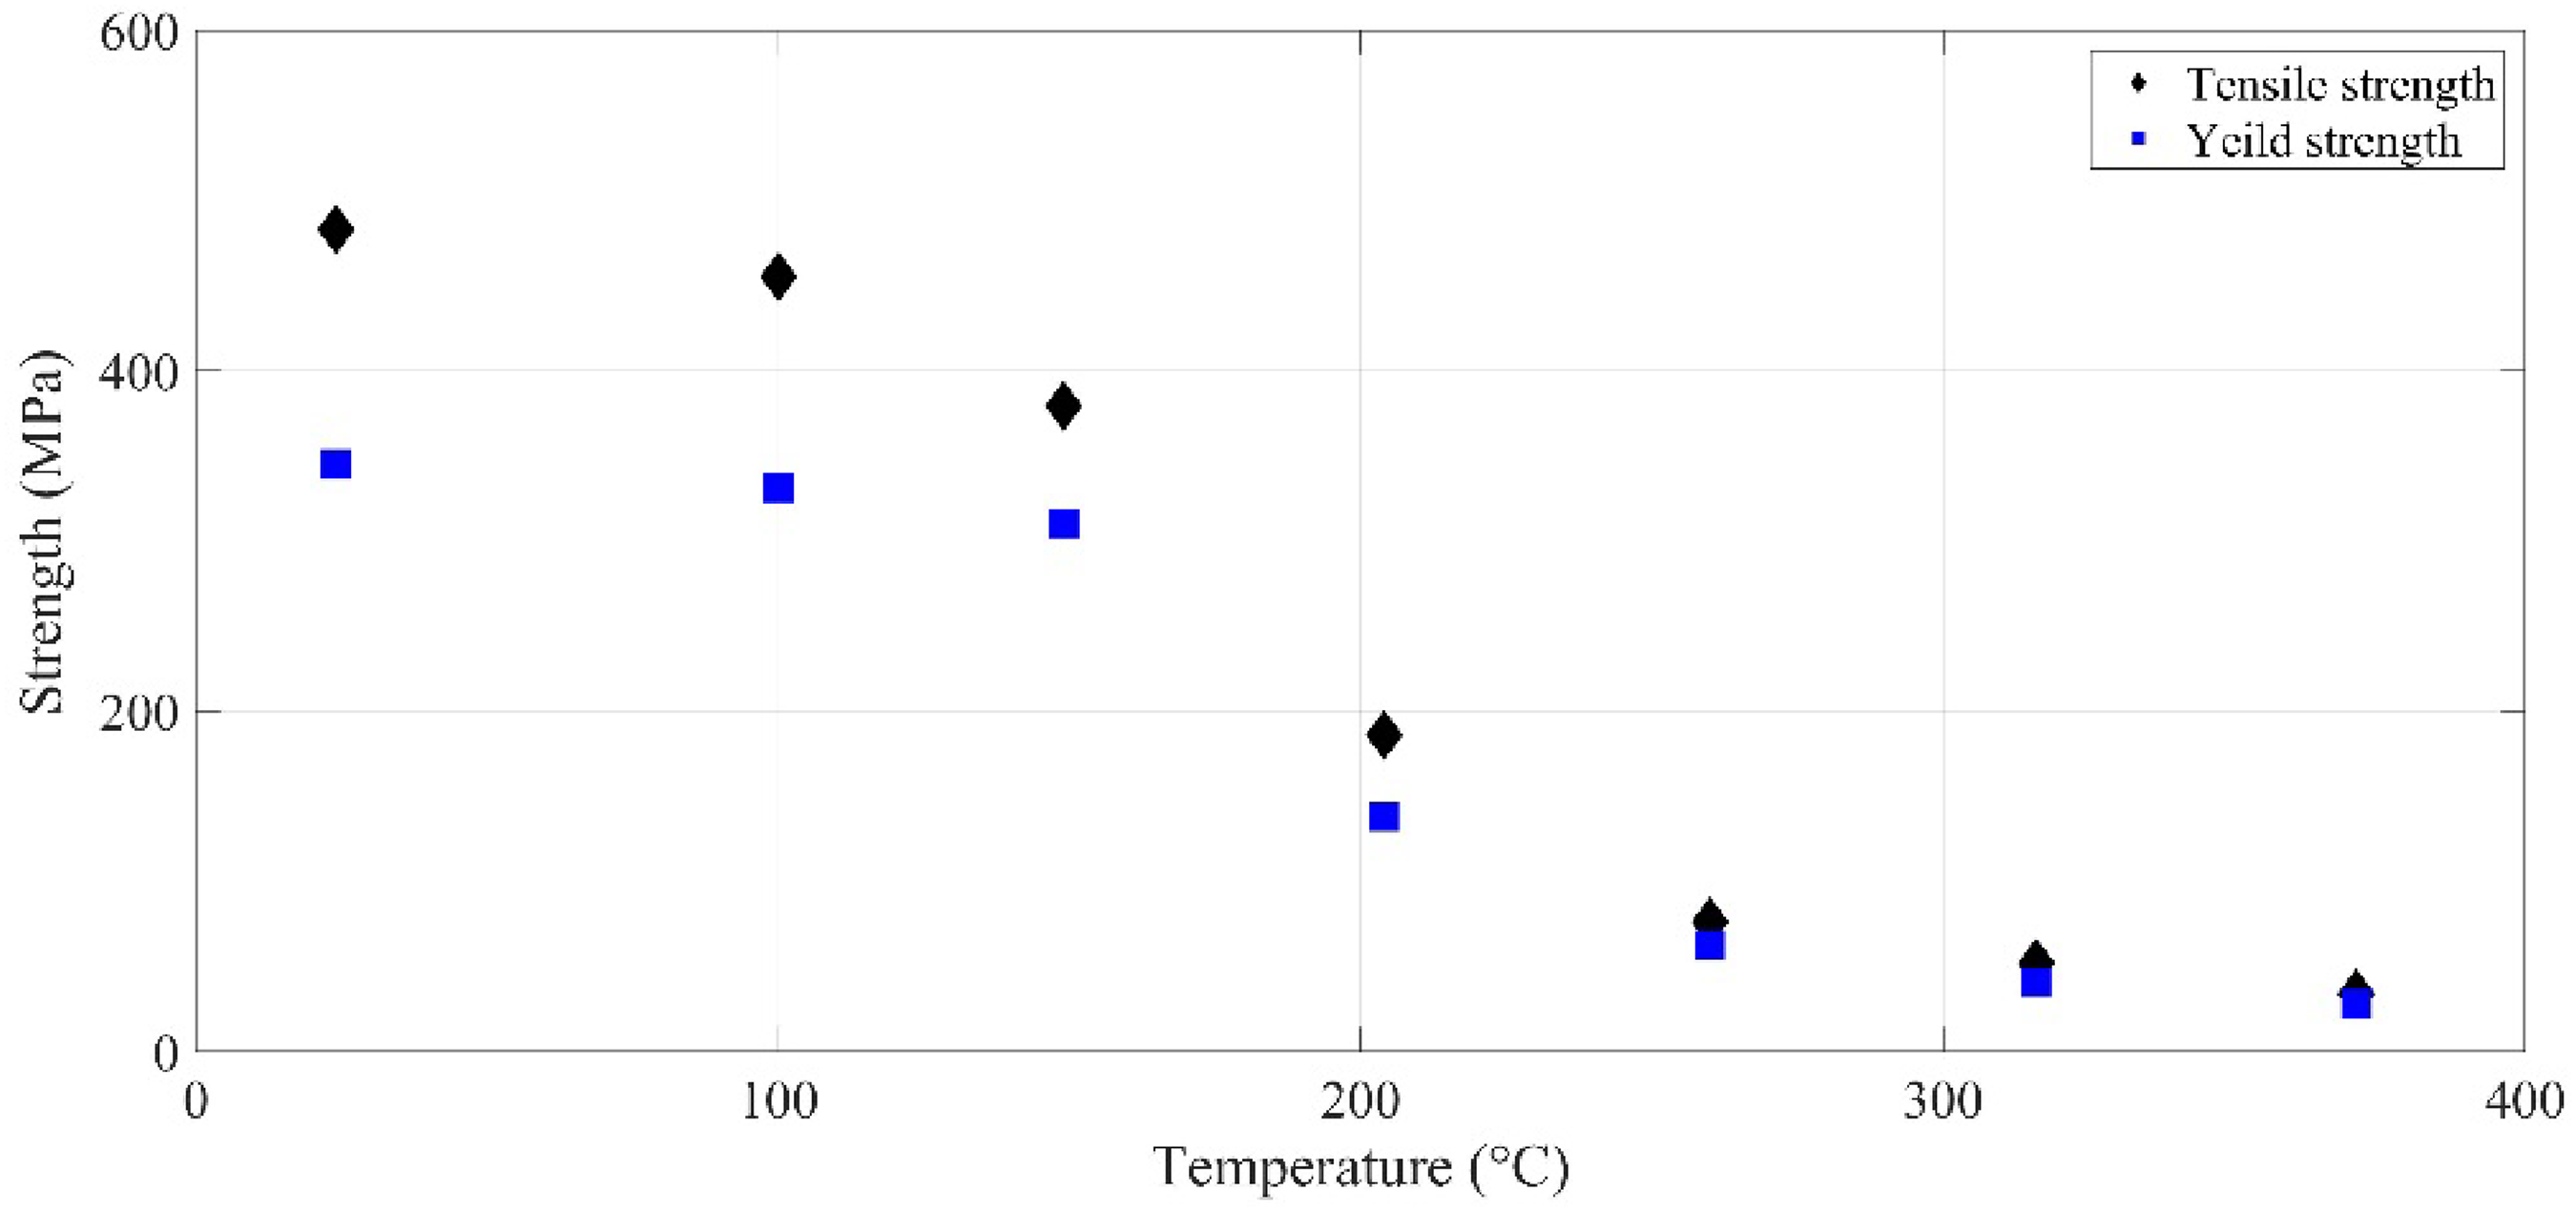
Fatigue strength of forged steel at different temperatures.
To analyze the fatigue performance of the brake disc under high temperatures more accurately, it is necessary to analyze the mechanical parameters of the brake disc material. The conventional mechanical properties and chemical composition of 25Cr2MoV are shown in Tables 9 and 10. 45
Chemical composition of 25Cr2MoV steel.

Conventional mechanical properties of 25Cr2MoV.

At different temperatures, the material parameters of the brake disc will change. The tensile strength and yield strength of forged steel change obviously with temperature, as shown in Figure 11. 37
It could be seen from Figure 11 that the fatigue strength of forged steel is greatly affected by temperature. When the temperature is lower than 200°C or higher than 400°C, the tensile strength and yield strength of forged steel decrease obviously with the increase of temperature. The decrease of the fatigue strength of the brake disc material will lead to plastic deformation inside the brake disc, which has a great influence on the service life of the brake disc. Therefore, it is necessary to study the temperature distribution of the brake disc in the braking process.
Thermal fatigue life of the brake disc
Through Basquin equation:

The S-N curve of 25Cr2MoV material is shown in Figure 12. 37

S-N curve of material 25Cr2MoV.
The regular operation of the brake disc is an important guarantee for the safe operation of the train. The existence of thermal stress accelerates the internal plastic deformation of the brake disc and accelerates the fatigue failure process of the brake disc. Therefore, to ensure the safety of train operation, it is necessary to analyze the service life of the brake disc. The load studied is mainly thermal stress. According to the brake disc material's S-N curve, combined with the brake disc model's numerical analysis, the number of cycles that the brake disc could withstand at different temperatures is obtained, as shown in Table 11.
Thermal stress at different temperatures.

It could be seen from Table 11 that the equivalent thermal stress is
Reliability analysis of the brake disc
In the design and production process of structure, it is necessary to analyze the reliability of products.47,48 Therefore, it is necessary to analyze the reliability of a high-speed brake disc. Based on the reliability theory, considering the influence of thermal stress on the fatigue life of the brake disc, a fatigue damage probabilistic model is established. On this basis, the service life of brake discs with different reliability is calculated.
Fatigue damage probabilistic model
From the perspective of probability and statistics, it is generally considered that the functional failure of structures or components is a random event. If the event A represents that component could work normally and the event B represents the component fails, the probability space of the component could be expressed by equation (21)


According to the linear fatigue damage theory, if


Reliable life prediction of the brake disc
If the component fails under k-level stress 


Assuming that the fatigue damage strength U satisfies lognormal distribution, assumed 


The obtained thermal stress is substituted into equation (38). Assuming that the train brakes 50 times a day and a year is regarded as 360 days, the fatigue life of the brake disc under different reliability could be obtained, as shown in Table 12 and Figure 13.

Fatigue life of brake disc under different reliabilities.
Fatigue life of brake disc under different reliabilities.

It could be seen from Table 12 that the calculated theoretical service life of a brake disc is 3.35 years while
Conclusions
The purpose of this study is to present a reliable life analysis method for high-speed train brake discs based on the collected load spectrum, which could be used to analyze the life and dependability of brake discs more systematically. The following summarises the paper's primary contents.
The frequency statistics of average amplitude and the probability distribution density function are used to fit the distribution features of the acquired load signals. The parameter and mileage methods are used to extrapolate the load signals, and the probability distribution density function is used to assemble the one-dimensional program spectrum. A three-dimensional model of the brake disc is created using the geometric parameters of the brake disc. Through thermodynamic theory and the application of boundary conditions, a numerical model of the brake disc is built, and the brake disc's surface temperature distribution is determined. Equivalent thermal stress is determined based on the numerical analysis results, laying the groundwork for reliable brake disc life prediction. The fatigue life of the brake disc is determined using the S-N curve of the brake disc material. The calculated results are verified by comparing them to the actual service life of forged steel brake discs. The fatigue damage probabilistic model of the brake disc is created using reliable life analysis methods and fatigue cumulative damage theory. The fatigue life of brake discs under various reliability conditions is predicted by considering the effect of thermal stress.
Footnotes
Author contributions
Conceptualization and methodology were performed by Jiao Luo and Jiazhi Liu, data curation was performed by Ziyun You, supervision was performed by Liu Xintian, reviewing and editing were performed by Jiazhi Liu. The first draft of the manuscript was written by Jiao Luo, and all authors commented on previous versions of the manuscript. All authors read and approved the final manuscript.
Data availability statement
Data sharing is not applicable to this article as no new data were created or analyzed in this study.
Declaration of conflicting interests
The author(s) declared no potential conflicts of interest with respect to the research, authorship, and/or publication of this article.
Funding
The author(s) received no financial support for the research, authorship, and/or publication of this article.
Author biographies
Jiao Luo is currently working as a lecturer of Mechanical engineering at Shanghai University of Engineering Science since 2010. Her research area is focused on fatigue life prediction and reliability design theory.
Jiazhi Liu is pursuing his Master’s degree at Shanghai University of Engineering Science. His research area is focused on fatigue life prediction and reliability design theory.
Ziyun You received his Master’s degree in vehicle engineering from Shanghai University of Engineering Science (China) in 2021. His research area is focused on fatigue life prediction and reliability design theory.
Xintian Liu is currently working as an associate professor of vehicle engineering at Shanghai University of Engineering Science (China) since 2007. His research area is focused on product quality control, fatigue life prediction and evaluation, uncertainty of mechanical system, reliability design theory and vehicle system dynamics.