
Abstract
Permissive hypercapnia is commonly used in mechanically ventilated patients to avoid lung injury but its effect on pulmonary artery pressure (PAP) is still unclear, particularly in combination with tidal volume (Vt). Therefore, an in vivo study was performed on adult rabbits ventilated with low (9 ml/Kg, LVt group) or high (15 ml/Kg, HVt group) tidal volume (Vt) and alterations in PAP were estimated. Both groups of animals initially were ventilated with FiO2 0.3 (Normocapnia-1) followed by inhalation of enriched CO2 gas mixture (FiCO2 0.10) to develop hypercapnia (Hypercapnia-1). After 30 min of hypercapnia, animals were re-ventilated with FiO2 0.3 to develop normocapnia (Normocapnia-2) again and then with FiCO2 0.10 to develop hypercapnia (Hypercapnia-2). Systolic, diastolic and mean PAP were assessed with a catheter in the pulmonary artery. In HP-1 and HP-2, PaCO2 increased (p < 0.0001) in both LVt and HVt animals compared to baseline values. pH decreased to ≈7.2 in HP-1 and ≈7.1 in HP −2. In normocapnia, the rise in Vt from 9 to 15 ml/Kg induced an increase in static compliance (Cstat), plateau airway pressure (Pplat) and PAP. Hypercapnia increased PAP in either LVt or HVt animals without significant effect on Cstat or Pplat. A two-way ANOVA revealed that there was not a statistically significant interaction between the effects of hypercapnia and tidal volume on mPAP (p = 0.76). In conclusion, increased Vt per se induced an increase in Cstat, Pplat and PAP in normocapnia. Hypercapnia increased PAP in rabbits ventilated with low or high Vt but this effect was not long-lasting.
Keywords
Introduction
The application of lung-protective mechanical ventilation with low tidal volumes (Vts) is a common clinical strategy applied to patients with respiratory diseases, like acute respiratory distress syndrome (ARDS), 1 exacerbation of asthma 2 or chronic obstructive pulmonary disease (COPD). 3 The practice of low tidal volumes aims to reduce stretch and shear forces to the alveolar wall and to protect lungs from trauma, but this ventilator strategy may result in hypercapnia (permissive hypercapnia).
Although protective lung ventilation with low Vts, leads to an improvement in patient outcomes,4,5 often causes hypercapnia with various physiologic effects, 6 beneficial or deleterious.1,7 Studies in animal models revealed that alterations in Vt seem to affect the release of pulmonary pro-inflammatory cytokines 8 and low Vt affects pulmonary vasomotor tone via inhibition of the expression of endothelin-1, endothelial nitric oxide synthase and tumor necrosis factor-alpha. 9 On the other hand, the consequence of hypercapnia on pulmonary artery pressure (PAP) is controversial and seems to depend on the tone of the vessels as well as on the species. Indicatively, in isolated rat pulmonary artery rings, hypercapnia was vasoconstrictor, by reducing nitric oxide production from the endothelium, 10 caused strong vasoconstriction in isolated cat lung preparations 11 and increased mean PAP and pulmonary vascular resistance in humans. 12 On the contrary, hypercapnia reduced hypoxia-induced pulmonary vascular resistance in juvenile rats 13 or rabbits. 14 Even more, until now is questionable if the effect of CO2 on pulmonary vessels is direct or is mediated via pH alterations, as pH per se may affect vascular tone. 15
As the effect of hypercapnia on pulmonary vessels remains still unclear, specifically in conditions of mechanical ventilation, in the present study we investigated the effect of hypercapnia combination with the use of low or high Vt on the PAP. For this purpose, an in vivo study was performed on anesthetized healthy rabbits, mechanically ventilated with low (9 ml/Kg) or high (15 ml/Kg) Vt under normocapnic and hypercapnic conditions. Although lower tidal volume ventilation has a beneficial effect and improves survival in mechanically ventilated patients, hypercapnia and acidosis might be associated with adverse clinical outcomes and requires optimum management.16,17 In an attempt to mimic clinical practice, in the present study we investigated the effect of preconditioning (an initial episode of hypercapnia, combined with Vt) on PAP in following hypercapnic episodes after the mediation of normopoxia lasting 30 min.
Materials and methods
Overall, twenty-eight adult male New Zealand white rabbits, with mean weight (SD) 3.00 (0.54) Kg, were used in the experiments; two of them died during procedures; deaths were attributed to anesthesia induction or to pneumoperitoneum in one case and occurred early during experiments before the application of any experimental condition. Animals received human care and experiments were performed in accordance with the European Community and NIH guidelines for using experimental animals. All procedures were approved by our institution's Animal Studies Committee [EL 42 BIO 04]. The rabbits were housed in individual cages at a constant ambient temperature with a 12-h light and dark cycle.
Animals were anesthetized with the administration of 100 mg ketamine intramuscularly and of midazolam intravenously at a rate of 0.1–0.2 mg/kg/h. Once the anesthesia took effect, a peripheral vein cannula was inserted and administration of 0.9% Normal Saline, 15 ml/h, was commenced. Tracheostomy was performed based on previous reports 18 and the animals were subsequently endotracheally intubated and subjected to neuromuscular blockade with 1 mg cis-atracurium intravenously and thereafter anesthesia and muscle relaxation were maintained with periodic intravenous infusions of midazolam and cis-atracurium to ensure sedation and muscle relaxation and to prevent spontaneous efforts. Spontaneous efforts were detected using the flow pressure curves on the ventilator screen. Animals were mechanically ventilated with a ventilator (Evita 2 dura, Dräger Medical GmbH, Germany) until stable respiratory conditions with a volume-controlled mode: ventilated with a fraction of inspired oxygen (FiO2) 0.3, frequency 35–45 cycles/min, Vt 9 ml/Kg and positive end-expiratory pressure (PEEP) 2 cmH2O.
Subsequently, the femoral artery was exposed and cannulated and the right jugular vein was prepared; the pulmonary artery was cannulated based on previously described techniques.19–21 Briefly, an angled polypropylene introducer made from standard tubing 15 cm long, external diameter 3 mm and lumen diameter 2 mm was used. The distal 1.5 cm was heat angled at 90 degrees to the shaft and a marker was made to indicate the direction of the angle. The introducer was filled with heparinized saline and a No. 4.5 French gauge right side coronary angiography catheter - which has its tip angled - was inserted so that the tip lay just inside the distal end of the introducer. The catheter was then filled with heparinized saline and was connected to a pressure transducer. Following the exposure of the right jugular vein, the introducer-catheter assembly was inserted and passed into the right ventricle through the superior vena cava and the right atrium using the pressure signals for guidance. Correct placement in the right ventricle was confirmed by the pressure signal and then the angled tip was rotated to point anteriorly and slightly to the left and was withdrawn until the angle impinged on the tricuspid valve. One ml of cold saline was flushed through the catheter and the catheter was advanced to pass directly into the pulmonary artery. Correct placement was confirmed by the change in the pressure signal. 22
Samples of arterial blood were obtained from the femoral artery (0.5 ml of arterial blood was discarded and 0.3 ml was sampled) for blood pH and gas measurements (RAPIDlab 1265, Siemens Healthcare Diagnostics Inc., USA). End-expiratory carbon dioxide was continuously monitored using a capnograph (CO2SMO MONITOR, Respironics, USA) adapted to the endotracheal tube. The animals were ventilated with the aforementioned baseline settings to obtain stable physiological conditions (end-tidal CO2 ranged between 33–43 mmHg) and then were randomly assigned into two groups based on ventilation settings and inhaled gas mixtures. One animal group was ventilated with 9 ml/Kg (low Vt - LVt) and the other with 15 ml/Kg (high Vt-HVt). The choice of Vt was based on previous in vivo studies in rabbit 23 reporting similar tidal volumes as moderate and large respectively. Respiratory frequencies were titrated accordingly in order to obtain the normocapnic baseline conditions. A respiratory frequency of 35 was set in the HVt group or 45 in the LVt respectively, titrated in each case according to end-tidal CO2/CO2 levels. For both groups, FiO2 was 0.3 (Normocapnic Phase-1, NP-1, Figure 1). To develop hypercapnia, animals of each Vt group inhaled an enriched in CO2 gas mixture via connection to the respirator of a gas cylinder prefilled CO2 gas mixture (FiO2 0.3, FiCO2 0.10). The partial pressure of CO2 of arterial blood (PaCO2) was targeted between 70–90 mmHg (Hypercapnic Phase-1, HP-1, Figure 1). The animals then were re-ventilated with FiO2 0.3, FiCO2 (Normocapnic Phase-2, NP-2, Figure 1) and were re-exposed to enriched in CO2 gas mixture (FiO2 0.3, FiCO2 0.10) to assess the impact of hypercapnic preconditioning in pulmonary pressure (Hypercapnic Phase-2, HP-2, Figure 1). All animals were exposed to each setting for 30 min to obtain a stable condition before measurements and between different conditions were ventilated with the baseline settings for 30 min. minimum time necessary to obtain stable conditions based on preliminary experiments. At the end of the experiments, animals were sacrificed by IV administering of potassium chloride 5% while they were still under anesthesia.
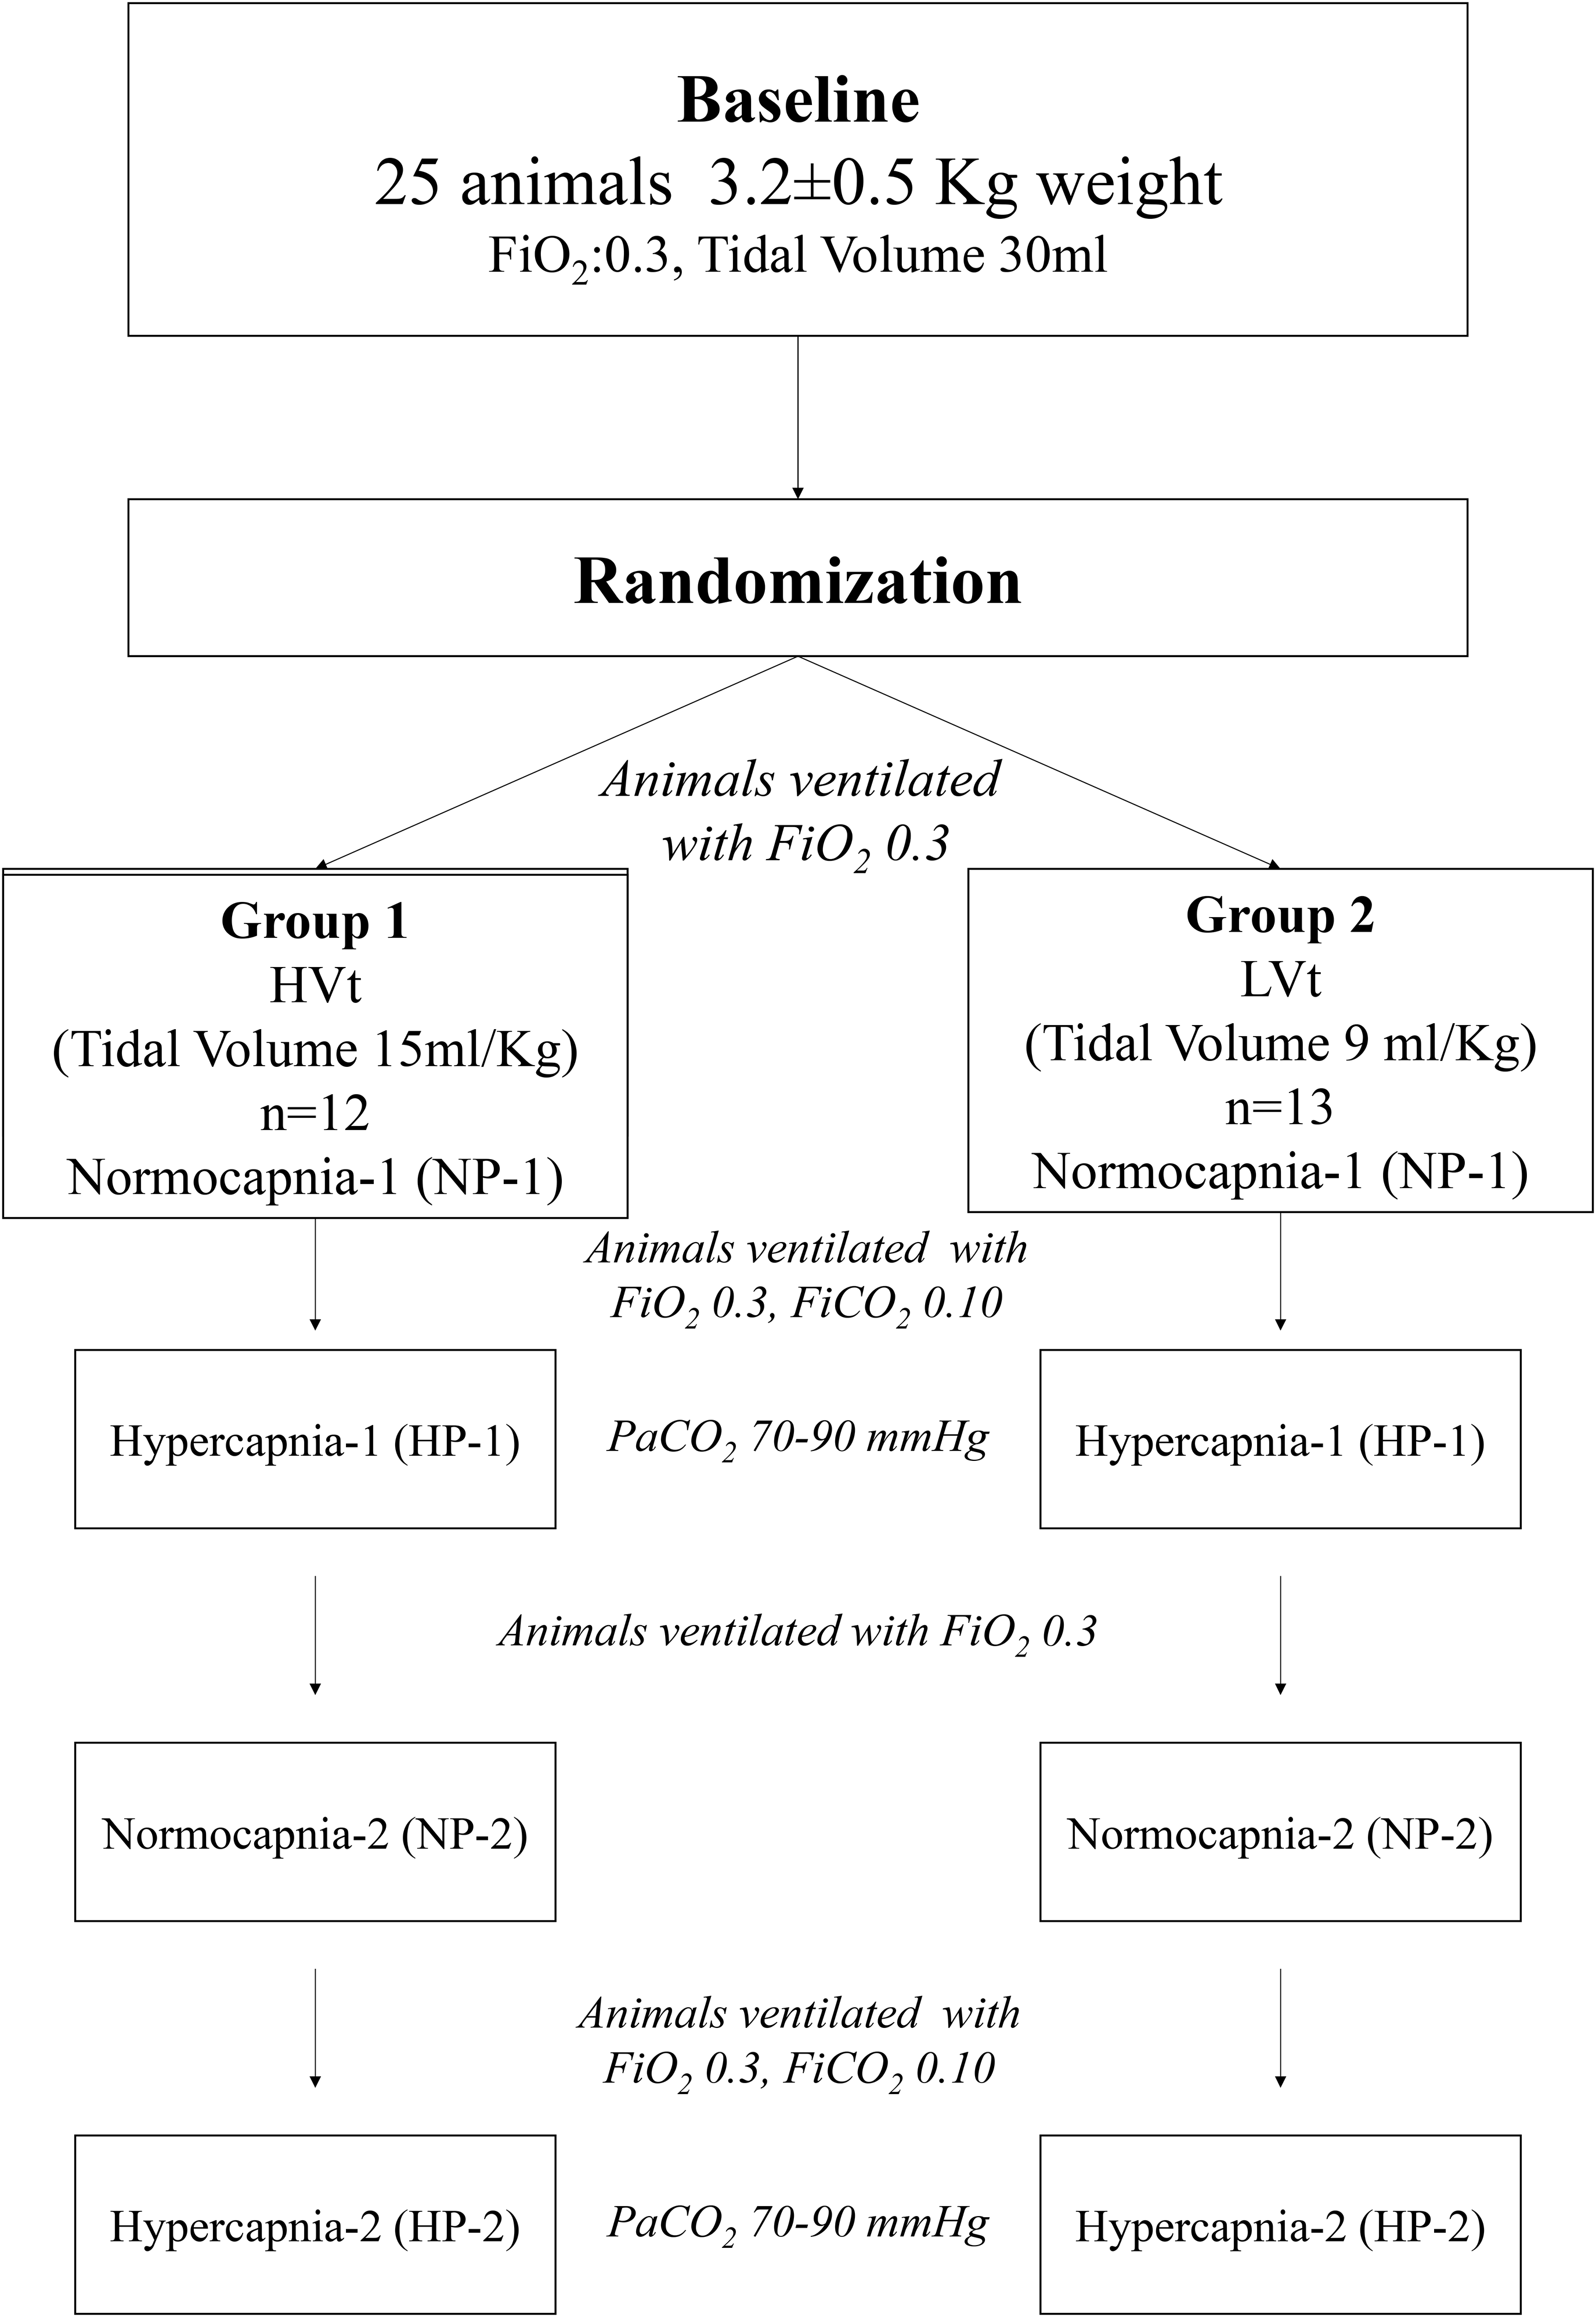
Flowchart of the study.
Systolic (sPAP), diastolic (dPAP) and mean (mPAP) pulmonary artery pressure were recorded at expiration and were measured with piezo pressure transducers integrated in a polygraph system (RM6000; Nihon Kohden, Tokyo, Japan). The pressure transducer was calibrated immediately before, after, and when necessary, during each procedure. Airway pressures were assessed from the curves obtained on the ventilator screen. To assess plateau airway pressure (Pplat) we used the inspiratory hold button of the ventilator for a 4 s period; PEEP levels were assessed by using the expiratory hold button of the ventilator to perform end-expiratory airway occlusion. To evaluate whether the mechanical properties of the lung remained intact, we measured respiratory system and lung compliance. To calculate the static compliance of the respiratory system (Cstat), end-inspiratory occlusion was repeated three times. Each occlusion was held for 4 s Cstat was calculated as:
Cstat = Vt/(Pplat –PEEP)
Where, Vt = Tidal Volume, Pplat = Plateau pressure, PEEP = Positive End Expiratory Pressure
In three animals, the heart and the lungs were exposed for assessment of the mechanical properties of the exposed lungs and for macroscopic inspection of the placement of the catheter. Mechanical properties of the exposed lungs were calculated in different volumes beginning at a low volume (10 ml) and reaching volumes close to total lung capacity (80 ml) (Figure S1).
The effect of hypercapnia or Vt on pulmonary artery pressures (systolic, diastolic and mean) was the primary outcome of this investigation.
Statistics
All data are expressed as means ± standard deviation (SD) and n refers to the number of animals. The data were analyzed for normality with the Shapiro-Wilk test and the effect of Vt, Hypercapnia and their interaction on mPAP was assessed by two-way ANOVA. A comparison is considered significant when p < 0.05. The statistical analysis was performed using GraphPad Image v5 (GraphPad Software, San Diego, CA, USA).
Results
Effect of hypercapnia on PaO2, PaCO2, pH, heart rate, plateau airway pressure and static compliance
As expected, during hypercapnia −1 and −2, partial pressure of CO2 of arterial blood (PaCO2) increased significantly (p < 0.0001) in both LVt and HVt groups compared to baseline values but did not differ significantly between the two groups (Table 1). On the other hand, partial pressure of O2 of arterial blood (PaO2) did not alter significantly in all experimental settings. pH values decreased during hypercapnia, in both setting hypercapnia −1 and −2 in either LVt and HVt groups, although these changes are not statistically significant compared to baseline values (Table 1).
Pao2, PaCO2, pH and heart rate values during different settings in animals ventilated with low, 9 ml/Kg (LVt, n = 13) or high, 15 ml/Kg (HVt, n = 12) tidal volume.

Values are presented as mean (SD). ****p < 0.0001 compared to the corresponding values at baseline.
In normocapnia, the static compliance (Cstat) was 3.22 ± 0.43 and 3.68 ± 0.31 ml/cm H2O in LVt and HVt groups respectively with no significant differences between the groups (Figure 2(a)). On the other hand, plateau airway pressure (Pplat) was increased significantly (p = 0.002) in HVt animals compared to LVt (Figure 2(b)). Pplat values were 10.23 ± 1.79 ml/cm H2O in LVt and 11.82 ± 1.19 ml/cm H2O in HVt animals. Both Cstat and Pplat did not alter significantly during the experimental procedure (data not shown).

Tidal volume effect on (a) static compliance (cstat) and (b) plateau airway pressure (pplat) under normocapnia conditions in animals ventilated with 9 ml/Kg (LVt) or 15 ml/Kg (HVt) tidal volume.
Tidal compliance of exposed lungs was calculated in three rabbits and was 4.3 to 6.0 ml/cm H2O.
Effect of hypercapnia on pulmonary artery pressures in LVt and HVt animals
In either LVt or HVt animals, hypercapnia increased significantly (p < 0.05) pulmonary artery pressure (sPAP, dPAP and mPAP) compared to normocapnic conditions (Figure 3, Table 2). Interestingly, the use of higher tidal volumes (15 ml/Kg) in normocapnic conditions resulted in a significant increase in all PAP compared to animals ventilated with 9 ml/Kg Vt (Table 2). These significant differences in all PAP observed in normocapnia remained and in hypercapnic conditions (Table 2) as animals ventilated with 15 ml/Kg (HVt) presented significantly higher sPAP, dPAP and mPAP compared to animals ventilated with 9 ml/Kg (LVt). Two-way ANOVA showed a significant effect of hypercapnia or Vt on mPAP (p = 0.0005 and p = 0.0008 respectively) but no significant hypercapnia-Vt interaction (p = 0.75)

Compared to normocapnia (NP-1), hypercapnia (HP-1) increased systolic pulmonary artery pressure (sPAP) in animals ventilated with 9 ml/Kg (a) or 15 ml/Kg (b) tidal volume, diastolic pulmonary artery pressure (dPAP) in animals ventilated with 9 ml/Kg (c) or 15 ml/Kg (d) tidal volume and mean pulmonary artery pressure (mPAP) in animals ventilated with 9 ml/Kg (e) or 15 ml/Kg tidal volume (f).
Systolic (sPAP), diastolic (dPAP) and mean (mPAP), values during different settings in animals ventilated with low, 9 ml/Kg (LVt, n = 8) or high, 15 ml/Kg (HVt, n = 8) tidal volume.

Values are presented as mean (SD), p for comparisons between LVt and HVt groups. *p < 0.05 for comparison between normocapnia-1(NP-1) and hypercapnia-1(HP-1) in the same animal group.
Effect of preconditioning on pulmonary artery pressures
After the first episode of hypercapnia (Hypercapnia −1, HP-1) both LVt and HVt animals were ventilated with FiO2 0.3 for 30 min (Normocania-2, NP-2) and then were exposed to FiO2 0.3/FiCO2 0.10 to assess a second episode of hypercapnia (Hypercapnia-2, HP-2). No statistically significant differences in pulmonary artery pressures (sPAP, dPAP or mPAP) were observed between values obtained under NP-1 and NP-2 conditions or during HP-2 compared to HP-1 (Table 3).
Systolic (sPAP), diastolic (dPAP) and mean (mPAP), values during different settings in animals ventilated with low, 9 ml/Kg (n = 8) or high, 15 ml/Kg (n = 8) tidal volume.

Values are presented as mean (SD), *p < 0.05, **p < 0.001 and ***p < 0.001 for comparison between animal groups.
Discussion
The main finding of this in vivo study was that the increase in tidal volume, hypercapnia or the combination of the two resulted in a significant increase in systolic, diastolic and mean pulmonary artery pressure. Previous animal exposure to hypercapnic conditions (preconditioning) did not protect the animal from the development of high pulmonary artery pressure when re-exposed to hypercapnia. Both animal groups (LVt and HVt) developed acidosis during the first episode of hypercapnia (HP-1, pH ≈7.2) and pH reduction was more prominent at the second hypercapnic episode (HP-2, pH ≈7.1). Therefore, the rise in PaCO2 and/or acidosis may be implicated in the increase of PAP observed in hypercapnia.
At baseline, pulmonary artery pressure (sPAP, dPAP and mPAP) was at levels similar to those reported in other studies in rabbits.24,25 In this study, we assessed PAP at two different Vt (9 and 15 ml/Kg) aiming to simulate the clinical scenario in humans where low or high Vt may produce different levels of stress in the pulmonary vasculature.26,27 In normocapic conditions, the increase of Vt from 9 to 15 ml/Kg affected plateau airway (Figure 2(b)) and pulmonary (Table 2) pressure with no statistically significant effect on static compliance (Figure 2(a)). Our results suggest that in mechanical ventilation, Vt alone may be a significant parameter affecting PAP. Similar results were obtained from ex-vivo studies on isolated-perfused rabbit lung model showed that ventilation with high pressure increased mean PAP. 28 Although it is well known that high Vt may cause lung injury, 29 little is known about the mechanisms involved in the immediate effect of Vt on PAP. Studies on rat isolated pulmonary artery showed that high Vt may induce endothelium dysfunction. 30 The hemodynamic effects of Vt are attributed to changes in pleural and transpulmonary pressure which among others may increase PAP. 31 On the other hand, the relationship between PaCO2 alone or in combination with Vt and PAP is not clear, particularly in mechanical ventilation. In our study, hypercapnia (PaCO2 = 81.3 ± 8.2 mmHg vs PaCO2 = 37.7 ± 5.0 mmHg) induced an increase in PAP (Figure 3) without significant effect on arterial pressure and heart rate. Even more, hypercapnia-induced increase in PAP was more noticeable in HVt animals (Table 2). As animals exhibited acidosis during hypercapnia (Table 1) both the rise in PaCO2 or/and the decrease in pH may be responsible for the rise in PAP. Studies on isolated ventilated-perfused rabbit lung, hypercapnia affected pulmonary vascular tone only in hypoxic conditions, as no alteration in pulmonary vascular tone was noted during normoxic hypercapnia with or without acidosis compared with normoxic normocapnia. 32
An increase in PAP could be due to the rise of pulmonary vascular resistance, lung volume or cardiac output. Studies on isolated hearts clearly showed a direct depressive effect of high CO2 on cardiac function, however, in vivo studies suggest that hypercapnia may cause transient or minimal effects on cardiac output.12,33 Acute hypercapnia or/and respiratory acidosis may affect myocardial contractility via adrenal release of catecholamines. 34 According to our results (Table 1), systemic blood pressure and heart rate did not significantly alter during hypercapnia. Although we did not evaluate the cardiac output directly, the above indirect evidence suggests that the effect of hypercapnia and/or acidosis on PAP might not be due to an increase in cardiac output. Regardless of cardiac output, change in lung volume associated with ventilation can alter PAP as it affects pulmonary vascular resistance and elastance. 35 In consistent with our findings, in normocapnic conditions, in HVt rabbits, PAP increased compared to LVt animals (Table 2). However, we found no statistically significant difference in the static compliance of the respiratory system between hypercapnic and normocapnic conditions and CRSstat values were similar to previous observations in rabbits. 23 Though we did not investigate the mechanism(s) involved in the hypercapnia-evoked increase of PAP, we assume that most possibly hypercapnia affected pulmonary vascular resistance. Data from several animal studies on isolated pulmonary artery8,36 or lung preparations11,37,38 revealed that elevated CO2 alone or/and acidosis induced vasoconstriction. Interestingly, data available from animal studies suggest that hypercapnia may produce pulmonary vasodilatation when the vascular tone is increased due to hypoxia or vasoconstrictive agents.39,40
Finally, we investigated if hypercapnic preconditioning has an impact on PAP. In our experimental procedure (Figure 1), after the first exposure to hypercapnia (HP-1), animals were re-ventilated with increased FiCO2 0.3 and after 30 min a new hypercapic episode occurred (HP-2). We found no statistically significant differences in mPAP between HP-1 and HP-2. These results suggest that the effect of hypercapnia does not cause long-term changes in PAP.
In conclusion, the present in vivo study suggests that hypercapnia increased pulmonary artery pressures in rabbits ventilated with low or high Vt. Increased Vt per se induced increased pulmonary pressure but in combination with hypercapnia this increase is more noticeable. Although we must extrapolate with caution our findings to clinical practice, the common practice to use low Vt in mechanical ventilation is protective and could prevent pulmonary hypertension.
Supplemental Material
sj-pptx-1-sci-10.1177_00368504221094161 - Supplemental material for Elevated PaCO2 levels increase pulmonary artery pressure
Supplemental material, sj-pptx-1-sci-10.1177_00368504221094161 for Elevated PaCO2 levels increase pulmonary artery pressure by Apostolos Triantaris, Isaak Aidonidis, Apostolia Hatziefthimiou, Konstantinos Gourgoulianis, Georgios Zakynthinos and Demosthenes Makris in Science Progress
Footnotes
Declaration of conflicting interests
The authors declare that there is no conflict of interest.
Funding
The authors received no financial support for the research, authorship, and/or publication of this article.
Author contributions:
D. Makris, conception and design of research
A. Triantaris, I. Aidonidis and D. Makris performed experiments
A. Triantaris, A. Hatziefthimiou and D. Makris analyzed data, interpreted results of experiments, prepared figures and drafted manuscript
A. Triantaris, A. Hatziefthimiou, D. Makris, I. Aidonidis, K. Gourgoulianis and G. Zakynthinos edited manuscript
All the authors approved the final version of manuscript
Supplemental material
Supplemental material for this article is available online.
Abbreviations
References
Supplementary Material
Please find the following supplemental material available below.
For Open Access articles published under a Creative Commons License, all supplemental material carries the same license as the article it is associated with.
For non-Open Access articles published, all supplemental material carries a non-exclusive license, and permission requests for re-use of supplemental material or any part of supplemental material shall be sent directly to the copyright owner as specified in the copyright notice associated with the article.