
Abstract
Objective
To evaluate the technical performance and patient-ventilator synchronization of different invasive mechanical ventilators.
Methods
Six ventilators were tested using the ASL5000 active lung simulator. Ventilators were categorized by air supply type: central (Dräger V600, Maquet Servo-u, Mindray SV800) and turbine-based (Savina 300, SV300, Resvent RS300). The measured parameters included tidal volume (VT), plateau pressure (Pplat), positive end-expiratory pressure (PEEP), peak pressure (Ppeak), time to reach 90% of inspiratory pressure (T (90%)), triggering delay (DT), and leak compensation. Ventilators were evaluated in volume assist-control (V-A/C), pressure assist-control (P-A/C), and pressure support ventilation (PSV) modes under acute respiratory distress syndrome (ARDS) and chronic obstructive pulmonary disease (COPD) conditions using ASL5000™ lung simulator, with or without intentional leak (4.4 L/min). For each ventilator under these different conditions, we analyzed pressurization accuracy, VT accuracy, inspiratory muscle effort, and response efficiency.
Results
The pressurization accuracy of ventilators with central air supply did not differ significantly from that of turbine-driven ventilators during V-A/C and P-A/C ventilation, irrespective of spontaneous breathing or air leakage. The mean absolute errors of target VT were 8.9% (V600), 10.3% (Servo-U), 14.4% (SV800), 4.6% (Savina300), 18.8% (SV300), and 19.9% (RS300), and ventilators with central air supply generally have better VT accuracy, except for Savina300 (P<0.05). In V-A/C with different triggers and leaks, Savina 300 showed comparable stability and accuracy to central air supply ventilators in the ARDS lung model. Significant differences in VT accuracy and PEEP were observed among ventilators (P<0.05). During PSV, V600 and Servo-u exhibited shorter response efficiency than SV800 under identical simulated patient effort (P<0.05), suggesting faster and easier patient support.
Conclusions
The Savina 300 alone matched or exceeded central air supply models in pressurization and VT accuracy. In terms of inspiratory trigger performance, the V600 and Servo-u demonstrated better patient-ventilator synchrony than the SV800 under PSV mode.
Introduction
Invasive mechanical ventilators are essential medical devices in numerous clinical departments. For patients with unstable vital signs, invasive mechanical ventilation frequently serves as the primary and most critical life-sustaining intervention. Rapidly establishing a patent airway and promptly correcting hypoxia can significantly improve patient survival.1,2 Therefore, improving the performance and clinical utility of invasive mechanical ventilators remains critically important.
Advances in technologies such as solenoid valves, pistons, turbines, and Venturi tubes have contributed to the performance improvement of invasive mechanical ventilators. For example, first-generation ventilators, available in the 1940s and 1950s, could only provide volume-controlled ventilation and lacked patient-triggered ventilation modes.3,4 The second-generation ventilators incorporated patient-triggered inspiration, but offered only volume-controlled ventilation. 5 The third-generation ventilators incorporated microprocessor control, enabling various modes of gas delivery—such as pressure support, pressure control, and volume control—along with comprehensive monitoring. 6 The fourth-generation ventilators which also represent current generation ventilators were the most complex and versatile. 7 Currently, three characteristics were usually considered in assessing the performance of ventilators.8–10 The first metric is the VT accuracy and PEEP during assisted controlled ventilation; these parameters were associated with a reduced duration of mechanical ventilation and lower mortality in patients with acute respiratory distress syndrome.3,11 The second metric is the ability of leak compensation.12,13 The third metric is the triggering and pressurization performance of autonomous breathing patients receiving PSV, which affects the asynchrony between the patient and the ventilator.14,15 Several studies have compared the performance of different ventilators. De Luca et al. evaluated multiple devices under continuous positive airway pressure (CPAP), assessing mechanical performance metrics such as oxygen consumption, noise, airway dryness, and contamination risk. Their findings demonstrated that a closed configuration employing a helmet interface performed similarly to the conventional open configuration with a mask interface, supporting its clinical applicability. 16 Arnaud et al. compared four turbine-based ventilators with nine conventional compressed-gas ventilators using a two-compartment lung model under pressure support ventilation. The turbine-based models demonstrated superior trigger function, pressurization capacity, and expiratory resistance. 17 Caillard et al. compared eight ventilators operating in non-invasive mode, finding that most recent ICU ventilators were less efficient than dedicated non-invasive ventilators in terms of pressure-time product and Asynchrony Index. However, technical performance varies with both the respiratory disease and the level of air leakage. 18 Richard et al. reported that while VT accuracy differed significantly (P=0.0498) among new generation ventilators, no significant differences were observed in pressurization accuracy or triggering performance. 19 However, the triggering function, pressure delivery capacity, and expiratory resistance of newer generation ventilators vary considerably, and these differences are not yet fully characterized. This lack of comprehensive data necessitates caution in their clinical application. 19 A precise evaluation of widely used invasive mechanical ventilators is therefore needed to clarify their respective strengths and limitations. This study focuses on the efficiency of ventilators with an integrated turbine air supply and those connected to a central medical air supply. We comprehensively assessed the technical performance and patient-ventilator synchronization of these two ventilator types using a breathing simulator under volume assist-control (V-A/C), pressure assist-control (P-A/C), and pressure support ventilation (PSV) modes. This evaluation aims to provide clinicians with reliable data to inform ventilator use and support clinical decision-making.
Materials and methods
Ventilators
Six invasive mechanical ventilators were involved in the study. All ventilators were provided free of charge by manufacturers: Dräger V600 (Lubeck, Germany), Dräger Savina 300 (Lubeck, Germany), Maquet Servo-U (Göteborg, Sweden), Mindray SV800 (Shenzhen, China), Mindray SV300 (Shenzhen, China) and Resvent RS300 (Shenzhen, China). Among these ventilators, Savina300, SV300 and RS300 use turbine’s supply of medical air. Additionally, V600, Servo-U and SV800 use center’s supply of medical air. All devices were provided by manufacturers and calibrated prior to testing.
Lung model
ASL5000™ lung simulator (Ingmar, Pittsburgh, PA, USA) was used configured to mimic ARDS (compliance 20 mL/cmH2O, resistance 5 cmH2O/L/s) and COPD (compliance 50 mL/cmH2O, resistance 10 cmH2O/L/s). The ASL5000 enables precise, programmable control of patient respiratory effort, which allows for the reproducible assessment of ventilator trigger performance under dynamic conditions. To simulate respiratory drive, the system was programmed to generate negative pressure swings in the artificial airway during inspiration, thereby mimicking diaphragmatic contraction. Testing was conducted at 22°C ambient temperature, with simulator temperature maintained at 37°C. All measurements were converted to body temperature pressure saturated conditions.3,20 The ventilator was connected in series with a breathing valve, a leak device (when applicable; fixed leakage: 4.4 L/min), and the ASL5000 lung simulator using standard disposable corrugated tubing. The breathing valve ensures unidirectional gas flow by separating inspiratory and expiratory pathways, preventing gas mixing and reflux. For tests conducted under leak conditions, a customized leakage device was inserted between the breathing valve and the ASL5000 simulator (Figure 1(a)), while it was omitted for the no-leak condition (Figure 1(b)). During testing, the ASL5000’s internal data were transmitted to a computer via a USB cable and saved for subsequent analysis. Respiratory rates were set to 30/min for ARDS and 15/min for COPD. The duration of increased respiratory exertion comprised 15% of the respiratory cycle. Four levels of respiratory drive were also established. The complete parameter set for the ASL5000 simulator is provided in Table 1. The connection of the testing devices. (a) The connection with leakage; (b)The connection without leakage. Parameters set up in ASL5000.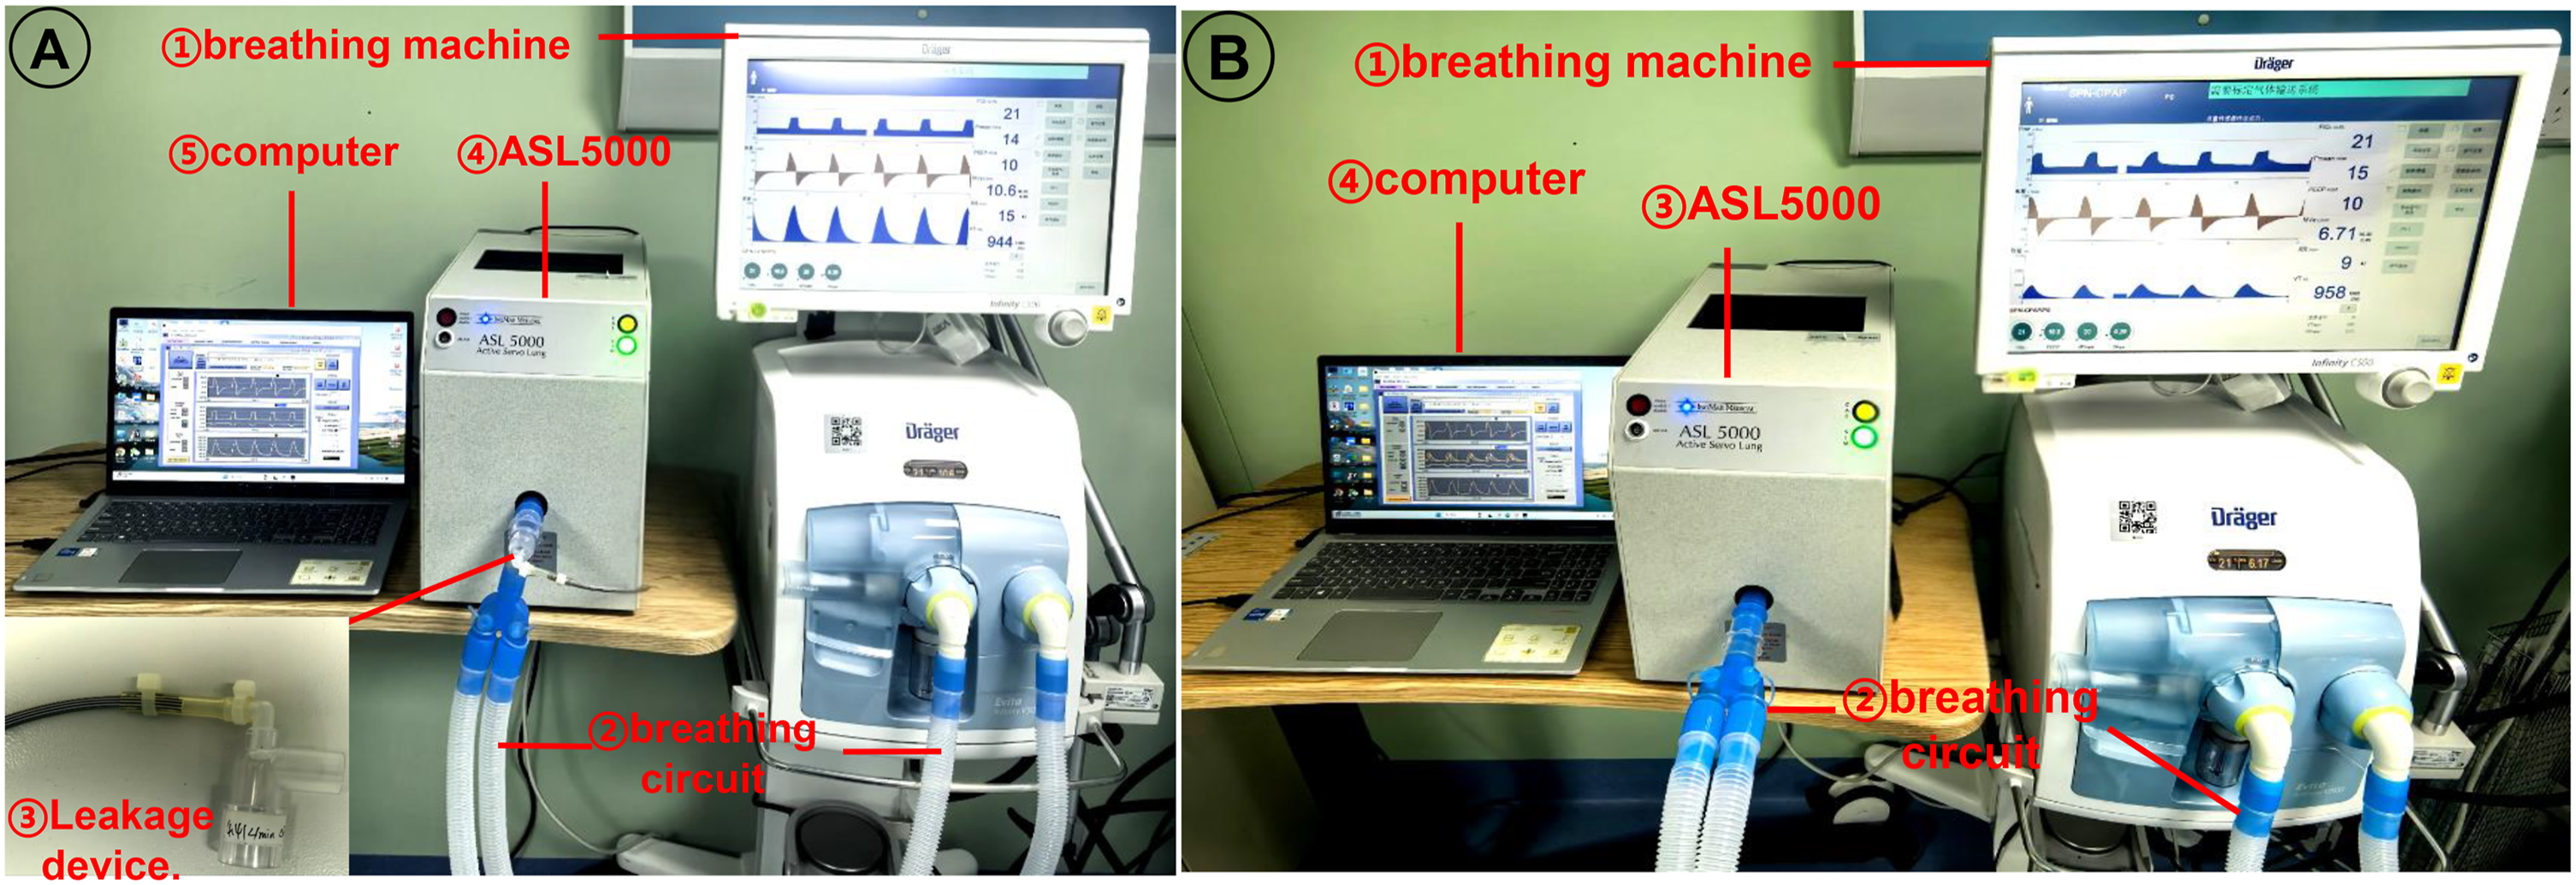

Design of the experiment
Each ventilator was tested in V-A/C, P-A/C, and PSV modes. For the V-A/C and P-A/C conditions, three levels of tidal volume, inspiratory pressure (Pinsp), and PEEP were evaluated: 200, 300, and 400 mL; 20, 30, and 40 cmH2O; and 5, 10, and 15 cmH2O, respectively. 19 The inspiratory time was set to 1 second. In V-A/C mode with this inspiratory time, an end-inspiratory pause of 0.4 seconds was incorporated at a tidal volume of 200 mL, and a 0.1-second pause at 300 mL, both within the designated inspiratory period. No inspiratory pause occurred at a tidal volume of 400 mL. These pause settings were used to stabilize airway and plateau pressures, thereby ensuring consistent ventilation under controlled conditions. The FIO2 was 21% and the pressure rise time was minimized to 0.1 seconds. For PSV, to better simulate realistic lung mechanics, three levels of pressure support (5, 10, and 15 cmH2O) and three levels of inspiratory pressure (20, 30, and 40 cmH2O) were applied as previously described. 17 The remaining parameters were an FIO2 of 21%, the most sensitive inspiratory trigger setting to avoid false triggering, a pressure rise time of 0.1 seconds, and the breath switching was 25%.
During testing, we collected data spanning approximately 20–30 respiratory cycles per group, which included actual VT, Ppeak, Pplat, PEEP, peak flow, time to trigger, the time for airway pressure to rise from baseline to 90% of the target (T90%), the maximum pressure drop during triggering, DT, leak compensation ability, and the work of breathing (WOB). In this study, WOB is defined as the effort required for the simulated patient to overcome both the resistence and elastic loads of the respiratory system during inspiration. The calculation method is based on the ASL5000 simulated lung, where the area under the curve of airway pressure against volume change throughout the entire inspiratory phase is integrated to obtain the total inspiratory work per breath. This value is then divided by the tidal volume to derive the result, thereby quantifying the inspiratory muscle effort of the simulated patient. This approach enables comparisons under different conditions and facilitates the assessment of leak compensation capabilities. Besides, we defined the response efficiency as the sum of T (90%) and DT: response efficiency = T (90%) + DT. The diagram of different ventilation patterns and T (90%) were shown as Figure 2. The diagram of different ventilation patterns and T (90%). (a1-c1): The pattern diagram for V-A/C, P-A/C and PSV respectively. (a2-c2): The pattern diagram of T (90%) in V-A/C, P-A/C and PSV respectively. T90: The time required for the pressure to rise to 90% of the peak pressure.
Statistical analysis
All statistical analyses were performed using SPSS 19.0 software (IBM Corp., Armonk, NY, USA). Normality of continuous variables was first assessed using the Shapiro-Wilk test. Data conforming to normal distribution were presented as mean ± standard deviation, while non-normally distributed data were expressed as median. For comparisons between multiple groups, one-way analysis of variance (ANOVA) was applied for normally distributed data. In cases of non-normal distribution, the Kruskal-Wallis H rank sum test was employed. A two-tailed P < 0.05 was considered statistically significant for all analyses.
Results
The pressurization accuracy and VT accuracy in ARDS model
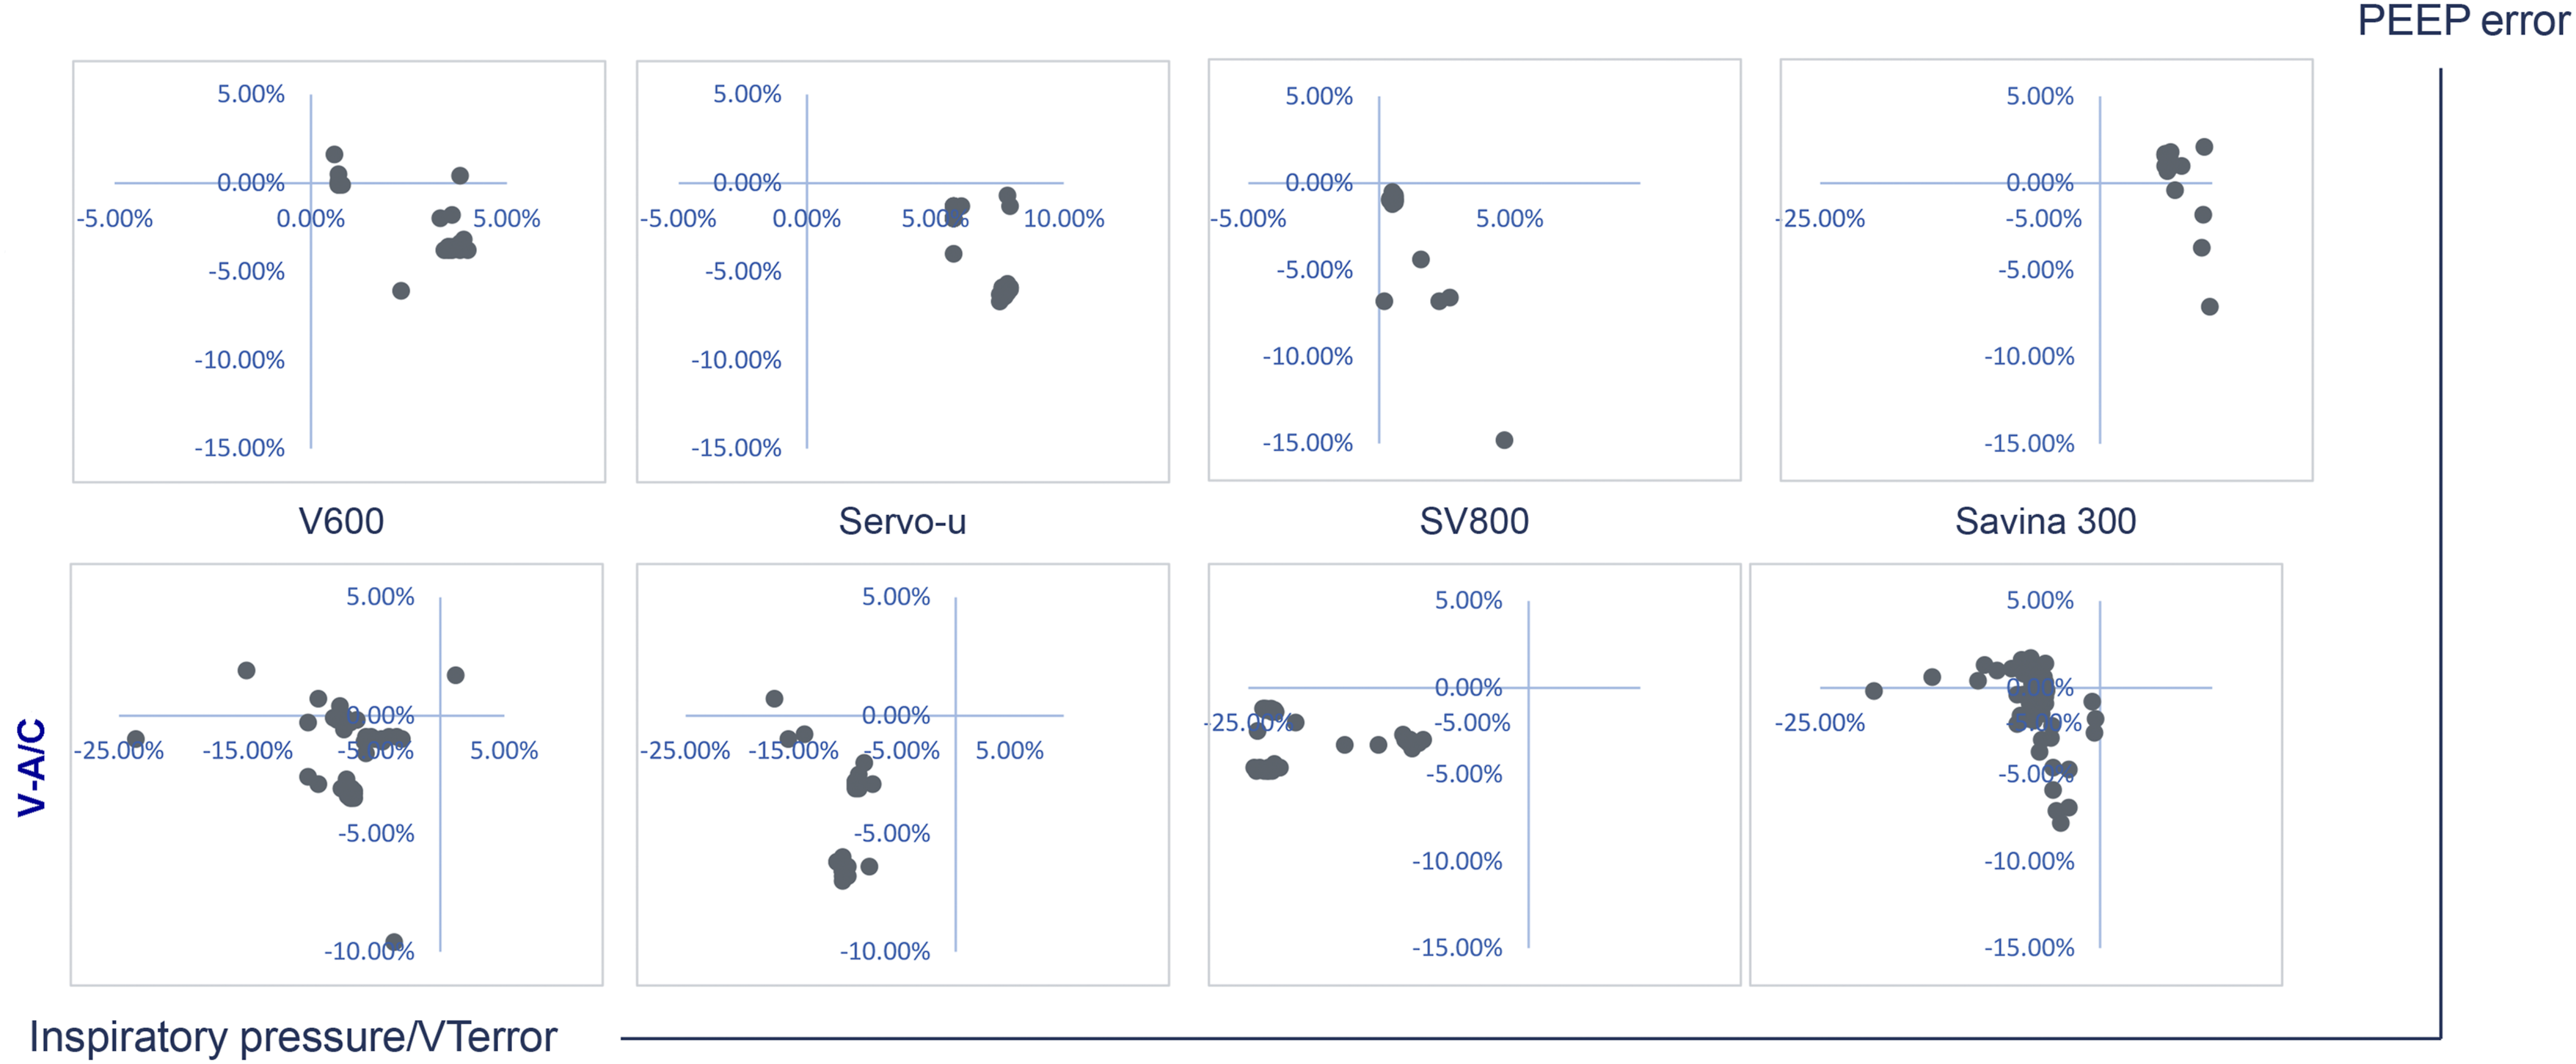
DT, measured in milliseconds, is defined as the time interval from the initiation of patient effort to the onset of pressurization by the ventilator. A shorter delay indicates better trigger performance. In practice, the actual ventilator response occurs milliseconds before the pressure drops below the PEEP level. T90% can be calculated directly using the formula: 90% threshold = baseline pressure + 0.9 × (end-inspiratory pressure − baseline pressure). The T90% metric was selected as the evaluation indicator for the following reasons: (1) it intuitively reflects the extent of pressure drop below the PEEP level during triggering; (2) it is straightforward to compute; (3) in bench testing, this metric quickly and stably differentiates the trigger performance of various ventilators, offering greater practicality for rapid clinical assessment; and (4) maximum pressure drop, as a single-point extreme value, entails smaller measurement errors and allows for fair comparisons between ventilators. In contrast, the pressure-time product requires integration over the trigger phase and is susceptible to baseline drift and waveform noise. To avoid interference from early inspiratory oscillations during measurement, a pressure sustained above the threshold for ≥20 ms is considered a valid crossing. Automatic measurement may fail if oscillations occur (affecting <5% of breath cycles, primarily observed in turbine ventilators under leak conditions). First, we evaluated ventilator performance in the absence of spontaneous breathing and leak. The mean absolute errors for target Pinsp were 2.6% for the V600, 7.2% for the Servo-U, 5.9% for the SV800, 7.6% for the Savina300, 3.4% for the SV300, and 3.5% for the RS300 (Supplementary table 1). No significant difference in pressurization accuracy was observed among ventilators with different air supply patterns during P-A/C in ARDS model (Figure 3(a), P>0.05). However, the mean absolute errors for target VT were 8.9% (V600), 10.3% (Servo-U), 14.4% (SV800), 4.6% (Savina300), 18.8% (SV300), and 19.9% (RS300) (Supplementary Table 1). With the exception of the Savina300, ventilators using a central medical air supply demonstrated lower VT error than turbine-based ventilators in V-A/C model (Figure 3(b), P<0.05). Second, we assessed the performance with condition that ventilators were set up with different trigger (PEEP: 5cmH2O, 10cmH2O and 15cmH2O) and fixed leak (4.4 L/min). It was difficult to obtain stable inspiratory pause phase (Ppause) values in some ventilators with turbine’ supply of medical air, and we could only get some Ppause values in Savina300. This may be attributable to prolonged VT delivery in ventilators with a turbine-based medical air supply, which reduces the effective sampling window. If exhalation begins or the inspiratory pause ends before the pressure plateau stabilizes, the monitoring algorithm cannot trigger or capture a reliable plateau pressure reading, resulting in measurement failure. The results demonstrate that the stability and accuracy of pressurization and VT delivery in the Savina 300 were not inferior to those of ventilators with a central medical air supply in volume assist/control mode (Figure 4, P>0.05). The trigger settings and corresponding measurement data are provided in Supplementary table 2. Ventilator accuracy in ARDS without the effect of spontaneous breathing and leak. (a) Pressurization accuracy in P-A/C mode; (b) VT accuracy in V-A/C mode. The x-axis represents different ventilator brand groups (V600, Servo-u, SV800, Savina300, SV300, RS300). The diagram of pressurization accuracy and VT accuracy among ventilators in ARDS with variable levels of leak and trigger in P-A/C and V-A/C. The distance from the dots to intersection point presented the error under different condition.
The pressurization accuracy and VT accuracy in COPD model
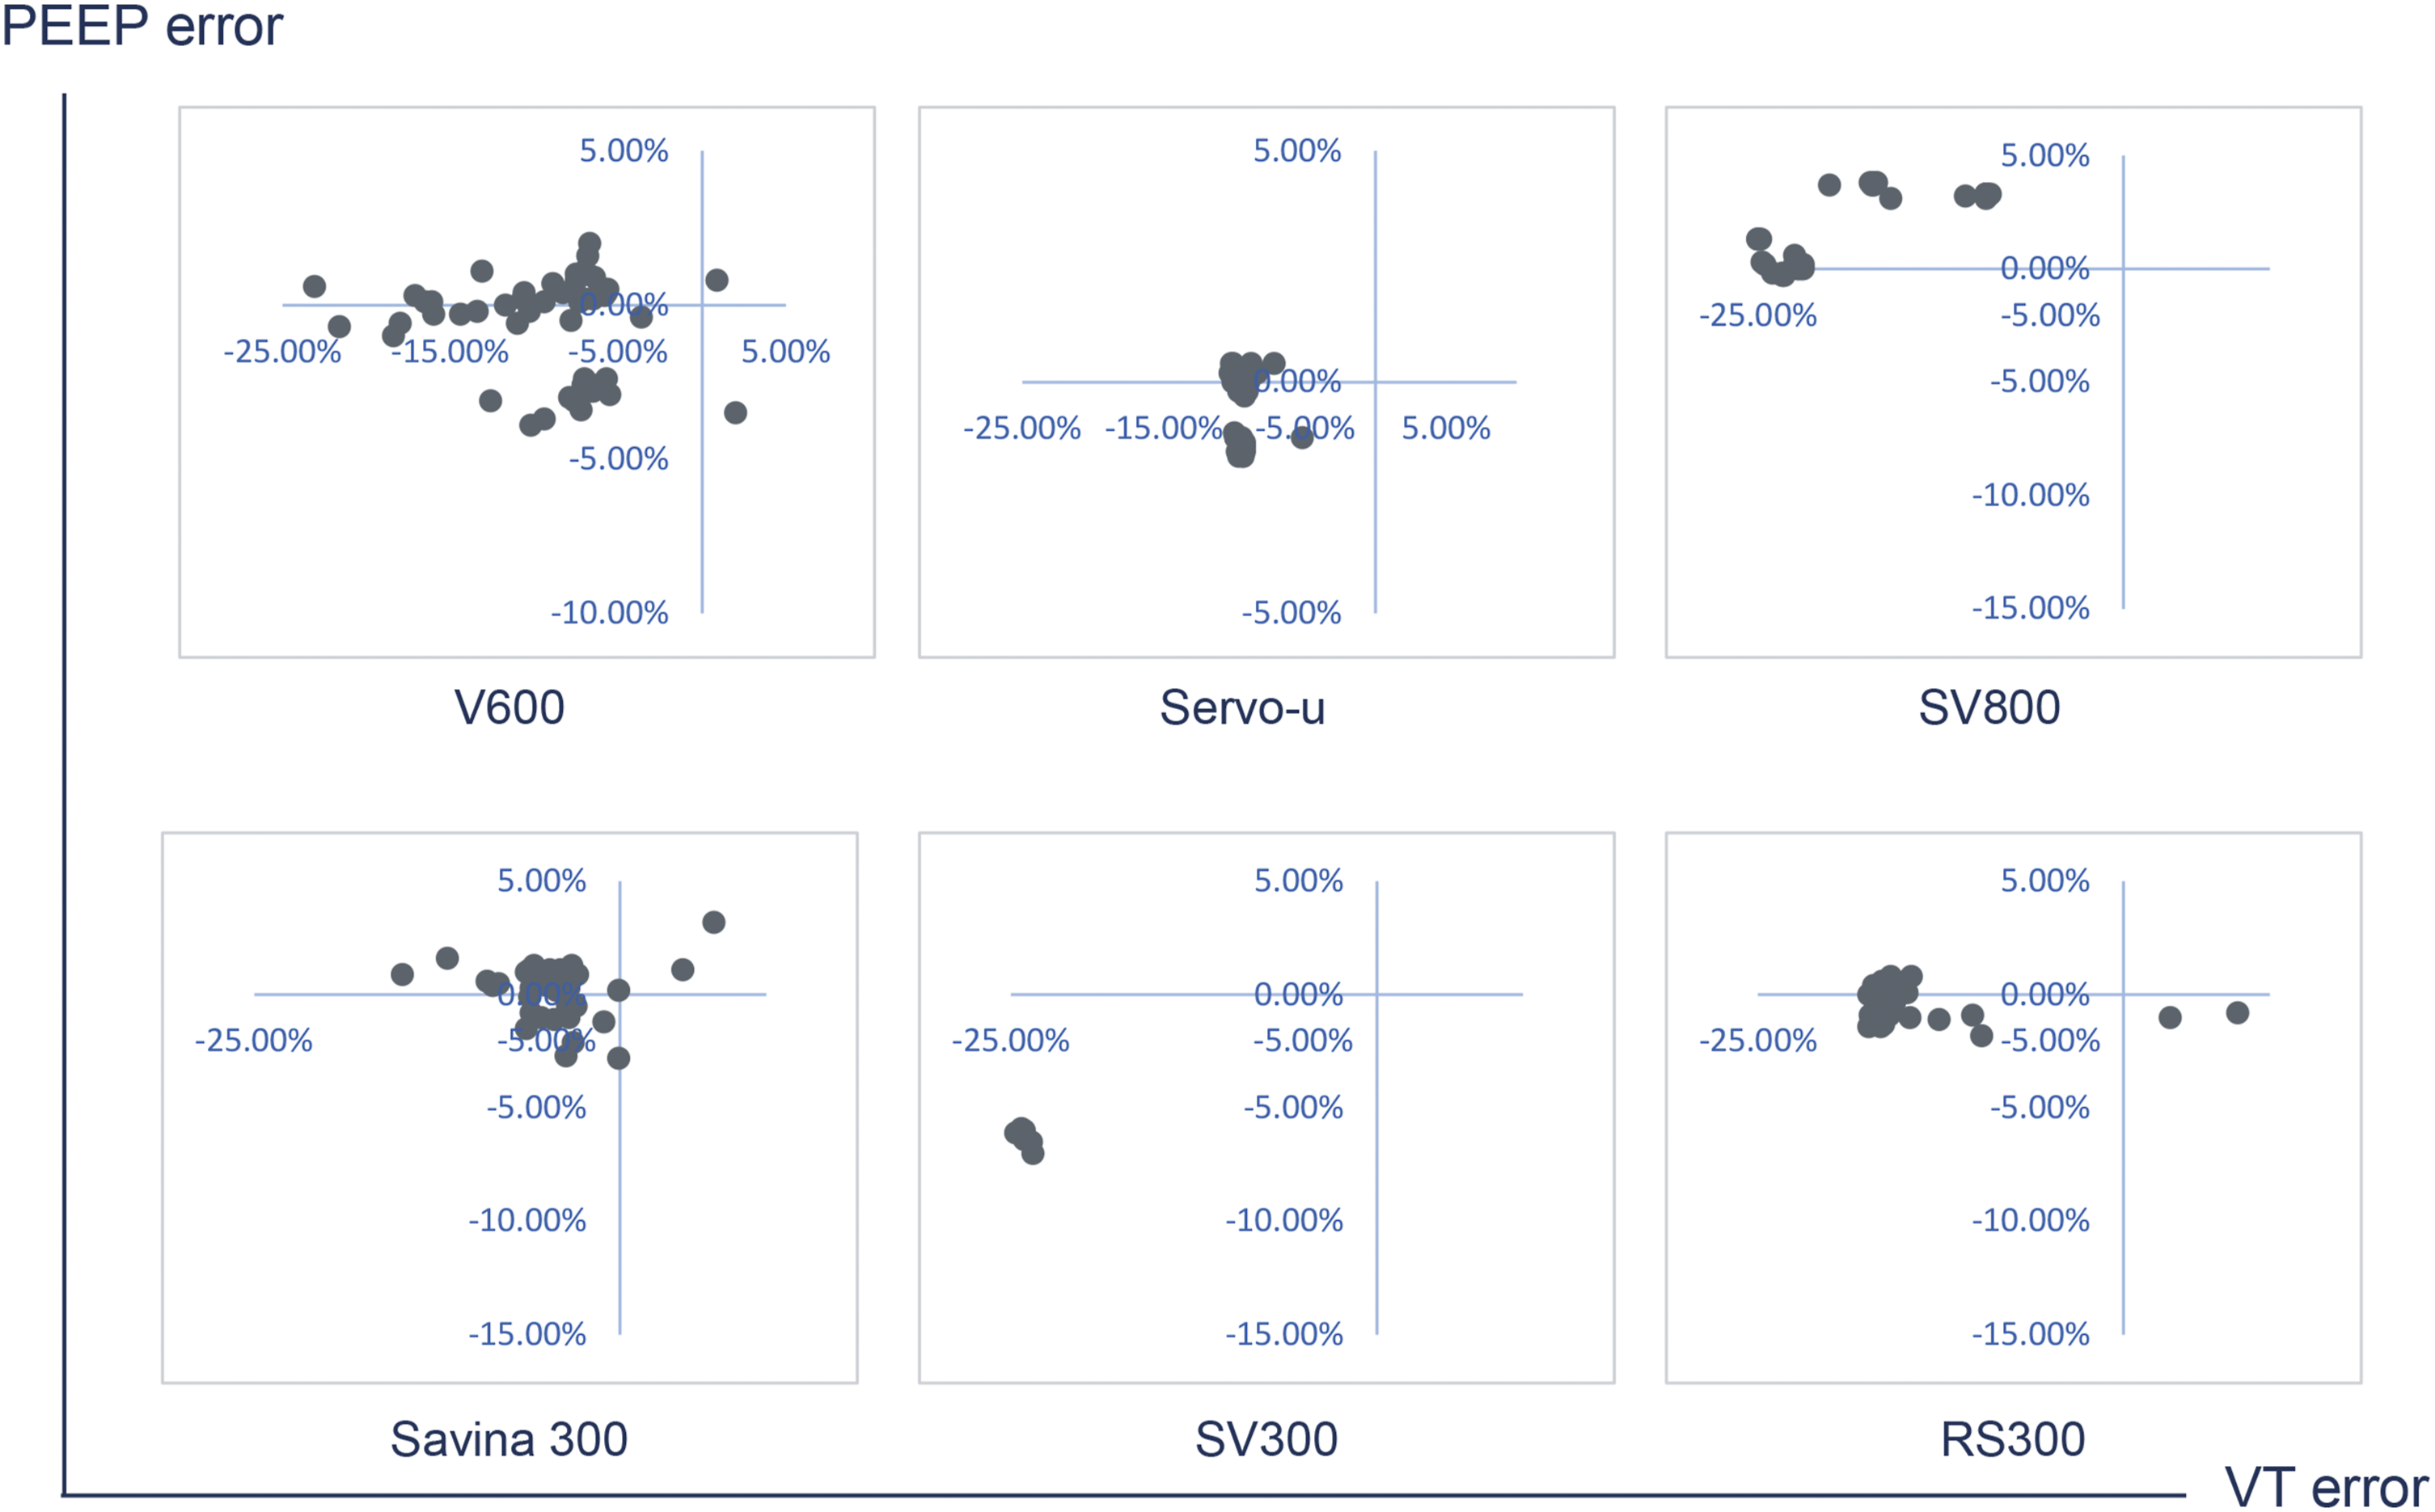
The target Pinsp values for the V600, Servo-U, SV800, Savina300, SV300, and RS300 ventilators were unaffected by spontaneous breathing or leak. Their corresponding mean absolute errors were 0.7%, 1.8%, 1.6%, 1.8%, 1.3%, and 1.3%, respectively (Supplementary table 3). The result showed that the pressurization accuracy was also no significant difference between the ventilators with different air supply patterns under the condition of P-A/C in COPD model (Figure 5(a), P>0.05). The mean absolute errors of target VT were 5.6% for the V600, 10.4% for the Servo-U, 11.4% for the SV800, 5.7% for the Savina300, 10.2% for the SV300, and 18.9% for the RS300 ventilators (Supplementary table 3). The VT accuracy was comparable between the two ventilator types with different air supply in V-A/C mode. Both the V600 and Savina300 demonstrated superior VT accuracy, with no significant difference observed between these two models (Figure 5(b), P>0.05). Additionally, we took the factors including fixed leak (4.4 L/min) and trigger (PEEP: 5cmH2O, 10cmH2O and 15cmH2O) into consideration (Supplementary table 4). In the COPD model under P-A/C mode, the pattern of differences among ventilators did not differ significantly from that observed in the ARDS model. Under V-A/C mode, however, the VT and PEEP accuracy varied between ventilators. The V600 demonstrated the highest VT accuracy, while the Savina showed the best PEEP accuracy among all devices tested (Figure 6, P<0.05). Ventilator accuracy in COPD without the effect of spontaneous breathing and leak. (a) Pressurization accuracy in P-A/C mode; (b) VT accuracy in V-A/C mode. The x-axis represents different ventilator brand groups (V600, Servo-u, SV800, Savina300, SV300, RS300). The diagram of pressurization accuracy and VT accuracy among ventilators in COPD with variable levels of leak and trigger in C-P/V mode. The distance from the dots to intersection point presented the error under different condition.
Synchronization assessment in PSV
In this study, we evaluated the trigger response efficiency and work of breathing in ventilators with variable trigger levels, accounting for the influence of leak. We found that the average trigger delay times for the V600 and Servo-u were both under 100 ms, whereas the average delay for the SV800 exceeded 100 ms in ARDS. The work of breathing was significantly higher for the V600 and Servo-u than for the SV800 (P<0.05). Furthermore, a significant difference in response efficiency was observed, with the V600 and Servo-u demonstrating shorter trigger times than the SV800 (Figure 7). The work of breathing and respond efficiency in ventilators in PSV in ARDS. Ventilations with center’s supply of medical air: V600, Servo-U and SV800.
Discussion
Selecting an appropriate ventilator is critical for maintaining patient respiration during clinical treatment. Consequently, ventilator performance should be assessed based on VT accuracy and PEEP during assisted controlled ventilation, as well as leak compensation capability and the triggering and pressurization performance for spontaneously breathing patients. Previous research has reported that the error between preset and actual VT can exceed 10% of the preset value, 3 a finding also observed in anesthesia ventilators. 21 This indicates that substantial improvements in VT accuracy will require new technological breakthroughs. The error in pressurization timing is typically minor and therefore acceptable. During pressure support ventilation, the pressurization capacity and trigger performance directly influence patient-ventilator synchrony, which in turn affects clinical outcomes. Patient-ventilator asynchrony can lead to adverse effects, including excessive respiratory muscle load, air hunger, and lung injury, making its prevention critical during invasive mechanical ventilation.22,23 Given the inherent variability between ventilator models, this study evaluated their performance by integrating technical specifications, patient pathophysiology, and clinical expertise to establish a functional classification.
Simulation studies are frequently employed to assess the performance of respiratory system models. Unlike investigations using human or animal subjects, simulators provide a simpler approach and eliminate the risk of injury. 24 This study employed the ASL5000 lung simulator to evaluate and compare the performance of six invasive mechanical ventilators under simulated clinical conditions, focusing on triggering function and pressurization capacity during P-A/C, V-A/C, and PSV modes. In V-A/C mode within ARDS models, the VT accuracy was superior for ventilators using a central medical air supply compared to those with a turbine-based supply. Interestingly, the Savina300, which utilizes a turbine, demonstrated better VT accuracy than the central-air-supply ventilators, a result likely attributable to its specific turbine technology incorporating a constant-speed turbine and bypass valve. Furthermore, the Savina300 exhibited superior pressurization accuracy relative to other turbine-based ventilators across variable trigger levels and under conditions of leak in the ARDS model. The results also revealed a significant difference between triggering function and pressure delivery during PSV. First, the response efficiency differed significantly between the V600, Servo-u, and SV800, with the V600 and Servo-u exhibiting shorter response times than the SV800. In most invasive mechanical ventilators, the triggering function relies on flow triggering, as flow-triggered systems demand less patient effort to initiate a breath compared to pressure-triggered systems. 25 Furthermore, sensitive detection thresholds enhance patient-ventilator synchronization by reducing ineffective triggering. Increased sensitivity is linked to shorter delays in recognizing patient effort. We found that the average DTs for the V600 and Servo-u were under 100 ms, whereas the average DT for the SV800 exceeded 100 ms. These findings align with prior studies of ventilators used for ICU patient transport, in which longer DT values have been observed in older ICU ventilators, intermediate ICU ventilators, and transport ventilators.26–28 Garnier et al. also revealed that inspiratory delays differed significantly among ventilators in invasive PSV (range 75–149 ms, P=0.03) in thirteen modern intensive care unit ventilators. 20
Furthermore, we observed that the work of breathing was significantly higher for patients on the V600 and Servo-u ventilators than on the SV800. Generally, at a given pressure support level, greater patient effort correlates with a higher initial flow rate, which indicates effective pressurization. Studies examining the impact of peak flow rate on patient effort have found that the work of breathing decreases significantly when the time required to reach the set pressure is short.15,29,30 Mancebo et al. observed a reduction in the work of breathing when using a high-performance ventilator, in contrast to a ventilator with insufficient pressurization capacity to meet the patient’s ventilatory demand. 31 Muhammad et al. evaluated the work of breathing (WOB) during a spontaneous breathing trial with zero pressure support and zero PEEP. Their results demonstrated that the Servo-u and Servo-i ventilators reduced the WOB, while the Carescape R860 ventilator increased it across all three tested lung models: normal, COPD, and ARDS. 32 Our study found that the triggering function and pressurization capacity were superior in the V600 and Servo-u compared to the SV800, although the performance between the V600 and Servo-u did not differ significantly.
This study systematically assessed ventilator performance by determining whether measured parameters aligned with preset values and complied with international standards. The pressurization rate and pressurization accuracy were evaluated concurrently, an approach employed in numerous prior studies.21,27,33 Furthermore, we evaluated performance under a leak condition of 4.4 L/min, which closely simulated a realistic clinical scenario for invasive ventilators. Our study therefore revealed performance discrepancies across ventilator models, offering clinicians practical guidance for selecting an appropriate device for a given patient.
However, several limitations of this study should be acknowledged. First, while the ASL5000 lung simulator provides a standardized and repeatable test environment, its behavior may differ from that of actual patients. Second, although representative invasive mechanical ventilators were compared, a broader range of ventilator models should be evaluated in future work. Third, the investigation focused on pressure support ventilation; additional modes and a wider set of parameters require examination.
Conclusion
Our study found that the pressurization accuracy of centrally supplied and turbine-based ventilators did not differ significantly when unaffected by spontaneous breathing or leakage in either P-A/C or V-A/C mode. With the exception of the Savina300, the VT accuracy of centrally supplied ventilators was generally superior to that of turbine-based models. Under the various trigger and leak conditions tested in P-A/C and V-A/C, the turbine-based ventilator in the ARDS lung model was limited by its air supply, which prevented the test value Ppause from being captured at a stable pressure level, particularly under low trigger conditions. In contrast, the Savina 300 exhibited more stable pressure control than other turbine-based ventilators, enabling the collection of several parameters; The stability and accuracy of the Savina 300 in our study were comparable to those of the central air supply equipment in V-A/C, though significant differences in VT accuracy and PEEP were observed among the ventilators. The trigger function and pressurization quality of invasive mechanical ventilators vary substantially during PSV. These variations may be linked to differences in patient work of breathing and patient-ventilator interactions during assisted mechanical ventilation. Our findings indicate that the V600 and Servo-u performed better than the SV800, providing new data for clinical ventilator application. Clinical studies under similar ventilatory conditions are required to evaluate whether our experimental results can be extrapolated to daily practice in future.
Supplemental material
Supplemental material - The in-vitro performance of invasive mechanical ventilators in lung model
Supplemental material for The in-vitro performance of invasive mechanical ventilators in lung model by Xingshuo Hu, Yizhou Ma, Qingyun Yang, Lixin Xie, and Qi Wu in Science Progress.
Footnotes
Author contributions
All authors designed the study; all authors collected and analyzed the data; XSH, YZM, QYY were major contributors in writing the manuscript. All authors read and approved the final manuscript.
Funding
The authors received no financial support for the research, authorship, and/or publication of this article.
Declaration of conflicting interests
The authors declared no potential conflicts of interest with respect to the research, authorship, and/or publication of this article.
Data Availability Statement
The datasets used or analyzed during the current study are available from the corresponding author on reasonable request.
Supplemental material
Supplemental material for this article is available online.
References
Supplementary Material
Please find the following supplemental material available below.
For Open Access articles published under a Creative Commons License, all supplemental material carries the same license as the article it is associated with.
For non-Open Access articles published, all supplemental material carries a non-exclusive license, and permission requests for re-use of supplemental material or any part of supplemental material shall be sent directly to the copyright owner as specified in the copyright notice associated with the article.