
Abstract
To predict the volume change of stage III NSCLC after radiotherapy with 60 Gy.
This retrospective study included two independent cohorts, a train cohort of 192 patients, and a test cohort of 31 patients. We developed a radiomics model based on radiomics features and clinical variables. LIFEx package was used to extract radiomics texture features from CT images. The classification method was logistic regression analysis and feature selection was performed by correlation coefficients. Performance metrics of logistic regression include accuracy, precision, the receiver operating characteristic curves, and recall.
The combination features of clinical variables and radiomics can predict the tumor volume change after radiotherapy with 88.7% accuracy (88.6% precision, 88.7% recall, and 88.7% ROC area).
Radiomics features combined with medical knowledge have a great potential to predict accurately tumor volume change of stage III NSCLC after radiotherapy with 60 Gy.
Introduction
Radiation therapy is a crucial and cost-effective lung cancer curative treatment, and its curative effect depends on the radiosensitivity of tumor cells of the different patients.1–6 Generally, small cell lung cancer has the highest sensitivity to radiotherapy, followed by squamous cell carcinoma and adenocarcinoma.
Radiomics provides a quantitative method to mine useful data from medical images, the mined data can be the features to predict clinical events.7–18 Specifically, radiomics extracts quantitative features from medical images, which reflect tumor information from multiple dimensions. The radiomics features (RF) is calculated by the image pixels and voxels, so it is closer to the actual tumor volume to calculate the tumor volume with radiomics. The types of medical images that can be used for analysis are CT, MRI, ultrasound images, etc.
Medical images contain a lot of information, which can be mined out by artificial intelligence. Logistic regression classifier is a mature statistical analysis method, it is suitable for binary classification problem without scaling input features. Compared with deep learning, it does not need tens of thousands of data, which reduces the pressure of clinical data collection. Besides that, it has fast training speed, and the trained model is easy to understand.
It has shown that radiomics features may be the biomarkers of predicting clinical events of cancer patients, like predicting survival of patients,18–21 predicting histology and tumor stage,22–25 the response of immunity therapy,26,27 and evaluating the drug reaction.28–31 Avalon et al. 7 provided the current status of lung cancer radiomics, and made a comprehensive description that radiomics can reveal key components of lung tumor phenotype of diagnostic, prognostic, and predictive value, significantly augmenting the evidence-based human’s capabilities. So radiomics has the potential to evaluate the tumor radiosensitivity. Medical knowledge plays an important role in lung cancer treatment, it combined radiomics may improve the accuracy of the prediction model.
This paper tests the hypothesis that RF combined medical knowledge have a mathematical relationship with tumor volume change of lung cancer patients treated with radiotherapy. To invest the evidence of that, we develop a radiomics model to predict the tumor volume change rate of stage III NSCLC treated with 60 Gy radiotherapy dose.
Materials and methods
Patients and datasets
We analyzed retrospectively two independent cohorts for this work (Table 1), For these patients, CT images were available. All the patients were treated with radiotherapy and concomitant chemotherapy. The irradiation field contains involved field. The median daily dose was 2.2 Gy (range, 2.0–2.4 Gy, fractions, 25–30). The average mean lung dose ≤20 Gy, total lung V20Gy ≤ 30%, and total lung V5Gy ≤ 65%.
The characteristics of the train and test cohort.

IMRT: intensity-modulated radiotherapy; 3D-CRT: three-dimensional conformal radiation therapy.
The sample size was equal to the number of patients who met the criteria in the institutional database. The train cohort consists of 192 NSCLC stage III patients, 120 men (mean age, 65 years; range, 45–82 years) and 72 women (mean age, 68 years; range, 55–72 years), and treated with concurrent chemoradiotherapy at our institute. Images were acquired between 2010 and 2017. This data set was used for feature selection and model building.
The test cohort consists of 31 NSCLC stage III patients, 19 men (mean age, 66 years; range, 58–78 years) and 11 women (mean age, 67 years; range, 55–80 years), treated with concurrent chemoradiotherapy at another institute. Images were acquired between 2010 and 2017. This data set was used for a model test.
The radiomics features were extracted from CT images. The CT images before radiotherapy were acquired from radiotherapy positioning images, the CT images after radiotherapy were acquired 1 month after radiation therapy. The CT scan time after radiotherapy was different because of the retrospective study, the average time is 32 days after radiotherapy.
The follow-up exams included blood routine examination, biochemistry, tumor markers, chest CT, and brain MRI. For most patients, these exams were performed 1 month after treatment.
Tumor segment and feature extraction
The procedures were listed in the Supplementary Material (file1), according to the Image Biomarker Standardization Initiative (IBSI) reporting guidelines. 32 The volume of interest was manually delineated by two thoracic radiologists (with 20 years of experience in lung CT). Radiomics texture features were extracted automatically with LITEx software. 33 The clinical variables were collected from the patients’ clinical data. The clinical variables and RF were taken into feature selection equally (Table 2).
The clinical variables and selected radiomics features.
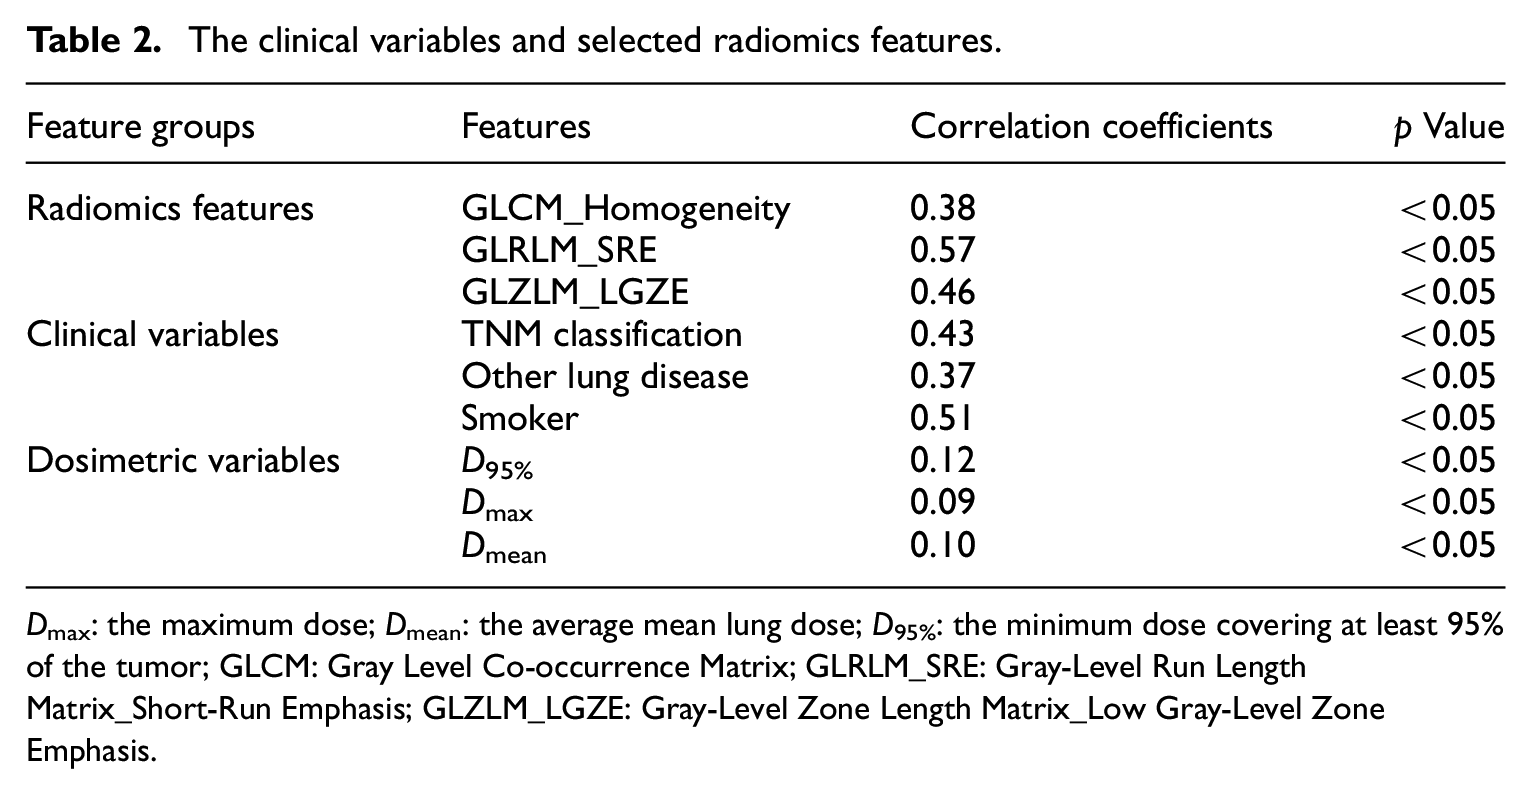
D max: the maximum dose; Dmean: the average mean lung dose; D95%: the minimum dose covering at least 95% of the tumor; GLCM: Gray Level Co-occurrence Matrix; GLRLM_SRE: Gray-Level Run Length Matrix_Short-Run Emphasis; GLZLM_LGZE: Gray-Level Zone Length Matrix_Low Gray-Level Zone Emphasis.
Statistical analysis
The statistical analysis reported in our study was performed with Weka package. 34 The correlation ranking filter was implemented as a feature selection method. It can rank attributes by their evaluations when evaluating the worth of an attribute by measuring the correlation (Pearson’s) between it and the class. To avoid the curse of dimensionality and reduce the risk of overfitting, we compared the correlation coefficients (CC) between each attribute, removing the redundant attributes.
To get better accuracy, we combined the clinical variables to build the prediction model. The weights of clinical variables are customized by clinical doctors according to CC and medical knowledge. To find a simple and effective model, we discretized the RF based on its frequency and combined the selected features whose weight came from logistic regression into one feature combination. Before the feature combination, we had to adjust the weight of each selected feature to get a better classification performance.
The outcome of tumor volume change after radiotherapy was divided into two parts, “N” represents the volume change rate is less than 50% and “Y” represents the volume change rate is more than or equal to 50%
Result
The combined features
The selected clinical variables included TNM classification (CC = 0.428), other lung diseases (CC = 0.512), and smoker (CC = 0.368). we combined these features into one feature combination (MC).

where a is smoker, b is TNM classification, and c is other lung disease.
GLRLM_SRE, Gray-Level Run Length Matrix_Short-Run Emphasis and GLZLM_LGZE, Gray-Level Zone Length Matrix_Low Gray-level Zone Emphasis.
The top three RF obtained from the training set are GLCM_Homogeneity (Gray Level Co-occurrence Matrix_Homogeneity), GLRLM_SRE (Gray-Level Run Length Matrix_Short-Run Emphasis, SRE is the distribution of the short homogeneous runs in an image), and GLZLM_LGZE (Gray-Level Zone Length Matrix_Low Gray-Level Zone Emphasis, LGZE is the distribution of the low gray-level zones). The radiomics feature combination (RC) is calculated by the following formula.

Where d is Gray Level Co-occurrence Matrix_Homogeneity, e is Gray-Level Run Length Matrix_Short-Run Emphasis, and f is Gray-Level Zone Length Matrix_Low Gray-Level Zone Emphasis.
Radiomics model
The Combined features were applied to test data set with logistic regression classifier and validated in the data set using multiple indexes (area under ROC, classification accuracy, recall). The logistic regression model showed 87% accuracy and the linear equation as follows:

Where MC, the combination of clinical variables and RC, the radiomics feature combination.
The performance of the logistic regression model was listed in Table 3. As a whole, 88.7% precision and 88.6% accuracy means this model has good repeatability and reproducibility. Recall rate, F-measure, ROC area, and PRC area are over 87.5%, which represents this model has a good and comprehensive performance.
The performance of logistic regression.

Where TP is true positive, FP is false positive, ROC is receiver operating characteristic curve, and PRC is precision recall curve; Y represents “effective” and N represents “not effective.”
For class Y, 91.0% TPR means that 91.0% actual patients with Y that are correctly predicted, and for class N, 86.4% actual patients with N that are correctly predicted.
Discussion
In this study, we established a formula that had more than 88% accuracy and precision to predict the tumor volume change rate of stage III NSCLC after radiotherapy with 60 Gy. This formula was based on RF and medical knowledge, established by a logistic regression model.
We selected six features from CT images and clinical parameters, they have a good performance on the logistic regression model. The linear equation only has six unknown values, which can be easily attained. It means that for stage III NSCLC can easily find whether it is effective to be treated with radiotherapy with 60 Gy.
The GLCM describes the distribution of co-occurring pixel values at a given offset, it can measure the texture of tumor from the intensity or grayscale values of the image or various dimensions of color. The homogeneity from GLCM describes the pixel difference of the target area and quantifies the differences between tumor tissues.
The GLRLM gives the size of homogeneous runs for each gray level, it requires computation in several directions, contrary to GLZLM. The SRE is the distribution of the short homogeneous runs, and quantifies the differences in the tumor.
The GLZLM provides information on the size of homogeneous zones for each gray-level in three dimensions. The more homogeneous the texture, the wider, and flatter the matrix. The GLZLM_LGZE describes the distribution of tumor cells shown as low gray areas. By comparing the values, we can evaluate the difference of lesions among individuals.
In Figure 1 representative CT scans of a patient with positive outcome and one with negative outcome. The proposed radiomics model correctly predicted the tumor volume changes. Besides the difference in tumor diameter, the two images also imply some differences invisible to the naked eye. The selected features can quantify the internal and external differences of the tumor to predict the response after radiotherapy.
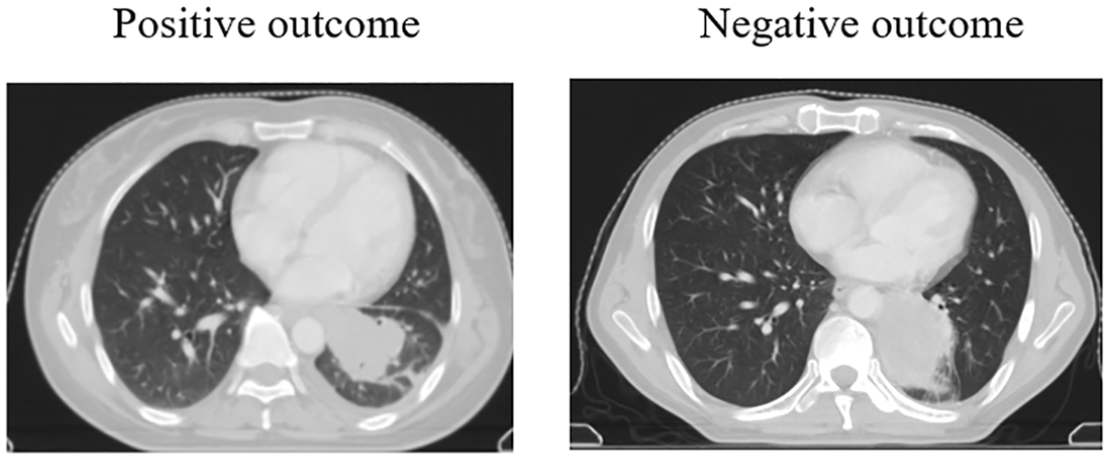
Example images of a patient with positive outcome and one with negative outcome.
RF provides more information about tumors that cannot be seen by the naked eye. These features are essentially the same as those seen by the naked eye, such as shape, size, etc. The difference is that RF can reveal deeper information inside the tumor. We think that Radiomics features can reflect the radiosensitivity of tumor cells. Specifically, there are three conjectures: (1) Some RF reflect the update rate of tumor cells. The tumor cells with a strong division and self-renewal capacity are more sensitive to ionizing radiation. The division rate of these cells may be shown in CT images and recognized by high-dimensional RF. (2) Some RF showed the number of free radicals. Free radical is an important way of energy transfer during ionizing radiation, which can damage the nucleic acid and protein of cells and cause various chemical reactions. The number of free radicals can affect the effect of ionizing radiation, and some RF may directly or indirectly reflect the number of free radicals. (3) RF can show the proportion of hypoxic cells. The proportion of hypoxic cells in tumor tissue can affect Radioresistance, and the RF of hypoxic cells may be different from other cells.
We found that the quantification of medical knowledge has the potential to apply to machine learning models. In this study, we set different weights for clinical parameters and got better performance than using RF only. To quantify medical knowledge and make it a digital feature, the feature weight had to make an appropriate adjustment to get a more accurate model.
There is a genome-based model for adjusting radiotherapy dose (GARD) combined radiosensitivity index and the linear-quadratic model, which was reported to predict the tumor response and proper radiotherapy dose. 35 But applying GARD to clinical decision support systems remains to be defined, and the cost of genetic testing is expensive.
The retrospective design of our cohort was restricted to only stage III NSCLC. And machine learning method needs more data to make the results more accurate, so the sample size selected for this study needs to be expanded. Further work is needed to focus on enlarging the data size. What’s more, given all the patients were treated with chemotherapy and the radiotherapy time was irregular, we didn’t take chemotherapy into account.
In conclusion, we introduced a simple machine learning approach to predict tumor response of lung cancer patients who are treated with radiotherapy. The RF combined with clinical variables had a good performance on the logistic regression model.
Supplemental Material
sj-pdf-1-sci-10.1177_0036850421997295 – Supplemental material for A radiomics model of predicting tumor volume change of patients with stage III non-small cell lung cancer after radiotherapy
Supplemental material, sj-pdf-1-sci-10.1177_0036850421997295 for A radiomics model of predicting tumor volume change of patients with stage III non-small cell lung cancer after radiotherapy by Mengmeng Yan and Weidong Wang in Science Progress
Footnotes
Declaration of conflicting interests
The author(s) declared no potential conflicts of interest with respect to the research, authorship, and/or publication of this article.
Funding
The author(s) disclosed receipt of the following financial support for the research, authorship, and/or publication of this article: This study was supported by National Key Research and Development program (2017YFC0113904).
Ethics approval
Ethical approval for this study was obtained from *Ethics Committee of Sichuan Cancer Hospital (SCCH EC-02-2017-030).
Informed consent
Verbal informed consent was obtained from legally authorized representatives before the study. Because this was a retrospective and non-interventional study, it did not affect the treatment of patients and did not require tissue samples. This method of obtaining informed consent was approved by the Institutional Ethics Committee.
Supplemental material
Supplemental material for this article is available online.
Author biographies
References
Supplementary Material
Please find the following supplemental material available below.
For Open Access articles published under a Creative Commons License, all supplemental material carries the same license as the article it is associated with.
For non-Open Access articles published, all supplemental material carries a non-exclusive license, and permission requests for re-use of supplemental material or any part of supplemental material shall be sent directly to the copyright owner as specified in the copyright notice associated with the article.