
Abstract
Background:
This study aims to compare the diagnostic accuracy of magnetic resonance imaging (MRI) and MR arthrography (MRA) for the articular-sided partial-thickness rotator cuff tear (PTRCT).
Methods:
Three electronic databases, PubMed/Medline, Embase and Cochrane Library, were utilized to retrieve articles comparing the diagnostic value of MRA and MRI for detecting articular-sided PTRCTs. The pooled statistical indexes included sensitivity, specificity, positive/negative predictive value, diagnostic odds ratio (DOR) and the area under the receiver operating characteristic curve (AUC).
Results:
Eleven studies involving 1703 patients and 1704 shoulders were included. The pooled sensitivity, specificity, DOR and AUC and their 95% CIs of MRA to diagnose articular-sided PTRCTs were 0.81 (95% CI, 0.65–0.90), 0.96 (95% CI, 0.91–0.98), 68.14 (95% CI, 33.20–139.84) and 0.96 (95% CI, 0.94–0.97), respectively. The pooled sensitivity, specificity, DOR and AUC and their 95% CIs of MRI were 0.78 (95% CI, 0.65–0.87) and 0.97 (95% CI, 0.84–0.99), 47.82 (95% CI, 8.29–275.89) and 0.89 (95% CI, 0.86–0.92), respectively.
Conclusions:
This meta-analysis reveals that MRA has a better diagnostic value than that of MRI for the diagnosis of articular-sided partial-thickness rotator cuff tears because of an improvement of sensitivity.
Introduction
Partial-thickness rotator cuff tear (PTRCT) was first described by Codman 1 and later divided into bursal-sided, articular-sided and intratendinous tears according to the depth and location of the tear. 2 It should be noted that articular-sided PTRCT was 2–3 times more common than bursal-sided tears.3,4
Numerous diagnostic studies focused on the evaluation of the performance of MRA, MRI or ultrasound (US) imaging for the diagnosis of full- or partial-thickness tears. A previous meta-analysis confirmed that three-dimensional US is very effective and highly accurate to detect full-thickness RCTs but may lack accuracy in the diagnosis of partial tears. 5 A recent network meta-analysis of diagnostic tests performed by our team reported that high-field MRA had the highest diagnostic value, then low-field MRA, followed by high-field MRI, high-frequency ultrasound, low-field MRI, and low-frequency ultrasound. 6 However, both of the meta-analyses were performed based on the full-, partial- or any tear. It is important to identify the subtype of partial-thickness tears.7,8 Furthermore, another meta-analysis also conducted by our team indicated that MRA and MRI have a similar diagnostic value for the diagnosis of bursal-sided partial-thickness rotator cuff tears. 9 However, there is no study focused on the articular-sided PTRCTs.
The meta-analysis aims to assess the diagnostic accuracy of MRA and MRI for detecting articular-sided PTRCTs based on all available scientific published data.
Materials and methods
This study was performed in accordance with the Preferred Reporting Items for a Systematic Review and Meta-analysis of Diagnostic Test Accuracy Studies (PRISMA-DTA) statement. 10
Data sources and search strategy
Two independent reviewers searched PubMed, Embase and the Cochrane Library (including Epub Ahead of Print) for titles from data inception to January 1, 2019. The vocabulary and syntax were specifically adapted according to the database. The combination of keywords and mesh terms were “diagnostic”, “diagnosis”, “rotator cuff”, “supraspinatus”, “infraspinatus”, or “subscapularis” and “MRI”, “magnetic resonance imaging”, “MRA” or “magnetic resonance arthrography”. The purpose, research question, and eligibility criteria for the search were determined a priori. Additionally, the reference lists of relevant articles and included studies were searched by hand for supplementary eligible records. Any disagreement was settled through the discussion of researchers until a consensus was reached.
Study screening
The included studies should confirm all criteria listed as follows: 1) study design, diagnostic accuracy study; 2) population, patients with suspected rotator cuff tear; 3) MRA/MRI test was performed; 4) the final diagnosis of articular-sided RCT was confirmed by predesigned gold standards and 5) diagnostic data (number of false/true-positive [FP/TP] and false/true-negative [FN/TN] cases) could be extracted or calculated to construct a two-by-two contingency table.
Data extraction
Following information was collected from all included articles into a pre-designed Microsoft Excel spreadsheet (Version 2010, Microsoft, Redmond, WA, USA) by two investigators blindly and repeatedly: the first author's surname, publication time of the original study, sources of origin, participant characteristics (number, age and gender), design of the study, gold standard, time from the diagnostic test to the gold standard, blinding, no. of readers, the experience of readers, clinical findings of patients, technical parameters of MRA/MRI including the administration of contrast agent (indirect or direct), vendor, model, magnetic field strength, various sequences, slice thickness, analyzed image plane. Data extraction from all included studies was completed in tandem by two independent reviewers. The spreadsheets were combined and each reviewer checked a random selection of the other's entries for quality control. Any discrepancies were resolved by consensus decision.
Quality assessment
Two investigators performed blindly the methodological quality of the included studies in duplicate using the Quality Assessment of Diagnostic Accuracy Studies-2 (QUADAS-2) tool. 11
Statistical analysis
Quantitative analyses in this study were conducted with the forest plots using STATA 12.0 Version (V. 12.0, StataCorp, College Station, TX). The whole process of searching, filtering, data extraction and quality assessment was implemented by two researchers (LFX & DJL) independently and repeatedly. For any discrepancy, a consensus was reached by discussion with an arbitrator (LLX). The pooled estimates indexes to assess the accuracy of MRA/MRI included sensitivity, specificity, positive likelihood ratio (PLR), negative likelihood ratio (NLR), diagnostic odds ratio (DOR) and the area under the receiver operating characteristic curve (AUC). Sensitivity is the proportion of true positive tests out of all patients with a condition. The formula is below: Sensitivity = (True Positives) / (True Positives + False Negatives). Specificity is the percentage of true negatives out of all subjects who do not have a disease or condition. The formula is below: Specificity = (True Negatives) / (True Negatives + False Positives); A positive likelihood ratio is the “probability that a positive test would be expected in a patient divided by the probability that a positive test would be expected in a patient without a disease.”; A negative likelihood ratio is “the probability of a patient testing negative who has a disease divided by the probability of a patient testing negative who does not have a disease”. The formulas for the likelihood ratios are given below: Positive Likelihood Ratio = Sensitivity / (1-Specificity); Negative Likelihood Ratio = (1- Sensitivity) / Specificity; The Diagnostic Odds Ratio (DOR) is defined as the ratio of the odds of the test being positive if the subject has a disease relative to the odds of the test being positive if the subject does not have the disease. DOR = Sensitivity × Specificity / ((1−Sensitivity) × (1−Specificity)) = PLR + /NLR; A receiver operating characteristic curve, or ROC curve, is a graphical plot that illustrates the diagnostic ability of a binary classifier system as its discrimination threshold is varied. When using normalized units, the area under the curve (often referred to as simply the AUC) is equal to the probability that a classifier will rank a randomly chosen positive instance higher than a randomly chosen negative one. The sensitivity and specificity of MRI and MRA for the detection of partial-thickness tears were calculated and a chi-square test was performed on this data. A p-value of < 0.05 was considered statistically significant. All analyses were performed with the SPSS program (version 17, IBM SPSS, USA). Heterogeneity among the included studies was assessed using the I 2 statistic. The meta-regression and subgroup analyses were conducted to explore the available source of heterogeneity. Publication bias was performed using Deeks' Funnel Plot Asymmetry Test. Additionally, we performed meta-regression analysis and the patient sample size (≥100 or <100), publication year (before or after 2014), magnetic field strength (3.0-T or not), number of readers (≥2 or 1), Blinding (Yes or No) and QUADAS-2 score (≥10 or <10), design of the study (prospective or retrospective) as well as muscle-tendon were used as covariates.
Results
Studies retrieved and characteristics
In total, 2192 articles were identified by searching three databases and removing duplicates. The screening of the reference lists of these and other relevant articles yielded four additional studies. After screening remaining titles and abstracts, and identifying related full-text, 11 studies8,12–21 published during the period from 2007 to 2018 were included for quantitative analysis.
The sample size of the included studies ranged from 10 to 333 with a total of 1703 patients. The main characteristics and technical parameters of MRI and MRA in the included studies are presented in Table 1. According to the QUADAS-2 score, 413,17,20,21 (36.4%), 28,19 (18.2%), 314–16 (27.3%), 1 12 (9.1%) and 1 (9.1%) 18 study scored 11, 10, 9, 8 and 7, respectively.
Main characteristics and technical parameters of the included studies.
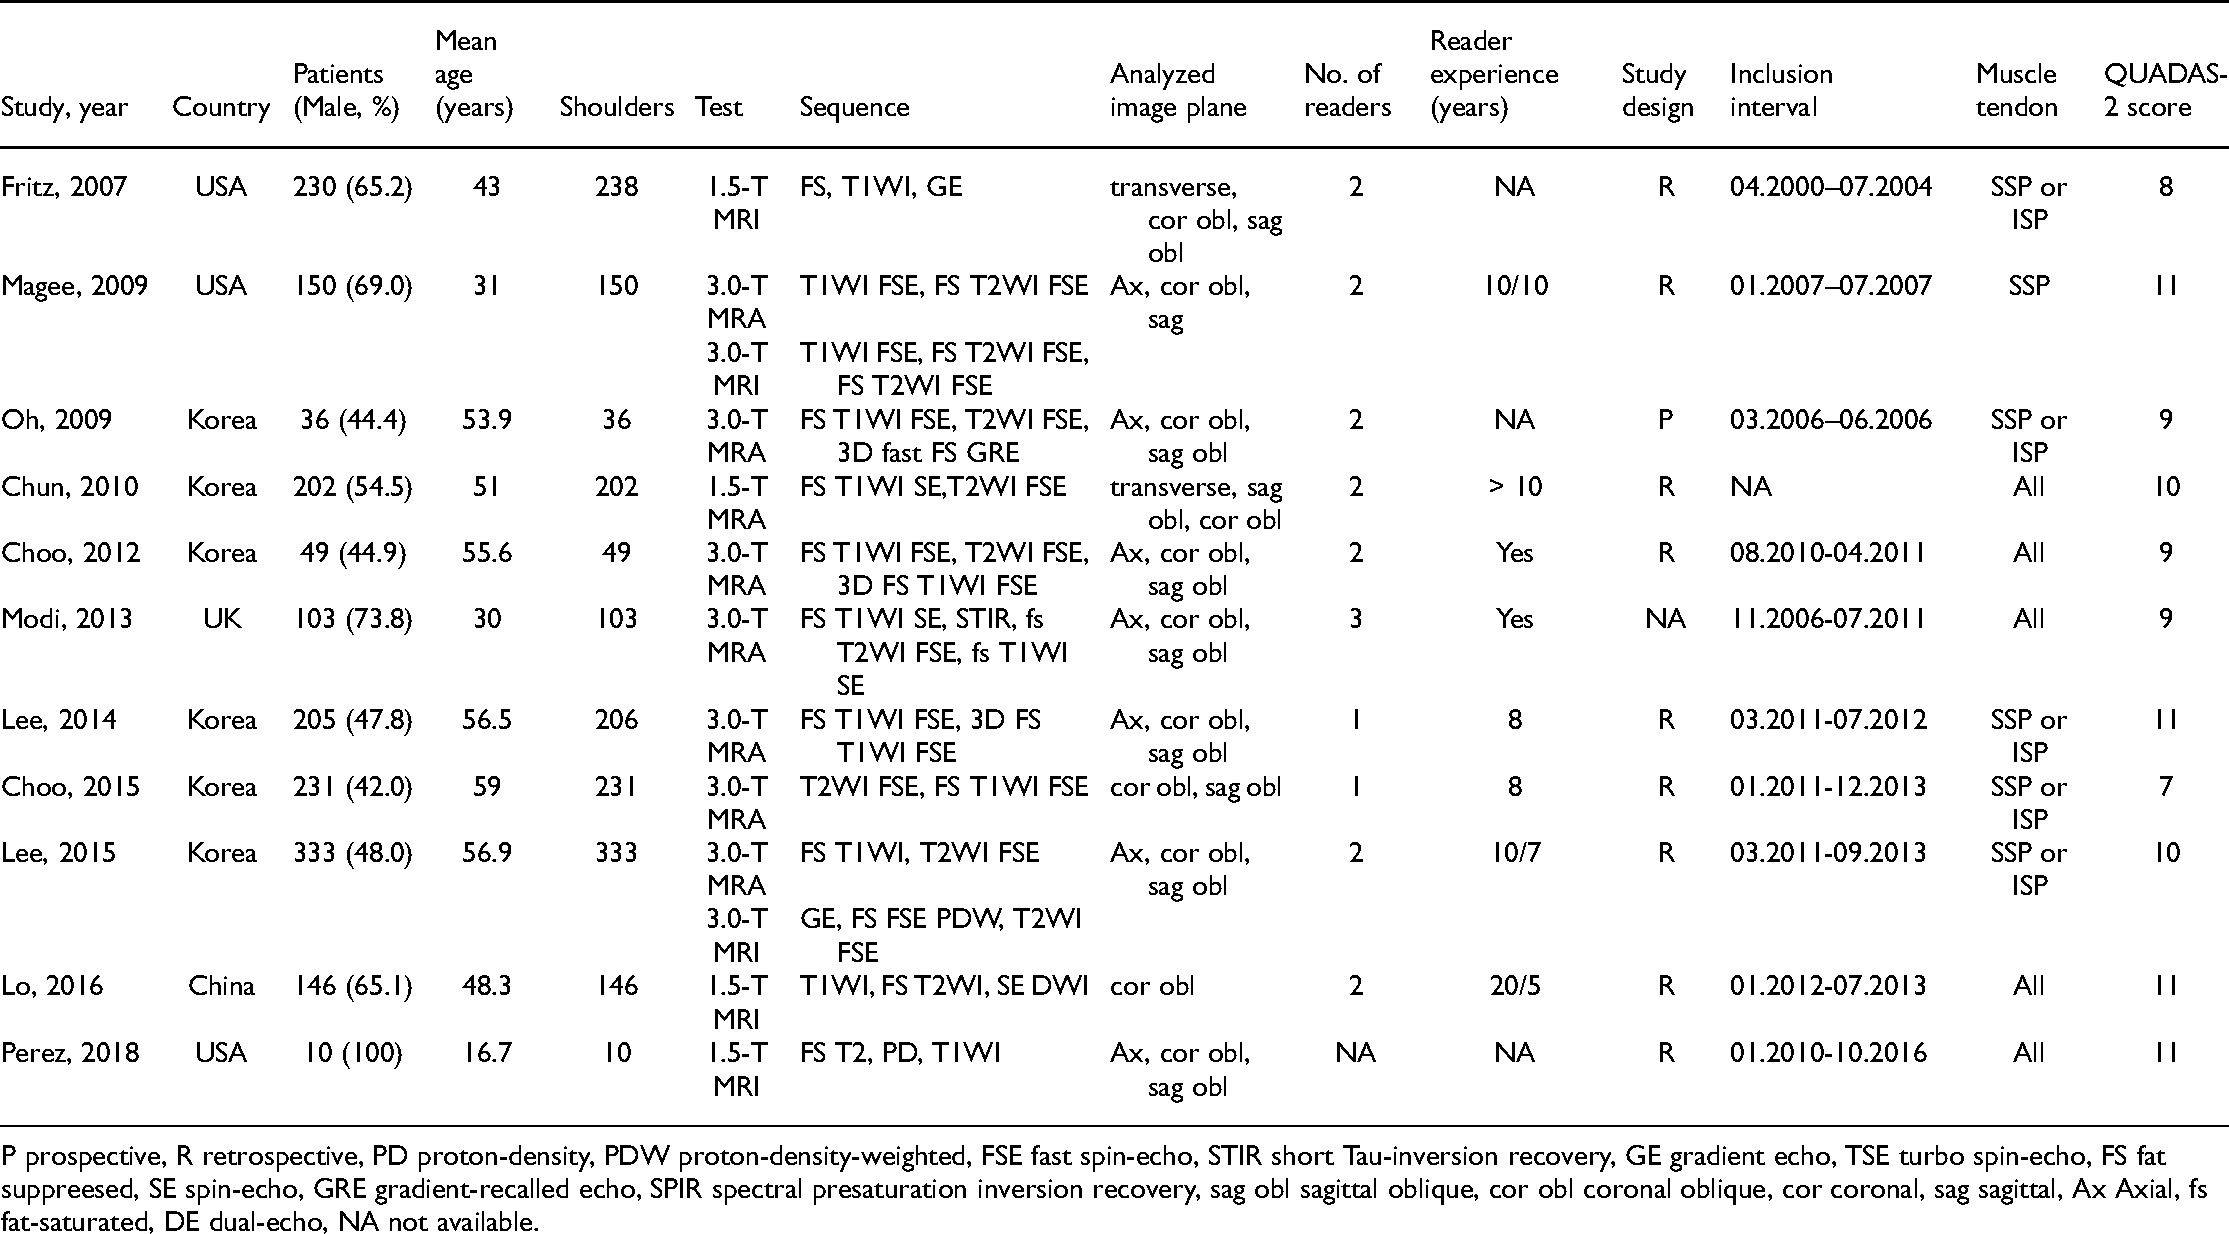
P prospective, R retrospective, PD proton-density, PDW proton-density-weighted, FSE fast spin-echo, STIR short Tau-inversion recovery, GE gradient echo, TSE turbo spin-echo, FS fat suppreesed, SE spin-echo, GRE gradient-recalled echo, SPIR spectral presaturation inversion recovery, sag obl sagittal oblique, cor obl coronal oblique, cor coronal, sag sagittal, Ax Axial, fs fat-saturated, DE dual-echo, NA not available.
Diagnostic value of MRA
In total, eight studies8,13–19 evaluated the performance of MRA to diagnose articular-sided partial-thickness RCTs. The pooled sensitivity, specificity, PLR, NLR, DOR and AUC were 0.81 (95% CI, 0.65–0.90), 0.96 (95% CI, 0.91–0.98), 13.94 (95% CI, 7.25–26.80), 0.23 (95% CI, 0.12–0.44), 68.14 (95% CI, 33.20–139.84) and 0.96 (95% CI, 0.94–0.97), respectively (Figures 1A and 2A, Table 2). TheI 2 statistics for sensitivity and specificity values were 77.19% (95% CI, 61.56%-92.81%) and 88.15% (95% CI, 81.33%-94.97%), respectively, indicating substantial heterogeneity among the included studies. The results of meta-regression analysis revealed that patient sample size, publication year, magnetic field strength, the number of readers, design of the study, blinding, the results of QUADAS-2 score and muscle-tendon did not account for the heterogeneity of sensitivity and specificity and the Deeks' Funnel Plot Asymmetry Test revealed no publication bias (p-value = 0.61) (Figure 3A).
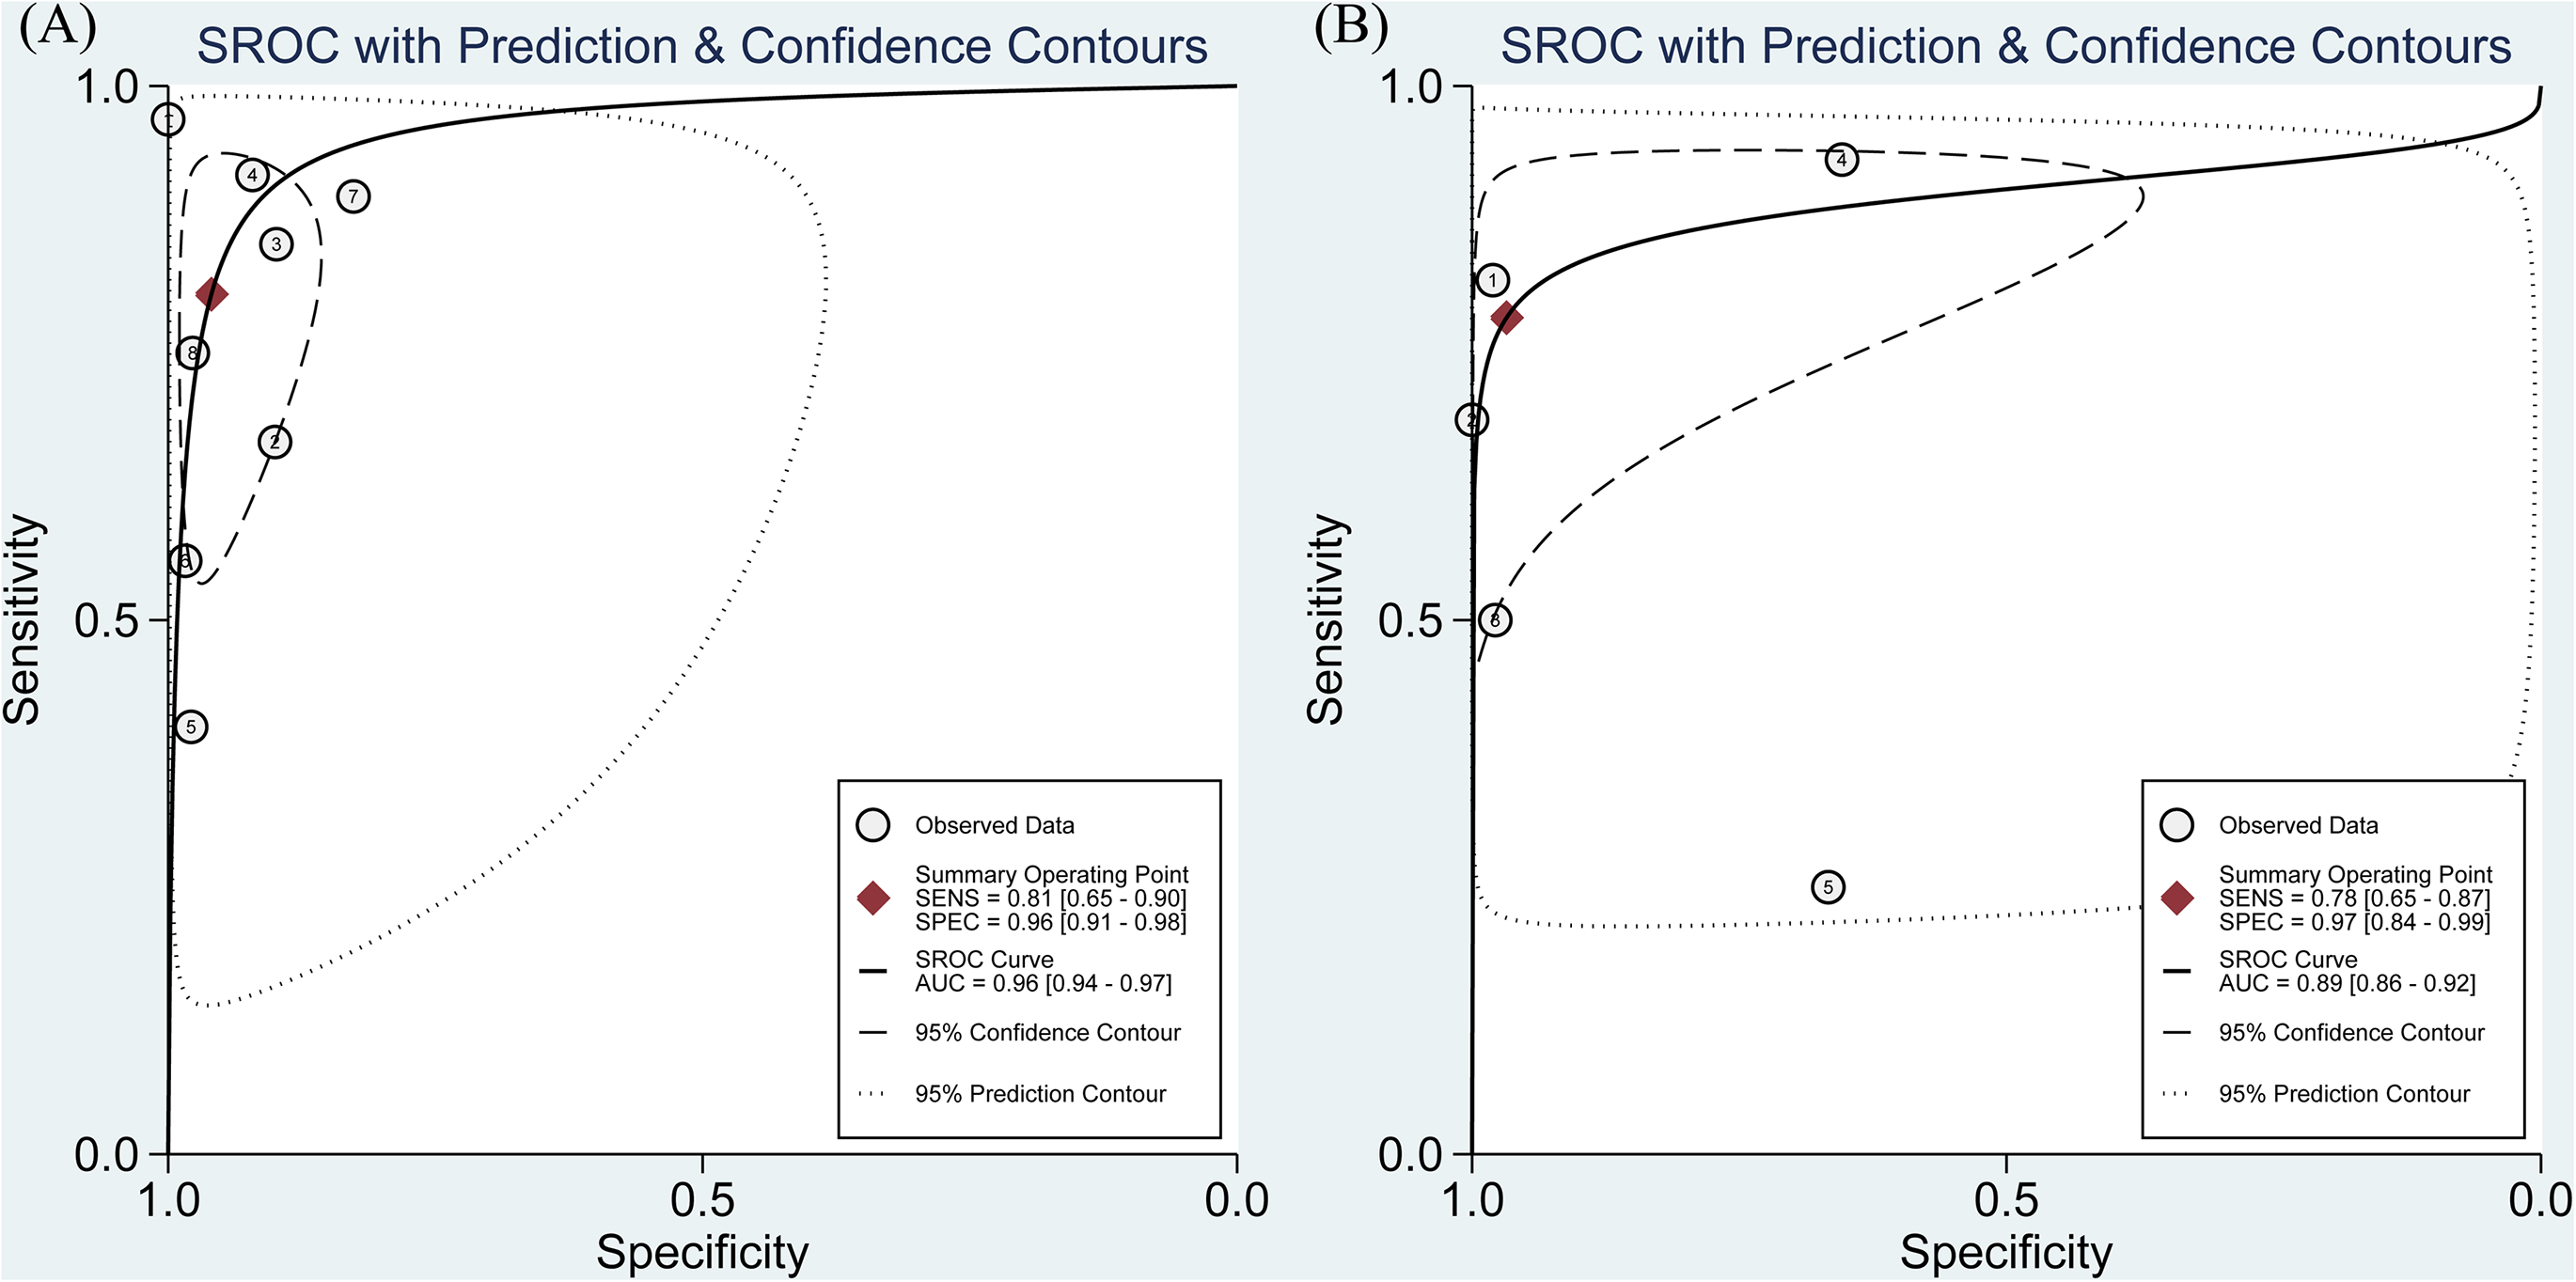
The pooled sensitivity, specificity, and summarized receiver operating characteristic curve (SROC) of MRA (A) and MRI (B) to diagnose articular-sided partial-thickness rotator cuff tears with the corresponding 95% confidence region.

Forest plots of the pooled diagnostic odds ratio (DOR) of MRA (A) and MRI (B) to diagnose articular-sided partial-thickness rotator cuff tears with the corresponding 95% confidence region.

Graphical display of the results of Deek's test for publication bias of MRA (A) and MRI (B).
The accuracy of MRA and MRI for detection of articular-sided partial-thickness rotator cuff tears.

MRA magnetic resonance angiography, MRI magnetic resonance imaging, T tesla, PLR positive likelihood ratio, NLR negative likelihood ratio, DOR diagnostic odd ratio, AUC area under curve, CI confidence interval.
Diagnostic value of MRI
In total, five studies12,13,17,20,21 assessed the performance of MRI to diagnose articular-sided PTRCTs. The pooled sensitivity, specificity, PLR, NLR, DOR and AUC were 0.78 (95% CI, 0.65–0.87), 0.97 (95% CI, 0.84–0.99), 11.85 (95% CI, 1.71–82.19), 0.34 (95% CI, 0.17–0.67), 47.82 (95% CI, 8.29–275.89) and 0.89 (95% CI, 0.86–0.92), respectively (Figures 1B and 2B, Table 2). TheI 2 statistics for sensitivity and specificity values were 71.57% (95% CI, 45.21%-97.93%) and 95.17% (95% CI, 92.36%-97.97%), respectively, indicating substantial heterogeneity among the included studies. The Deeks' Funnel Plot Asymmetry Test revealed no publication bias (p-value = 0.18) (Figure 3B).
When p values were calculated, MRA showed statistically significantly increased sensitivity compared with conventional MRI for the articular-sided partial-thickness rotator cuff tears (p = 0.038); however, there was not a statistically significant difference shown between MRI and MRA for specificity in detection of the articular-sided partial-thickness rotator cuff tears.
Discussion
This meta-analysis involving eight studies8,13–19 for MRA and five studies12,13,17,20,21 for MRI, reveals that MRA has a better diagnostic value than that of MRI for the diagnosis of articular-sided partial-thickness rotator cuff tears because of an improvement of sensitivity (0.81 vs. 0.78).
It has become a popular topic whether contrast agent is used in the application of MRI to diagnose RCTs. A network meta-analysis of 144 diagnostic studies involving 14,059 patients (14,212 shoulders) demonstrated that for the detection of full-thickness tears, partial-thickness tears or any tear, MRA had the highest sensitivity, specificity and superiority index in three common-used imaging modalities (MRA, MRI and US), which revealed that high-field MRA had the highest diagnostic value for detecting any tear, followed by low-field MRA, high-field MRI, high-frequency US, low-field MRI, and low-frequency US. 6 In addition, another meta-analysis of 14 studies involving 1216 patients with labral lesions revealed that MRA had the highest sensitivity and specificity compared with those of MRI and CTA, which indicated that MRA was suggested for use in patients with chronic shoulder symptoms or a pathological abnormality. 22 MRA has a good diagnostic performance mainly depending on the objective evidence of the leakage of contrast agent, accompanied by a good anatomic resolution and subtle defects depicted by contrast agents.23,24 Nonetheless, MRA, as an invasive diagnosis modality, has many disadvantages and limitations, including a longer examination time, increased risk of infection and adverse complications.25,26
MRI, as a non-invasive and reproducible diagnosis image, was recommended for the diagnosis of a patient with suspected rotator cuff injuries. 27 Our lab's research 6 confirmed that the diagnostic value rank (from high to low) of commonly used modalities was 3.0-T MRA, 1.5-T MRA, 3.0-T MRI, 7.5-MHz US, 1.5-T MRI and < 7.5-MHz US in the diagnosis of full-thickness tears; however, in the diagnosis of partial-thickness tears, the diagnostic value rank (from high to low) was 3.0-T MRA, 3.0-T MRI, 1.5-T MRA, 7.5-MHz US, 1.5-T MRI and < 7.5-MHz US. Moreover, other research performed in our lab's confirmed that MRI had similar sensitivity and specificity to MRA in the detection of bursal-sided PTRCTs. 9 In addition, another meta-analysis revealed that MRI is by far the first choice recommendation for imaging modality for the detection of acute labral lesions. 22 Recently, one study in 2020 using hierarchical summary receiver operating characteristic curves (HSROC) demonstrated that MRI was recommended to be a first-choice imaging modality for the detection of rotator cuff tears. 28 Although MRA has a higher sensitivity and specificity, it cannot replace MRI after the comprehensive consideration of accuracy and practicality.
In this study, MRA has a sensitivity of 0.81 and specificity of 0.96 for detecting articular-sided PTRCTs; however, MRI shows a sensitivity of 0.78 and specificity of 0.97 in the detection of the articular-sided PTRCTs. The differences in specificity and sensitivity between MRA and MRI may be a good reason to avoid the potential risk/cost of MRA. This result is in accordance with a prospective study that the sensitivity and specificity of MRA were improved only by 3% to 4% when compared with MRI. 26
Several limitations in this research should merit consideration. At first, the number of patients in the included studies is very small and most of the included studies are retrospective type. Evidence of heterogeneity in the pooled data existed across the included studies. We used the meta-regression analysis to explore many factors that may bring the heterogeneity, including the patient sample size, publication year, magnetic field strength, number of readers, blinding and QUADAS-2 score, design of the study (prospective or retrospective) as well as muscle-tendon were used as covariates. Even though we found the source of heterogeneity, the insufficient data cannot support us to conduct relevant subgroup analyses, which will reduce statistical efficacy power. Furthermore, the field density is very important for the diagnostic value of MRI or MRA in the detection of articular-sided PTRCTs; however, the insufficient data about the field density of MRA/MRI cannot support us to analyze this important influence. We assessed only the diagnostic value of the imaging modalities alone (MRA or MRI) without physical tests. Finally, the safety and cost-effectiveness of MRA/MRI in clinical practice should be assessed systematically.
Conclusion
This meta-analysis reveals that MRA has a better diagnostic value than that of MRI for the diagnosis of articular-sided partial-thickness rotator cuff tears because of an improvement of sensitivity.
Footnotes
Acknowledgements
We thank Research Square to provide a platform that this article has been accepted for publication as a pre-print (DOI: 10.21203/rs.3.rs- 53384/v1).
Funding
This study was supported by the China Scholarship Council (CSC) (Fanxiao Liu, grant number 201808080126), the incubation fund of Shandong Provincial Hospital (Fanxiao Liu, grant number 2020FY019), the Young Scholars Program of Shandong Provincial Hospital, and the Natural Science Foundation of Shandong Province (Fanxiao Liu, grant number ZR202102180575).
Availability of data and materials
All data generated or analyzed during this study are included in this published article.
Authors’ contributions
LFX, DJL and LLX conceived and designed the study. LFX, DJL and LLX performed the search, extraction of data, and methodological assessment. All authors analyzed the data and wrote the paper. All authors read and approved the final manuscript.
Ethics approval and consent to participate
Not applicable.
Consent for publication
All authors read the final manuscript and approved for publication.
Competing interests
The authors declare that they have no competing interests.