
Abstract
Objectives
Multiple sclerosis (MS) usually relapses, about half become progressive after a period of time, few are progressive from the onset. Leptomeningeal ectopic lymphoid follicles with cell flow from the cranial bone marrow may be associated with progression. The aim of this retrospective study was to determine the predictive value of cranial bone signal intensity and to correlate it with other clinical features.
Methods
Retrospective clinical and radiological characteristics of 96 MS patients (16 primary progressive multiple sclerosis, 80 relapsing-remitting multiple sclerosis (RRMS)) and 60 controls (tension-type headache) were recorded. Frontal (F), occipital (O), clivus (C) and vitreous body (V) signal intensities were measured. The relationship between clinical features, disease course and radiological findings were analyzed.
Results
The mean age was 39.58±0.84 years. Twenty-five patients converted to secondary progressive multiple sclerosis (SPMS). Changes in the ratio of F, O, C density to V were similar between groups. At baseline, ratio of frontal bone marrow intensity to vitreous body intensity (F/V) was lower in SPMS and RRMS compared to control, and ratio of occipital bone marrow intensity to vitreous body intensity (O/V) was lower in SPMS compared to control. Low F/V on initial magnetic resonance imaging had diagnostic potential for RRMS, and low F/V and low O/V had diagnostic marker potential for conversion to SPMS.
Conclusions
Cranial bone intensity in multiple sclerosis patients may be a clue for future disease severity or conversion to SPMS.
Keywords
Introduction
Multiple sclerosis (MS) is a chronic inflammatory disease of the central nervous system (CNS), characterized by autoimmune demyelination and neurodegeneration. 1 MS often begins in the fourth decade of life (i.e. 30s), with relapses and remissions (i.e. relapsing-remitting multiple sclerosis [RRMS]). At disease onset, inflammation, which is characterized by the distribution of perivascular T and B lymphocytes in the parenchyma, is prominent. With advancing age and disease duration, inflammation decreases and neurodegeneration becomes more severe. In some patients, progression becomes predominant approximately 15 years after disease onset (secondary progressive multiple sclerosis [SPMS]). There may also be a form in which progression is more pronounced at onset or with progression only (i.e. primary progressive multiple sclerosis [PPMS]). However, whether PPMS has a separate pathophysiology remains controversial. 2
Current knowledge of inflammatory infiltrates in the CNS compartments and their importance in pathophysiology is accumulating. Active white matter lesions with disruption of the blood–brain barrier (BBB) are prominent in early MS. In contrast, in progressive MS, the BBB is relatively preserved and increased gray matter demyelination, brain atrophy, severe oxidative damage, focal areas of inflammation in the meninges, and the development of ectopic lymphoid follicles (ELFs) as tertiary lymphoid structures may be observed.3–7 In progressive MS, B and T cells clustered in the meninges exhibit an organization reminiscent of secondary lymphoid organs (spleen, lymph nodes, etc.). As such, they are called “ectopic lymphoid follicles” and play a role in antigen encounters and immune responses in the adaptive immune system.8,9
In the CNS, ELFs can be found in the cerebellum, brainstem, or spinal cord, but are mainly found adjacent to large subpial cortical lesions in the subarachnoid space of the meninges entering the cerebral sulci. 7 ELF are widely distributed throughout the forebrain, most commonly in the deep sulci of the frontal, temporal, cingulate, and insular cortex. 6 Monocytes, neutrophils, and locally developed B cells in the neighboring skull or vertebral bone marrow are the immune pools in the meningeal myeloid compartment and ELF. Here, there is a constantly renewed flow toward the EFL. Chemokines promote cell migration, especially from the local bone marrow to the vascular space.10,11
In addition to MS-specific diagnostic and prognostic radiological imaging, many immunological markers in the serum or cerebrospinal fluid (CSF) have the potential to predict inflammation or neurodegeneration.12–16 However, these are difficult and expensive advanced imaging methods or invasive (CSF examination) immunological techniques that are challenging to use routinely. However, evaluating the bone marrow from which the EFL originate may indirectly provide diagnostic clues. Accordingly, this study investigated the relationship between differences in skull bone marrow intensity, alterations, and disease activation or progression in patients diagnosed with MS.
Methods
Patient selection
Among 5230 patients diagnosed with MS (International Classification of Diseases10th [ICD] code: G.35), according to the 2010 and 2017 revised McDonald criteria between September 2013 and 2023, at the Bursa Uludağ University Faculty of Medicine, Department of Neurology (Bursa, Türkiye), 350 patients who underwent 1.5 Tesla (T) magnetic resonance imaging (MRI) more than twice on the same device were selected by computer-assisted randomized selection. In total, 547 patients were diagnosed with tension-type headache (ICD code G44.2) at the same time intervals and underwent 1.5 T MRI using the same device. After excluding patients with contrasting lesions on MRI, patients in the attack period, those with incomplete clinical data (number of attacks, expanded disability status scale [EDSS] score, and disease-modifying therapies [DMTs] used), and those with additional pathologies that may affect skull bone marrow intensity, 156 were included in the study: 96 in the patient group (PPMS [n=16]; RRMS [n=80] on the first MRI, 25 of whom were converted to SPMS on the last MRI); and 60 in the control group (first MRI [C-F]; n = 30, last MRI [C-L]; n = 30). Detailed selection criteria are reported in Figure 1, and the definitions of the study groups and groups between which the analyses were performed are reported in Figure 2.
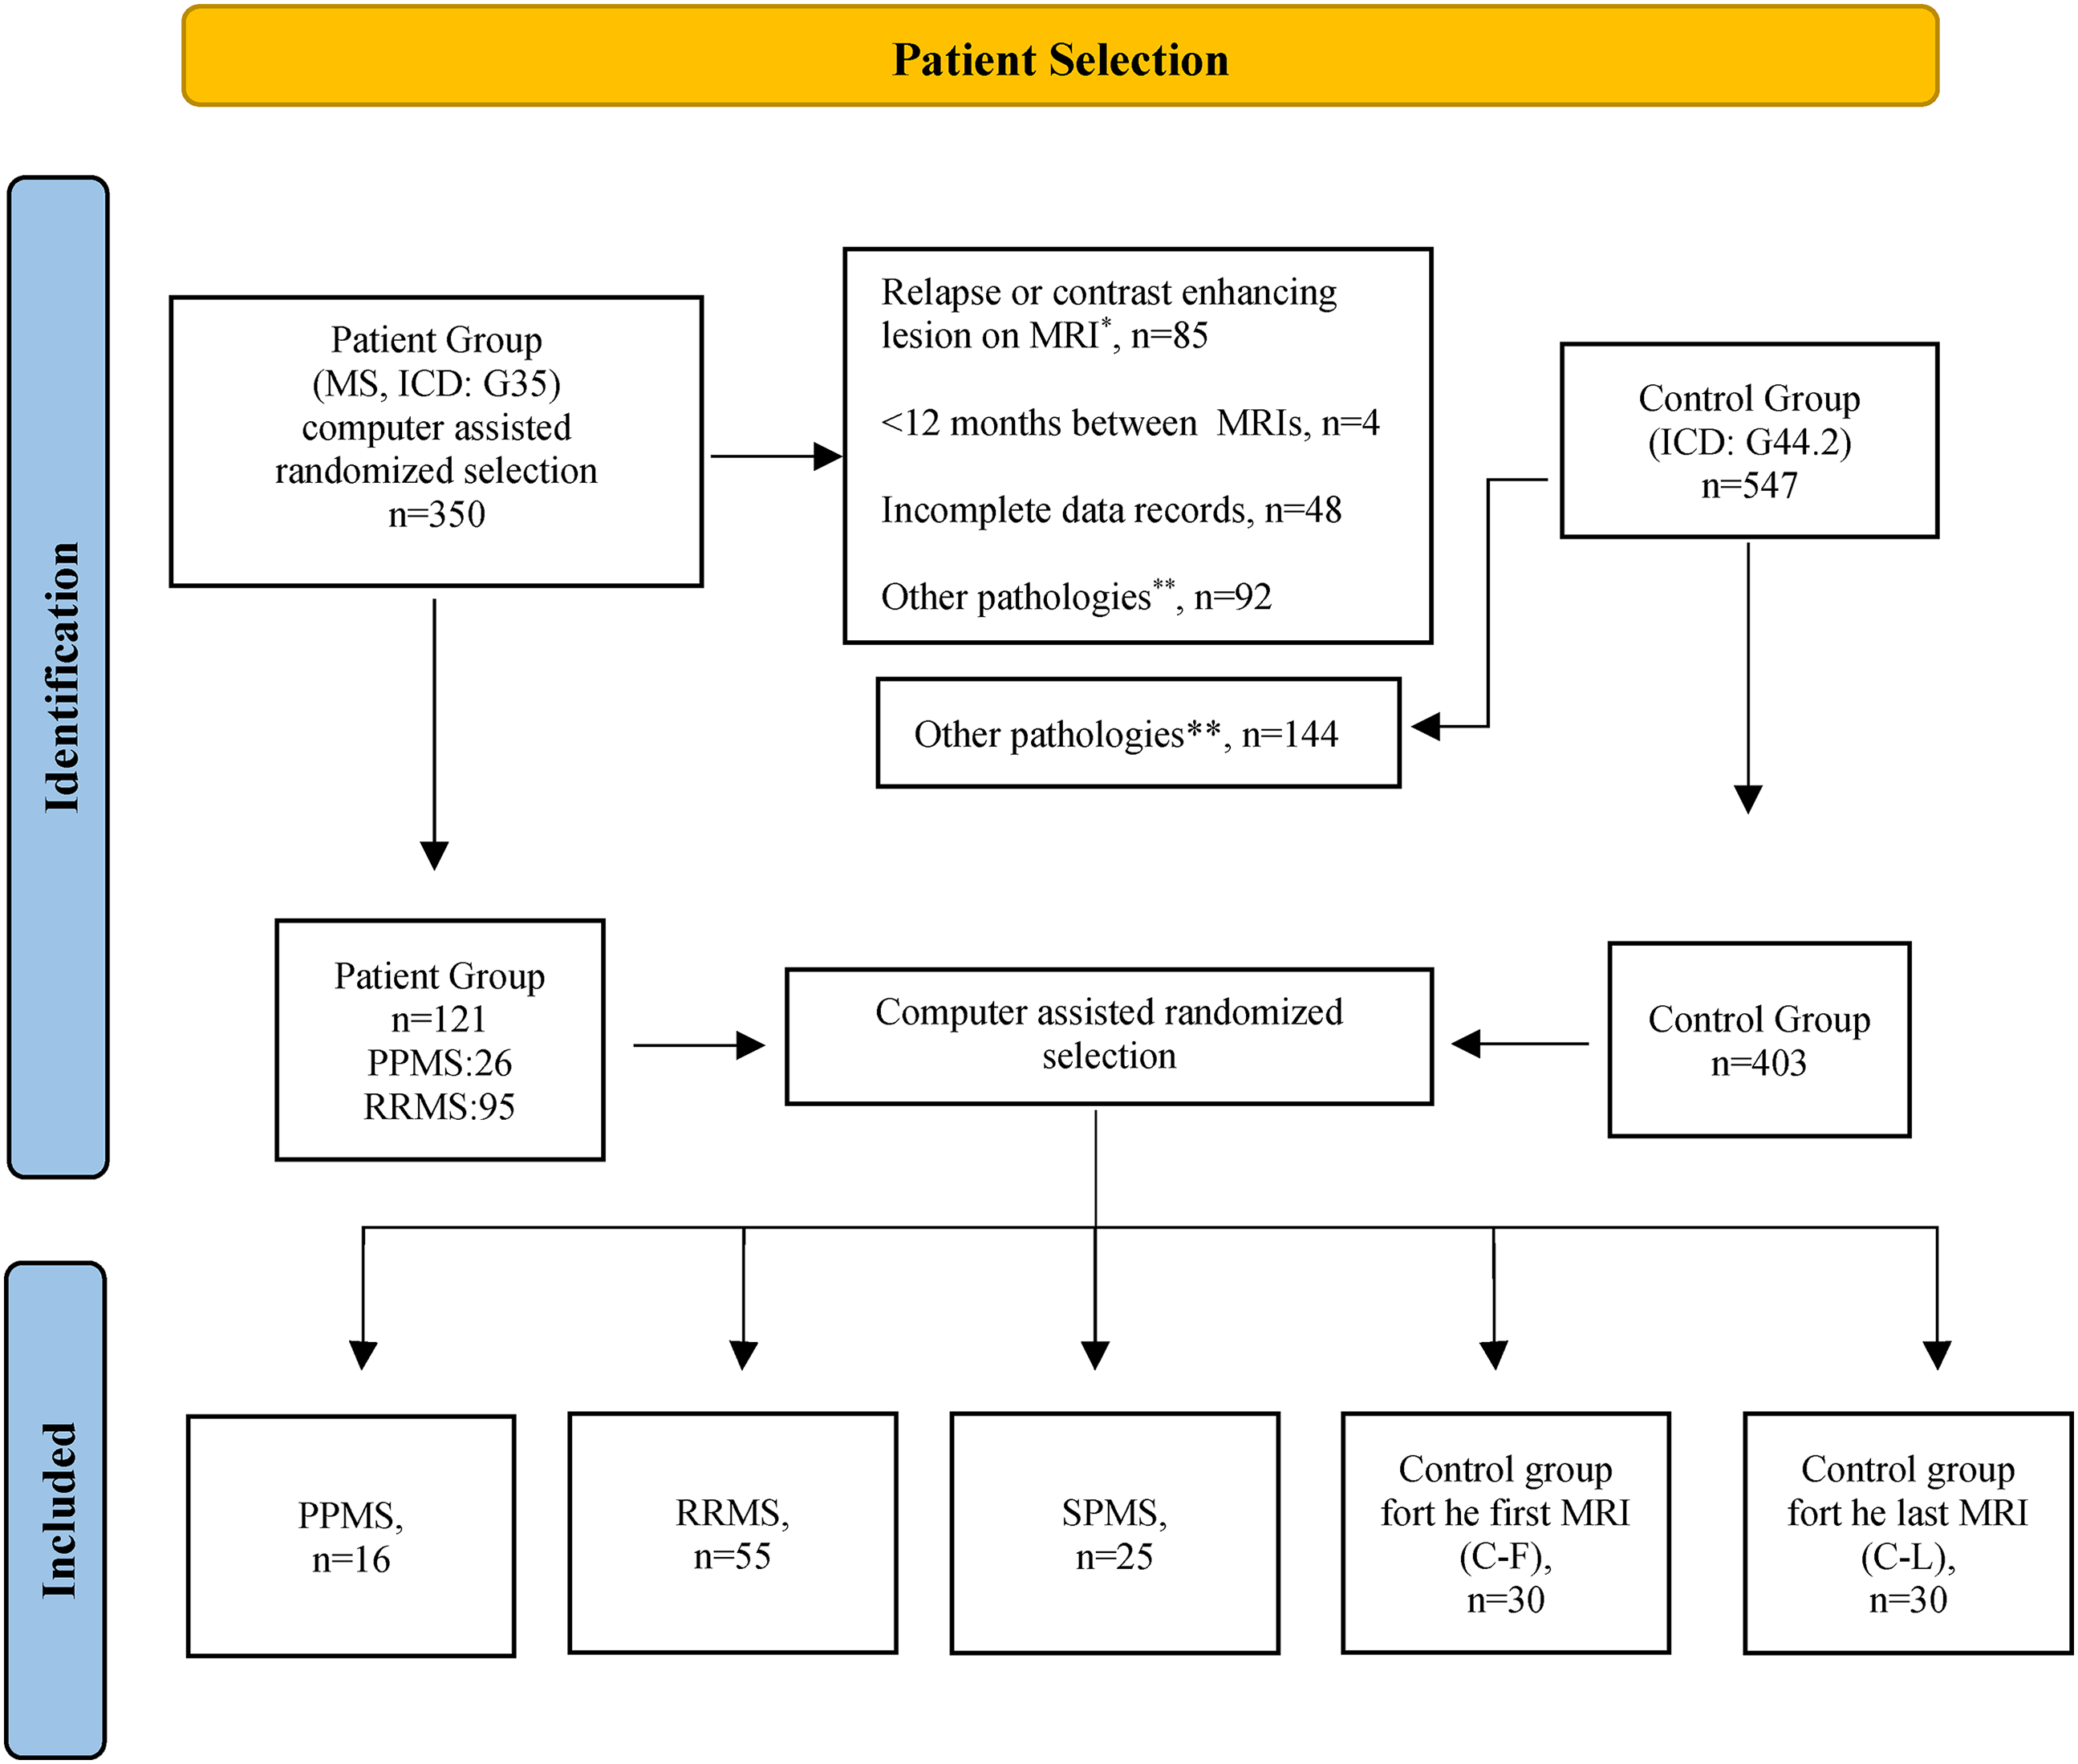
Patient selection flowchart.
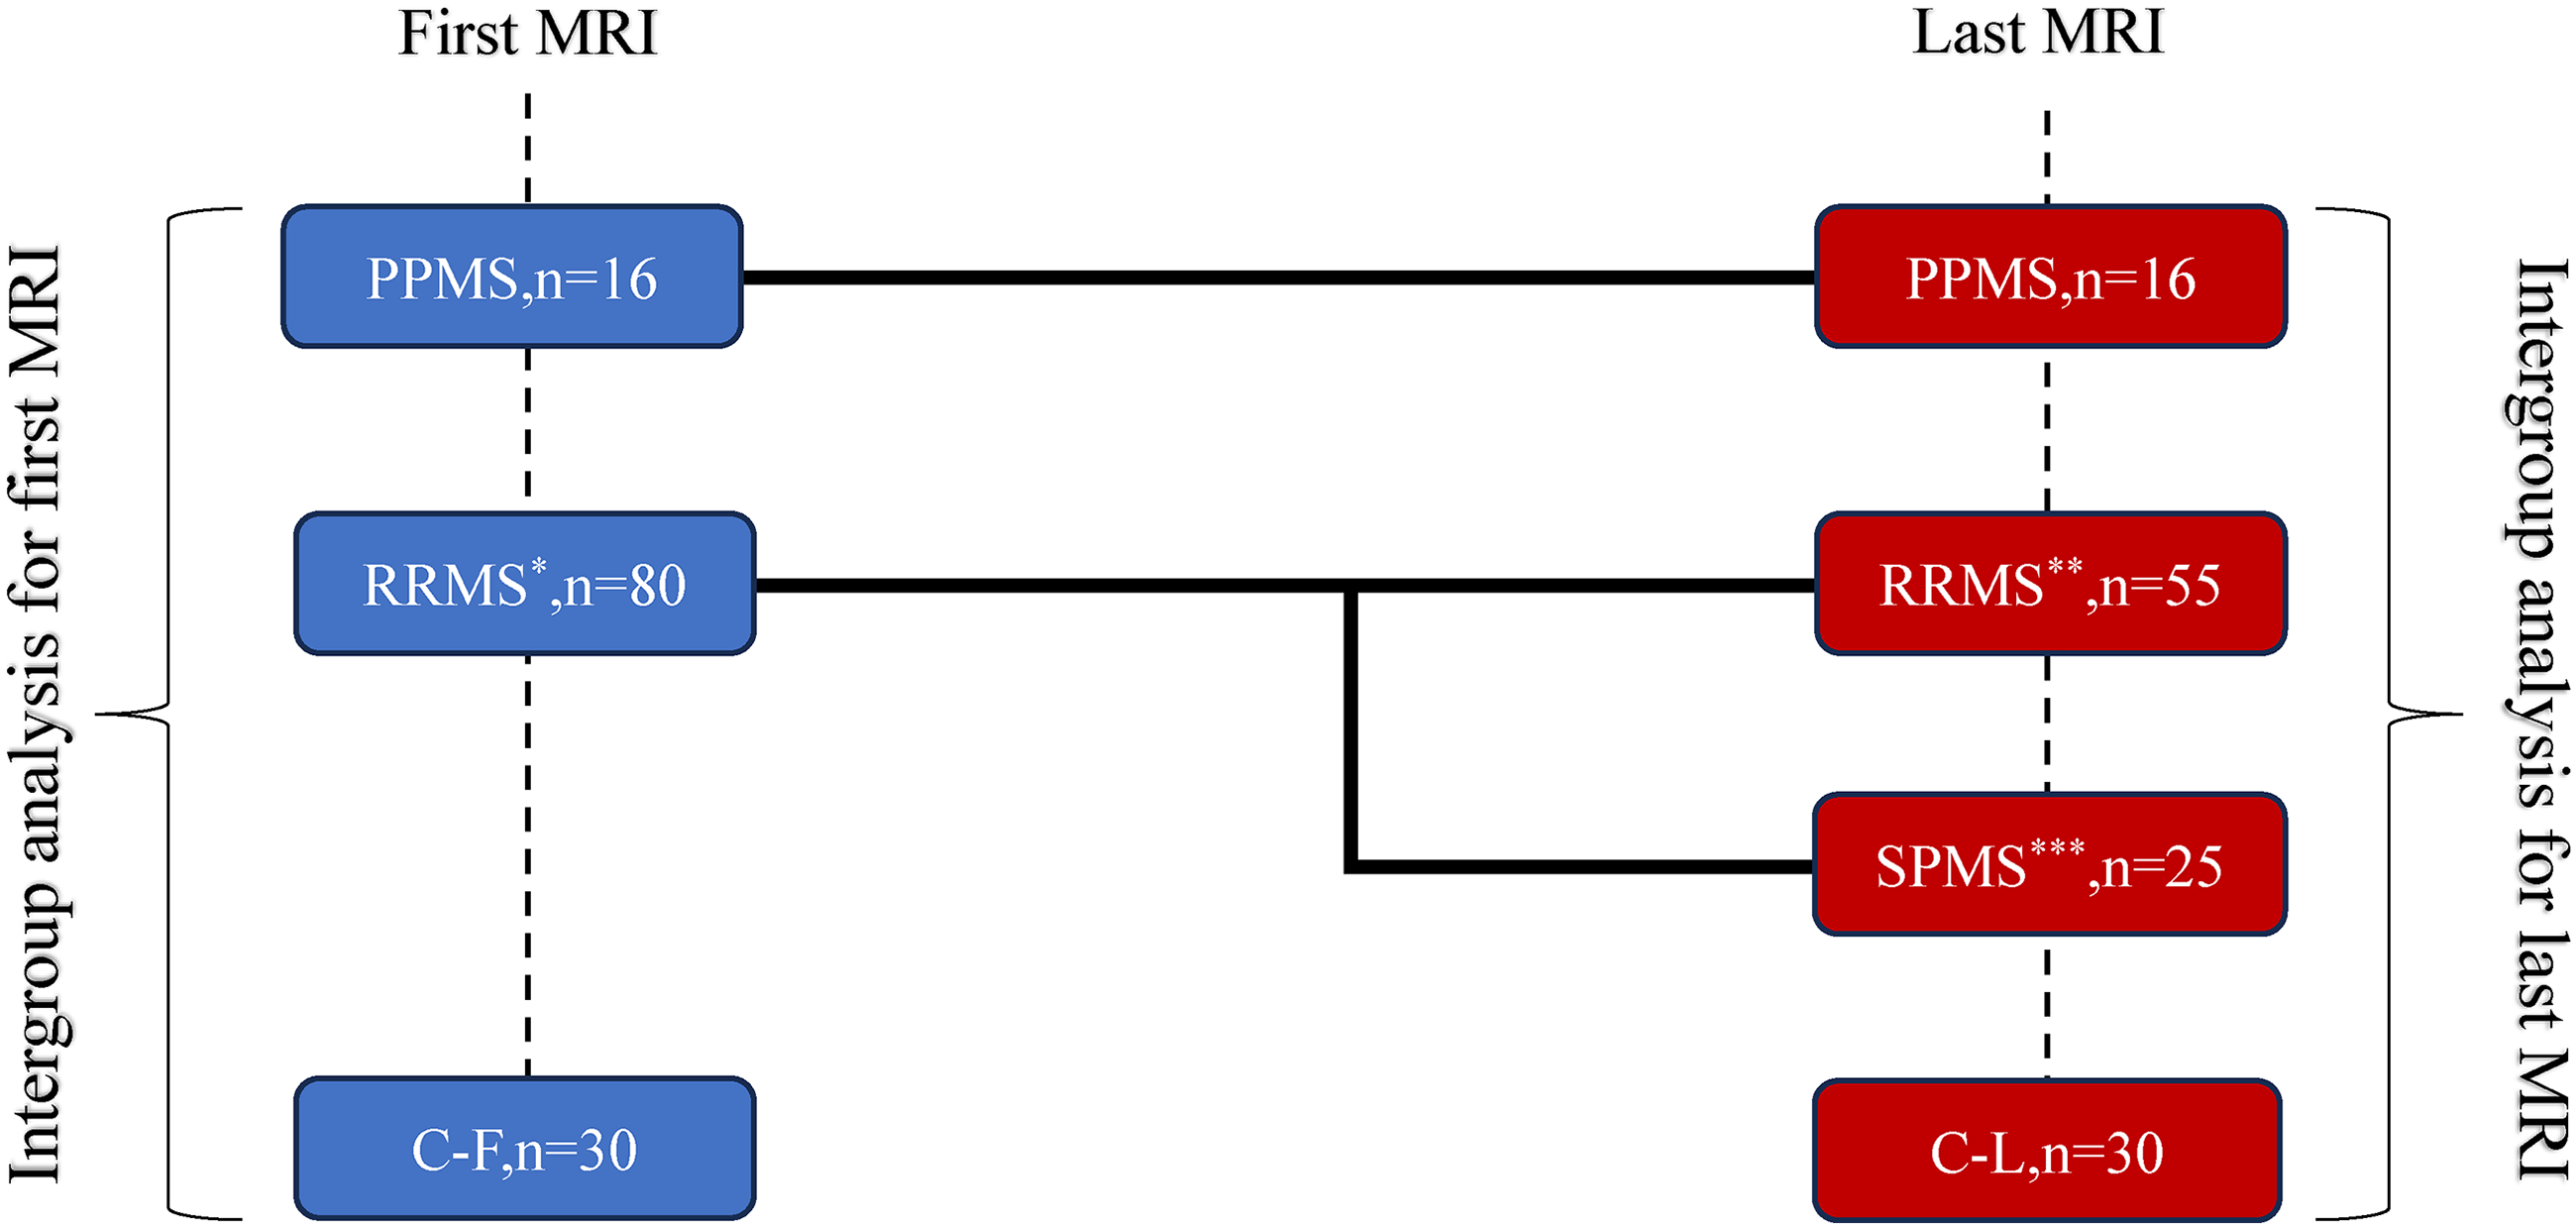
Study groups and design.
Clinical parameters
Demographic data, MS subtype(s), dates of the first disease-related symptom, EDSS scores at the time of diagnosis or at the time of the first or last MRI, total number of attacks, annualized relapse rate (ARR) up to the first MRI and between MRIs, and DMTs used were recorded. During follow-up of patients with RRMS, an increase ≥ 0.5 points in EDSS independent of relapse for 6 months was defined as SPMS. Disability progression was defined as an increase of 1.5 points if the initial EDSS score was 0, 1.0 point if <5.5, or 0.5 points if ≥5.5, as confirmed at 6-month intervals. ARR assessment before the first MRI was not performed for those with <1 year interval between the date of the first MRI and diagnosis of RRMS (n=26). The ARR between the 2 MRIs was evaluated in all patients with RRMS.
MRI protocol and interpretation
All examinations were performed using a 1.5 T MRI devise (Aera, Siemens, Erlangen, Germany). Axial T1-weighted spin-echo images without contrast were obtained using standard parameters (repetition time, 576 ms; echo time, 8 ms; slice thickness, 5 mm; slice spacing, 6 mm; and flip angle, 90°). All measurements were performed according to the consensus decision of two expert observers with 23 and 7 years’ experience in neuroradiology, respectively. Signal intensity values of the normal-appearing frontal and occipital bones and vitreous body were measured using Picture Archiving and Communication System software (Sectra IDS7; medical.sectra.com). Occipital bone measurements were performed at the midline, posterior one-third of the superior sagittal sinus, and the level at which the medulla of the occipital bone was observed. Frontal bone measurements were obtained at the medulla from the beginning of the upper part of the ventricles on the right or left side. Vitreous body measurements were performed at the section where the normal-appearing right or left optic globe was the widest (Appendix 1). For all measurements, the radiology assistant drew a circumferential region of interest (i.e. “ROI”) with a diameter of 2 mm at the center, equally spaced inside and outside as judged appropriate by two experienced neuroradiologists, and recorded the values.
The radiological data obtained were analyzed and compared with demographic characteristics, MS disease types (i.e. PPMS, RRMS, or SPMS), and clinical features. Because there were no two separate MRI scans for the same patient in the control group that were evaluated retrospectively, patient data were compared with the images of two different control groups (for the first MRI [i.e. C-F], and the last MRI [i.e. C-L]). Because bone marrow intensities may change with age, independent of other parameters, a preliminary analysis was performed with the first and last MR images. There were no differences between the study groups in terms of age, sex, or time between MRI scans (Table 1, Appendix 2). Clivus density correlated poorly with age at the first MRI in patients with PPMS and at the last MRI in patients with RRMS, whereas vitreous density correlated poorly with age only in the C-L group. However, this did not affect the differences in intensities measured between the groups (Appendix 3). However, although no effect of age or sex was found in the preliminary analyses, the ratio of bone density to vitreous density in the same MRI scan of the same patient was considered to be the main parameter to exclude any possible effect of bone marrow density and to standardize the results, mainly by establishing an internal self-reference.
Descriptive data and clinical characteristics of the patient and control groups.

For the first MRI, the evaluation was performed between PPMS/RRMS at baseline/C-F, and for the last MRI, the evaluation was performed between PPMS/Remanin with RRMS/subsequent conversion to SPMS/C-L groups. Data are given as mean±st deviation, median (min–max).
aRespectively, injection treatments (Interferons or Glatiramer acetate), Terifunomide, Dimethyl fumarate, Fingolimod, Cladribine, Ocrelizumab, Natalizumab, Alemtuzumab, Mitoxantrone and no treatment.
MS: multiple sclerosis; RRMS: relapsing-remitting multiple sclerosis; SPMS; secondary progressive multiple sclerosis; PPMS: primary progressive multiple sclerosis; MRI: magnetic resonance imaging; DMT: disease-modifying therapy; ARR; annualized relapse rate.
Statistical analysis
Data normality was analyzed using the Shapiro–Wilk test. Descriptive statistics are expressed as mean, standard deviation (SD), or median (minimum–maximum) for quantitative data, and frequency and percentage for qualitative data. One-way analysis of variance was used to compare >2 groups of normally distributed data, while the Kruskal–Wallis test was used for non-normally distributed data. The Mann–Whitney U test was used for non-normally distributed data in independent, two-group comparisons. Pearson's chi-squared, Fisher-Freeman–Halton, and Fisher's exact chi-squared tests were used to analyze categorical data. For statistical significance, the Bonferroni multiple comparison test was used. The relationships between variables were analyzed using Pearson's correlation coefficient. Differences with p < 0.05 were considered to be statistically significant. Data analysis was performed using SPSS version 28.0 (IBM Corp., Armonk, NY, USA) for Windows (Microsoft Corp., Redmond, WA, USA). Receiver operating characteristic curve analysis was used to determine the threshold values in valence according to the variables ratio of frontal and occipital bone marrow intensity to vitreous body intensity (ratio of frontal bone marrow intensity to vitreous body intensity (F/V) and ratio of occipital bone marrow intensity to vitreous body intensity (O/V), respectively) at the first MRI between patients in the RRMS and SPMS groups and individuals in the control group. Graph were generated with GraphPad Prism version 9.5.0 (GraphPad Software, Inc., San Diego, CA) for comparison of bone intensity ratios.
This retrospective study was performed in accordance with the 1975 Declaration of Helsinki, revised in 2024, with the approval of the ethics committee and the de-identification of all patients’ personal information. This study is reported in accordance with the STROBE guidelines. 17
Results
Descriptive data and clinical characteristics
The mean (± SD) age at first diagnosis was 35.41 ± 0.91 years and 39.58 ± 0.84 years at the time of the first MRI. At the time of the first MRI, 16 patients had PPMS and 80 had RRMS. Twenty-five patients with RRMS were re-diagnosed with SPMS during the second MRI scan. Age, sex, time between MRIs, ARR, EDSS at the first MRI, and DMT distribution were not significantly different between the study groups. As expected, subsequent conversion to SPMS was associated with higher EDSS scores at the last MRI scan (p < 0.001) (Table 1). During the follow-up period between the two MRIs, 42% (n = 23) of patients with RRMS did not develop EDSS progression (EDSS-free), and 21.8% (n = 12) did not experience any relapse (relapse-free).
Radiological findings, association with MS groups, and clinical features
Changes in the ratios of the clivus, frontal (F/V), and occipital (O/V) bone intensities to the vitreous body between the first and last MRIs scans were similar between the MS and MS-control subgroups. However, there was a significant difference between F/V and O/V on the first MRI scan (Table 2). On the first MRI, the F/V was lower in the SPMS and RRMS groups than that in the control group (p < 0.001 and p = 0.001, respectively). O/V was lower in the SPMS group than that in the control group (p = 0.012) (Figure 3). The decrease in F/V was found in both sexes in the RRMS and SPMS groups, whereas a difference in O/V was observed only in females (Table 3). The effect of drugs on changes in intensity ratio could not be evaluated because the number of patients was insufficient for proper statistical evaluation.

Signal changes detected on the first MRI; ratio of bone marrow (BM) to vitreous body (VB).
Differences in the patient groups’ clivus, frontal or occipital bone intensity ratio.

Data are given as median (min–max). Significance p-value <0.05.
On the first MRI, F/V and O/V were lower in MS patients than in the control group (bold entries).
RRMS: relapsing-remitting multiple sclerosis; SPMS: secondary progressive multiple sclerosis; PPMS: primary progressive multiple sclerosis; MRI: magnetic resonance imaging; O//V: ratio of occipital bone marrow intensity to vitreous body intensity; F/V: ratio of frontal bone marrow intensity to vitreous body intensity.
Sub-analyses of significant differences in F/V or O/V at first MRI for patient groups and sex.
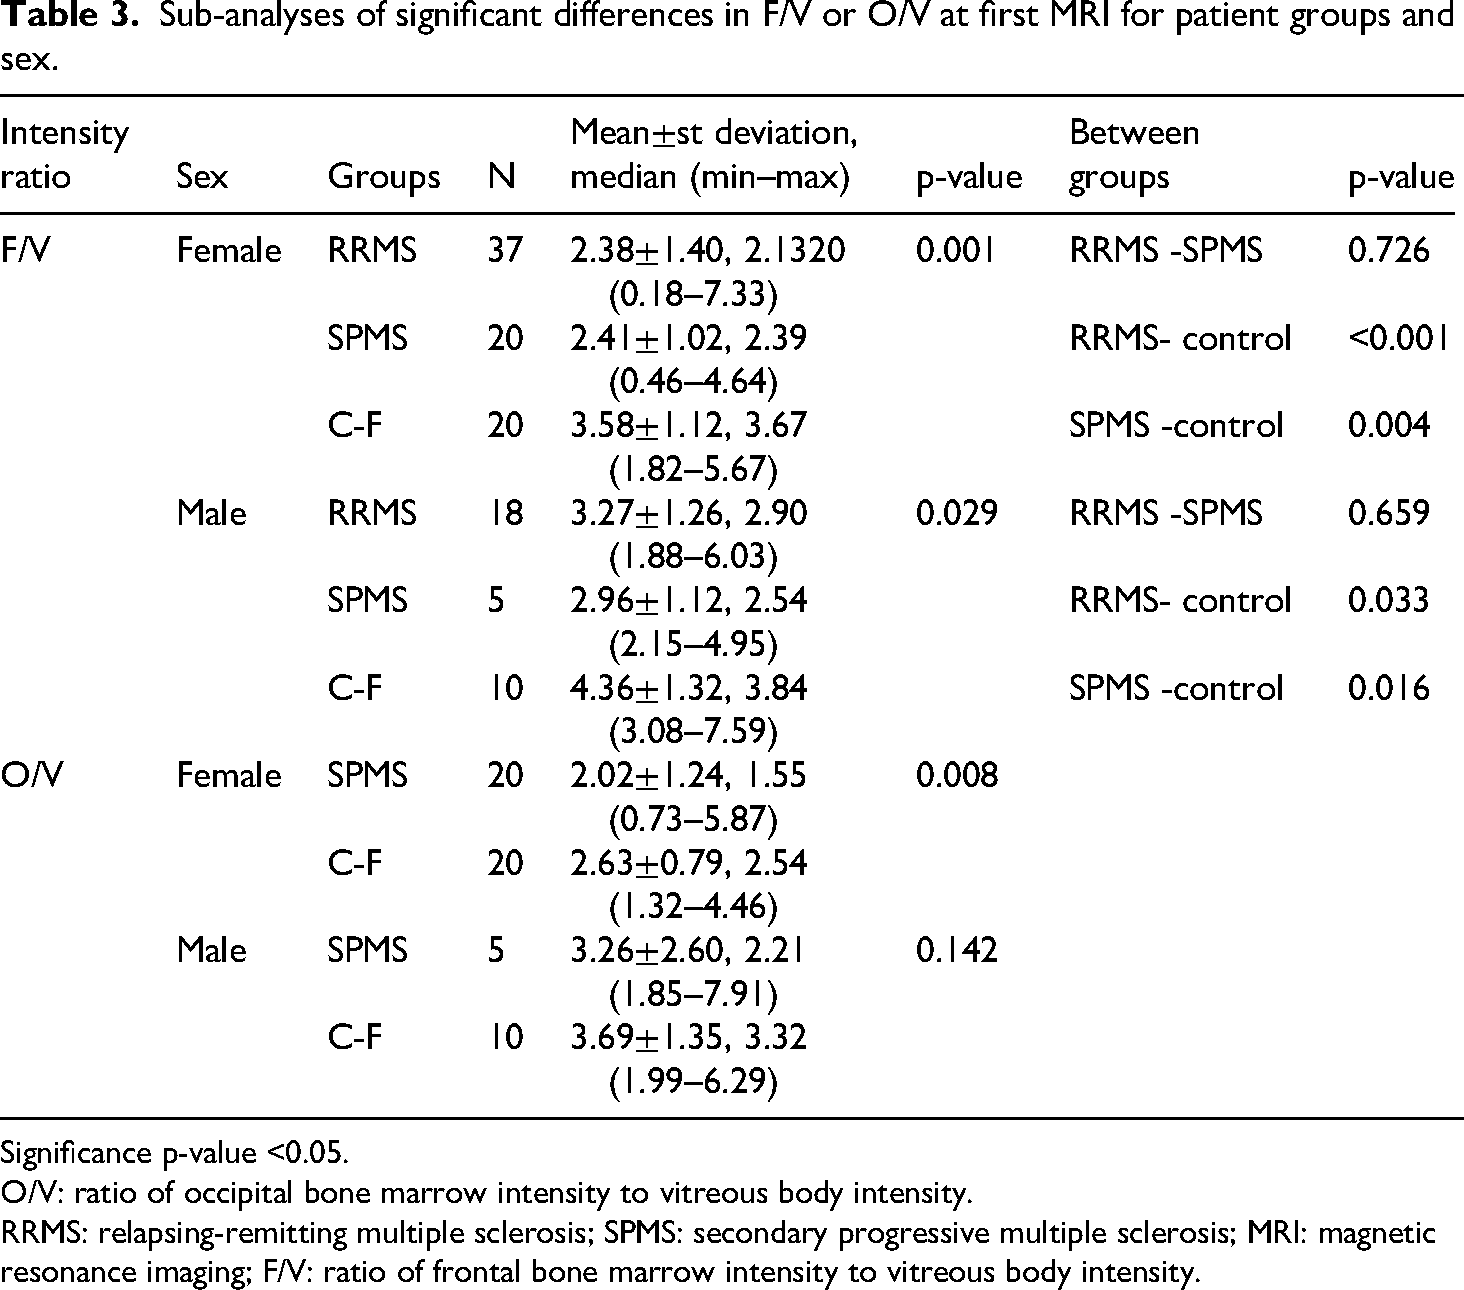
Significance p-value <0.05.
O/V: ratio of occipital bone marrow intensity to vitreous body intensity.
RRMS: relapsing-remitting multiple sclerosis; SPMS: secondary progressive multiple sclerosis; MRI: magnetic resonance imaging; F/V: ratio of frontal bone marrow intensity to vitreous body intensity.
There was no correlation between F/V or O/V on the first MRI scan and the clinical characteristics of patients with SPMS. There was no association between F/V or O/V and age at first diagnosis of RRMS, age at conversion to SPMS, or the duration of conversion from RRMS to SPMS. In the RRMS group, F/V and O/V changes were higher in males than in females. The O/V ratio was lower in patients who were relapse-free during follow-up, but there was no difference in ARR. There was a negative correlation with the baseline EDSS scores; however, the EDSS-free scores did not differ from the others (Tables 4 and 5).
Analysis of the correlation of intensity ratio differences with clinical features for RRMS and SPMS in the first MR.

Time from RRMS diagnosis to SPMS diagnosis.
Significance p-value <0.05.
In RRMS, F/V and O/V changes were negatively correlated with baseline EDSS scores and were higher in male than in female (bold entries).
RRMS: relapsing-remitting multiple sclerosis; SPMS: secondary progressive multiple sclerosis; MRI: magnetic resonance imaging; EDSS: expanded disability status scale; O/V: ratio of occipital bone marrow intensity to vitreous body intensity; F/V: ratio of frontal bone marrow intensity to vitreous body intensity.
Analysis of the relationship between F/V or O/V at first MR and relapse and EDSS progression in RRMS.

Significance p-value <0.05.
The O/V ratio was lower in patients who were relapse-free during follow-up (bold entries).
RRMS: relapsing-remitting multiple sclerosis; MRI: magnetic resonance imaging; EDSS: expanded disability status scale; ARR: annualized relapse rate; O/V: ratio of occipital bone marrow intensity to vitreous body intensity; F/V: ratio of frontal bone marrow intensity to vitreous body intensity.
Radiological marker potential of f/v and o/v
Lower F/V (≤ 3.03) detected on the first MRI of all patients with RRMS had diagnostic marker potential for diagnosing RRMS, regardless of whether it was converted to SPMS. In addition, lower F/V (≤ 2.87), together with lower O/V (≤ 2.49), demonstrated diagnostic marker potential for patients with RRMS who were converted to SPMS (Figure 4).

Diagnostic marker potential values of F/V and O/V found to be low on first MR.
Discussion
Several MS-specific diagnostic or prognostic radiological or immunological markers have been identified on MRI and in the serum or CSF, which have the potential to predict inflammation or neurodegeneration.12–16 These markers have clinical utility for diagnosing and monitoring disease activity. MS mainly affects young adults and its incidence is increasing; accordingly, personal and health resource costs increase. As such, diagnostic and prognostic markers have become increasingly important.18–20 Identifying patients with increased meningeal inflammation and EFL may help predict disease course, inform therapeutic strategies, and assess the response to DMTs.
In postmortem MS studies, the EFL was first detected in more than one-half of SPMS cases.21,22 EFLs are widely distributed throughout the forebrain. They are most commonly found in the deep sulci of the frontal, temporal, cingulate, and insular cortex. 6 ELFs are correlated with severe and diffuse meningeal inflammation, microglial activation, subpial cortical demyelination, and neurodegeneration. 7 The early transition to progressive processes is associated with more rapid disability, more prominent clinical symptoms, and neurological deficits in progressive MS.6,22–24 Most B-cell clones isolated from ELFs, which are essential components of the adaptive immune system in the pathogenesis of MS, have also been detected in the brain parenchyma in progressive MS and are closely associated with progression. 25 In the presence of EFL, gene and protein expression of tumor necrosis factor-α and interferon-γ increases, and the resulting meningeal inflammation and cytotoxic environment may directly lead to subpial demyelination and neurodegeneration. 26 As proof, anti-CD20 monoclonal antibody treatment was found to deplete B cells and reduce cellular composition in an experimental mouse model of autoimmune encephalomyelitis with meningeal ELFs; however, it did not alter follicle formation. 27 Furthermore, the relationship between EFL, progression, and neurodegeneration may be less evident in PPMS than those in SPMS.2,24,28
The current knowledge base regarding ELF formation must be improved. ELF may occur in the subarachnoid space and cause secondary cortical pathology with cytokine release and immunoglobulin production, or an existing cortical pathology may trigger ELF formation in the meninges by releasing chemotactic substances. 5 Although the dura and leptomeninges are composed of different vascular compartments, when CNS immune cell traffic is examined, specialized vascular channels are directly connected to the dura mater vasculature within the skull bone. 29 In experimental studies conducted in this context, it has been shown that monocytes, neutrophils, and B cells originating from the skull bone marrow migrate to the meninges as a continuously renewed flow through the vascular channels in the bone under the guidance of dura-derived chemokines.10,11 The skull bone marrow also provides an accessible source of B cells that are locally developed and specialized for CNS-derived antigens. 11 Therefore, immunological markers indicating neuronal and axonal damage, such as specific CSF protein profiles, oxidative damage, and neurofilament proteins, as well as radiological findings, such as gray matter lesions, leptomeningeal contrast enhancement foci, or EFL formation, may be indicative of the activation or progression of MS.30–32 In the early stages of MS, predicting which patients will develop a more active or progressive course is essential, whereas predicting the response(s) to DMT is difficult. The positive correlation between the presence of EFL and severe cortical demyelination and neurodegeneration, earlier onset of progression, and a more severe disease course in patients with SPMS is encouraging for understanding immune cell trafficking in the meninges.21,22,33 In this context, EFL has potential utility as a biomarker or therapeutic target for aggressive disease course or progression resulting from immune traffic between the peripheral and CNS compartments.
There is still a need for specific markers to distinguish SPMS from PPMS. In addition, most of the methods mentioned above, which have the potential to be markers for disease activation or progression, are nonroutine, challenging to access, require advanced technology, and/or are invasive. In this regard, evaluating radiological changes in the skull bone marrow, which is considered to be a specific source of EFL, raises the question of whether it can be a non-invasive, practical marker.
In our study, although we did not find a direct difference between PPMS/RRMS/SPMS in skull bone marrow intensity ratios, the F/V and O/V ratios were lower in RRMS and SPMS than in the control group, but similar in PPMS. This indicates that PPMS differs from the others. Moreover, debate persists regarding whether PPMS represents a different immunopathogenic process. These results may be an indirect consequence of PPMS with no or a weaker skull bone marrow association. In patients with RRMS compared with controls, a low F/V is significant for diagnosis, and a low O/V is substantial for predicting disease course with low inflammatory activation. However, both low F/V and O/V ratios have diagnostic marker potential for the risk for conversion to SPMS.
Study limitations
The present study had some limitations, the first of which was its retrospective design. Because the control group could not undergo a second MRI scan in the subsequent period, different control groups were selected for the first and last scans. Bone densities measured in the same patient were normalized to the vitreous to facilitate self-standardization of the results. Because techniques, such as proton density fat fraction or chemical shift imaging, are not routinely used to assess the bone marrow in patients with MS, measurements were performed on routinely obtained two-dimensional T1 images, providing a semiquantitative assessment. It should also be noted that a slice thickness of 5 mm may have affected the results due to partial volume artifacts. Prospective studies using these quantitative techniques will add to the existing literature base in this area.
Conclusion
Although the knowledge base for inflammation and EFL in the meningeal compartment in MS has increased significantly over the past 2 decades, it is important to determine the contribution of EFL to pathogenic mechanisms to develop therapeutic targets to slow or halt the progression of MS. The finding that immune cells in the cranial bone marrow continuously migrate to the meninges via intraosseous vascular channels and drain into the EFL suggests that the cranial bone marrow may be associated with progressive processes in MS. The ratio of frontal and occipital bone marrow intensity to vitreous body intensity (i.e. F/V and O/V) on routine MRI in patients with MS without any comorbid disease may be a clue for future low-severity disease course or conversion to SPMS.
Supplemental Material
sj-docx-1-sci-10.1177_00368504251336090 - Supplemental material for Relationship of cranial bone signal intensity to multiple sclerosis clinical course and progression
Supplemental material, sj-docx-1-sci-10.1177_00368504251336090 for Relationship of cranial bone signal intensity to multiple sclerosis clinical course and progression by Furkan Sarıdaş, Rıfat Özpar, Ülkünur Fikriye Özdemir, Yasemin Dinç, Emel Oğuz Akarsu, Emine Rabia Koç, Güven Özkaya, Bahattin Hakyemez and Ömer Faruk Turan in Science Progress
Supplemental Material
sj-docx-2-sci-10.1177_00368504251336090 - Supplemental material for Relationship of cranial bone signal intensity to multiple sclerosis clinical course and progression
Supplemental material, sj-docx-2-sci-10.1177_00368504251336090 for Relationship of cranial bone signal intensity to multiple sclerosis clinical course and progression by Furkan Sarıdaş, Rıfat Özpar, Ülkünur Fikriye Özdemir, Yasemin Dinç, Emel Oğuz Akarsu, Emine Rabia Koç, Güven Özkaya, Bahattin Hakyemez and Ömer Faruk Turan in Science Progress
Footnotes
ORCID iDs
Ethical considerations
This study was approved by the Bursa Uludag University Faculty of Medicine Clinical Research Ethics Committee (Approval no: 2023-18/3)
Consent to participate
The need for informed consent was waived by The Clinical Research Ethics Committee of the Bursa Uludag University, Faculty of Medicine.
Author contributions/CRediT
FS contributed to writing—original draft, visualization, resources, project administration, methodology, investigation, and conceptualization. RÖ contributed to validation, conceptualization, data curation, formal analysis, and writing—review and editing. ÜFÖ did validation and data curation. YD did investigation and writing—review and editing. EOA did investigation and writing—review and editing. ERK did investigation and writing—review and editing; GÖ did formal analysis, methodology, and supervision. BH did resources, data curation, and supervision. ÖFT did supervision and resources.
Funding
The author(s) received no financial support for the research, authorship, and/or publication of this article.
Conflicting interests
The author(s) declared no potential conflicts of interest with respect to the research, authorship, and/or publication of this article.
Data availability
The data sets analyzed during the present study are available from the corresponding author (furkansaridas@uludag.edu.tr.) upon reasonable request.
Supplemental material
Supplemental material for this article is available online.
Appendix 1: Example drawing and sample measurement of a 2 mm diameter circumferential region of interest in the frontal bone,the occipital bone and the vitreous body.
Appendix 2: Intensity measurement values at first and last MRI according to sex and study groups.
Bone Marrow intensity on MRIs
Sex
MS type
Control
Total
Female
Male
PPMS
Remain with RRMS, n=55
Subsequent conversion
to SPMS, n=25
First
C
1336.56±521.08, 1222(569–2806)
999.93± 531.96, 930 (297–4342)
978.06±437.7, 855.5(322–1694)
1178.07±514.84, 1152(339–2806)
1080.52±418.82, 1014(297–2172)
1033.03±731.68, 920(403–4342)
1098.78± 548.74, 1009(297–4342)
F
680.37±370.17, 641(12–2348)
981.08±459.68, 926 (493–2931)
717.87±453.1, 624(12–1672)
791.54±453.3, 722(28–2931)
699.68±258.4,
663(208–1121)
811.33±455.12, 722(248–2348)
768.67±419.79, 701.5(12–2931)
O
543.95±265.01, 501(106–1484)
904.70±487.46, 826(318–3178)
530.5±360.91, 447(159–1342)
732.93±465.56, 632(153–3178)
605.76±252.22, 565(106–1192)
598.1±276.37, 581.5(209–1484)
649.89±380.9, 591.5(106–3178)
V
276.41±119.02, 282(103–633)
296.05±133.68, 269(116–598)
243.06±119.93, 213.5(110–439)
314.07±115.64, 307 (116–633)
314.96±123.78, 320(105–492)
217.27±111.54, 159.5(103–586)
282.18±123.29, 281(103–633)
C/V
4.07±1.84, 3.71 (0.76–8.86)
4.95±1.67, 4.75(2.78–8.82)
4.6±1.96, 4.49(0.81–8.36)
4.11±1.75, 3.83(0.76–8.38)
4.09±2.28, 3.5(1.01–8.86)
4.8±1.44, 4.38(2.62–8.07)
4.33±1.84, 4.15(0.76–8.86)
F/V
2.72±1.33, 2.62(0.03–7.33)
3.64±1.34, 3.41(1.88–7.59)
3.24±1.44, 3.19(0.03–5.91)
2.67±1.41, 2.41(0.18–7.33)
2.52±1.05, 2.49(0.46–4.95)
3.84±1.23, 3.83(1.82–7.59)
2.99±1.39, 2.76(0.03–7.59)
O/V
2.21±1.1, 2.03(0.38–5.87)
3.39±1.56, 2.69(0.84–7.91)
2.42±1.35, 2.2(0.64–4.87)
2.5±1.35, 2.2(0.64–4.87)
2.5±1.35,
2.3(0.38–7.12)
2.27±1.62, 1.61(0.73–7.91)
2.56±1.36, 2.29(0.38–7.91)
Last
C
1014.92±390.19, 943(298–2066)
1143.51±375.83, 1035(542–1982)
977.62±417.85, 817(506–1982)
1059.85±407.12, 993(298–2066)
1049.76±343.98,1011(434–1627)
1072.43±389.88, 980.5(554–1952)
1050.64±389.08, 980.5(298–2066)
F
705.77±337.8, 667(8–1517)
864.63±370.08, 772(267–2060)
647.43±353.81, 665.5(8–1168)
785.64±375.3, 703(49–2060)
790.56±369.72, 765(138–1749)
705.13±291.27, 659(133–1438)
749.9±352.87, 691(8–2060)
O
534.66±247.1, 482(120–1349)
811.31±248.05, 804(354–1411)
502.75±230.25, 474(241–877)
640.85±304.03, 542(120–1411)
587.76±231.33, 595(163–961)
635.5±274.3, 607.5(137–1296)
611.51±276, 557.5(120–1411)
V
263.71±116.49, 267(95–509)
259.8±140.21, 248(120–733)
252.56±128.14, 243(104–465)
272.04±125.7, 302(108–733)
277.08±129.71, 258(112–515)
238.17±111.03, 249.5(95–495)
262.63±123, 263.5(95–733)
C/V
4.29±1.59, 4(1.47–8.31)
5.06±1.63, (5.26(1.64–8.4)
4.5±1.95, 4.71(1.47–7.94)
4.36±1.63, 4.34(1.67–8.4)
4.27±1.54, 4.14(1.64–7.37)
4.94±1.51, 4.8(2.39–8.31)
4.5±1.63, 4.38(1.47–8.4)
F/V
2.94±1.33, 2.87(0.02–6.72)
3.7±1.25, 3.57(1.68–6.42)
3.14±1.76, 3.02(0.02–6.49)
3.11±1.25, 3(0.4–6.1)
3.17±1.41, 3.17(0.42–6.61)
3.22±1.27, 2.99(1.15–6.72)
3.15±1.35, 3.05(0.02–6.72)
O/V
2.28±1.06, 2.17(0.53–5.05)
3.69±1.46, 3.73(1.36–6.48)
2.55±1.70, 2.28(0.53–6.48)
2.64±1.24, 2.48(0.62–5.82)
2.52±1.39, 2.26(0.66–6.3)
2.93±1.28, 2.42(0.99–5.99)
2.67±1.34, 2.33(0.53–6.48)
Appendix 3: Correlation analysis between age at MRI or time between two MRIs and intensity ratios or proportional changes of skull bone marrow.
RRMS: relapsing-remitting multiple sclerosis; SPMS: secondary progressive multiple sclerosis; PPMS: primary progressive multiple sclerosis; MRI: magnetic resonance imaging.
PPMS
RRMS
SPMS
Control groups (C-F or C-L)
p-value
Bone marrow intensity / Age
of MRI
First
Last
Change
First
Last
Change
First
Last
Change
First
Last
First
Last
Clivus (C)
−
r:0.010
−
r:-0.114
r:0.191
−
r:0.106
r:-0.084
0.175
0.718
p:0.942
p:0.586
p:0.360
p:0.578
p:0.659
Frontal (F)
r:0.207
r:0.199
−
r:0.021
r:0.192
−
r:0.087
r:0.096
−
r:-0.005
r:-0.068
0.704
0.608
p:0.442
p:0.461
p:0.880
p:0.160
p:0.678
p:0.648
p:0.978
p:0.720
Occipital (O)
r:0.119
r:0.192
−
r:-0.172
r:0.147
−
r:-0.160
r:0.274
−
r:0.094
r:0.007
0.112
0.329
p:0.662
p:0.477
p:0.210
p:0.285
p:0.445
p:0.185
p:0.623
p:0.971
Vitreous body (V)
r:0.077
r:-0.167
−
r:-0.161
r:0.162
−
r:-0.142
r:0.007
−
r:0.039
0.474
p:0.775
p:0.538
p:0.241
p:0.237
p:0.499
p:0.974
p:0.838
References
Supplementary Material
Please find the following supplemental material available below.
For Open Access articles published under a Creative Commons License, all supplemental material carries the same license as the article it is associated with.
For non-Open Access articles published, all supplemental material carries a non-exclusive license, and permission requests for re-use of supplemental material or any part of supplemental material shall be sent directly to the copyright owner as specified in the copyright notice associated with the article.