
Abstract
To solve the problem of difficult quantitative identification of surface defect depth during laser ultrasonic inspection, a support vector machine-based method for quantitative identification of surface rectangular defect depth is proposed. Based on the thermal-elastic mechanism, the finite element model for laser ultrasound inspection of aluminum materials containing surface defects was developed by using the finite element software COMSOL. The interaction process between laser ultrasound and rectangular defects was simulated, and the reflected wave signals corresponding to defects of different depths under pulsed laser irradiation were obtained. Laser ultrasonic detection experiments were conducted for surface defects of different depths, and multiple sets of ultrasonic signal waveform were collected, and several feature vectors such as time-domain peak, center frequency peak, waveform factor and peak factor were extracted by using MATLAB, the quantitative defect depth identification model based on support vector machine was established. The experimental results show that the laser ultrasonic surface defect identification model based on support vector machine can achieve high accuracy prediction of defect depth, the regression coefficient of determination is kept above 0.95, and the average relative error between the true value and the predicted value is kept below 10%, and the prediction accuracy is better than that of the reflection echo method and BP neural network model.
Introduction
Metal materials are widely used in aerospace, transportation, machinery manufacturing and other fields, in the production process and service process, due to a variety of factors that inevitably cause metal materials exist delamination, surface cracks and other defects. If these defects are not detected in time, their expansion will lead to the failure of parts and structures, posing a safety hazard to production safety and personal safety. 1 So for the metal material defect detection, ensuring the safety and reliability of the product has important practical significance. Compared to traditional defect detection techniques, laser ultrasound, a non-contact ultrasonic excitation technique, allows for rapid and real-time detection. In addition, laser ultrasonic inspection technology produces ultrasonic waves with good directionality and strong penetration, which is widely promoted in the process of non-destructive testing of materials, such as laser ultrasonic inspection of composite materials, laser ultrasonic scanning imaging and other directions,2–4 In the harsh environment of corrosion, high temperature and pressure, laser ultrasound technology can be used to measure the thickness of the work-piece, monitor the microstructure of the material forming process, and detect small internal and surface defects of work-pieces with complex surfaces.5–7
In recent years, the development of machine learning has provided new possibilities for the detection and characterization of material surface defects. Numerous scholars have combined laser ultrasonic inspection techniques with machine learning to conduct extensive research on the detection and identification of material surface defects. Fei C combines chaotic genetic algorithms with support vector machines for the classification of oil pipeline surface defects to achieve fast and accurate identification of defect types. 8 Gou 9 extracted a database of features such as geometric features and shape features of various types of defects of cartridge cases and proposed a classification method of cartridge case defects based on BP neural network, and the misclassification rate of classification was kept within 17%.In a study on the detection of material surface defects using an electromagnetic transducer, Huibing 10 expanded the number of samples by linear interpolation and completed the quantitative detection of defects and the detection of non-metallic coating thickness based on neural networks, all within a small error range. Liu Song et al. 11 used MATLAB to design and train the neural network, and used the ultrasonic echo signal as the input of the neural network to identify and detect three defects of the triangle, bump and triangle in the bottom plate, and the recognition rate was 93.33%. Du Peijun et al. 12 applied support vector machines to the classification of remote sensing images and obtained suboptimal classification results. Kesharaju et al. 13 developed an online quality inspection system based on feed-forward neural network and ultrasonic sensing technology to detect, locate and classify various crack defects from the received ultrasonic signals. Deng et al. 14 used the kernel-based principal component analysis (KPCA) algorithm and the extreme learning machine (ELM) approach, to extract the defect parameters in the eddy current signal and to identify and classify them automatically. Haoran Li et al. 15 used ANSYS software to perform infrared phase-locked analysis of metal plates containing cavity defects, using particle swarm optimized BP neural network and predicted the area and depth of the defects with the average error staying below 5%. He et al. 16 compared the reflection and transmission coefficients of the surface waves of the steel plates with the reference curves obtained from the 2D finite element method simulations, to estimate the surface crack depth from 0. 2 to 3. 0 mm with a relative error of 5% to 17%. Guan et al. 17 extracted multiple features of ultrasonic frequency domain signals, and combined with support vector machines to accomplish quantitative ultrasonic detection of near-surface defects in large ring-shaped forgings. However, there are few research results combining laser ultrasound technology with support vector machines (SVM), and they mainly focus on the classification of cracks or defects, while there is a lack of research in the quantitative analysis of defects.
This paper addresses the problem of laser ultrasonic detection of metal surface defect depth, proposes a method that combines laser ultrasonic detection technology with support vector machines to achieve the identification of surface defect depth. A two-dimensional model of laser-ultrasonic thermal-structural coupling was developed by using Comsol Multiphysics software, investigate the interaction of laser-excited ultrasound with surface defects at different depths in aluminum materials. The experimental waveform signal is obtained by laser ultrasonic inspection equipment for the detection of defects of different depths, the relationship between the defect depth and the ultrasonic signal is analyzed, multiple feature vectors are extracted to form the data set of the support vector machine algorithm, and the quantitative recognition model of defect depth based on the support vector machine is established. Based on the same data environment, the method is compared with the reflection echo method and BP neural network model to demonstrate the excellent performance of this support vector machine model.
Theory and model
Laser ultrasound based on thermal-elastic mechanism
The melting and etching mechanism will cause damage to the surface of the material, need to excite the ultrasonic wave in the hot elastic mechanism to complete the detection of defects. When the laser light source acts on the surface of the model, due to the characteristics of the axis symmetrical distribution of the incident laser, and the material is isotropic, uniform linear elasticity, the three-dimensional problem can be reduced to a planar two-dimensional problem, simplified pulsed laser action on the material containing surface defects schematic diagram is shown in Figure 1.
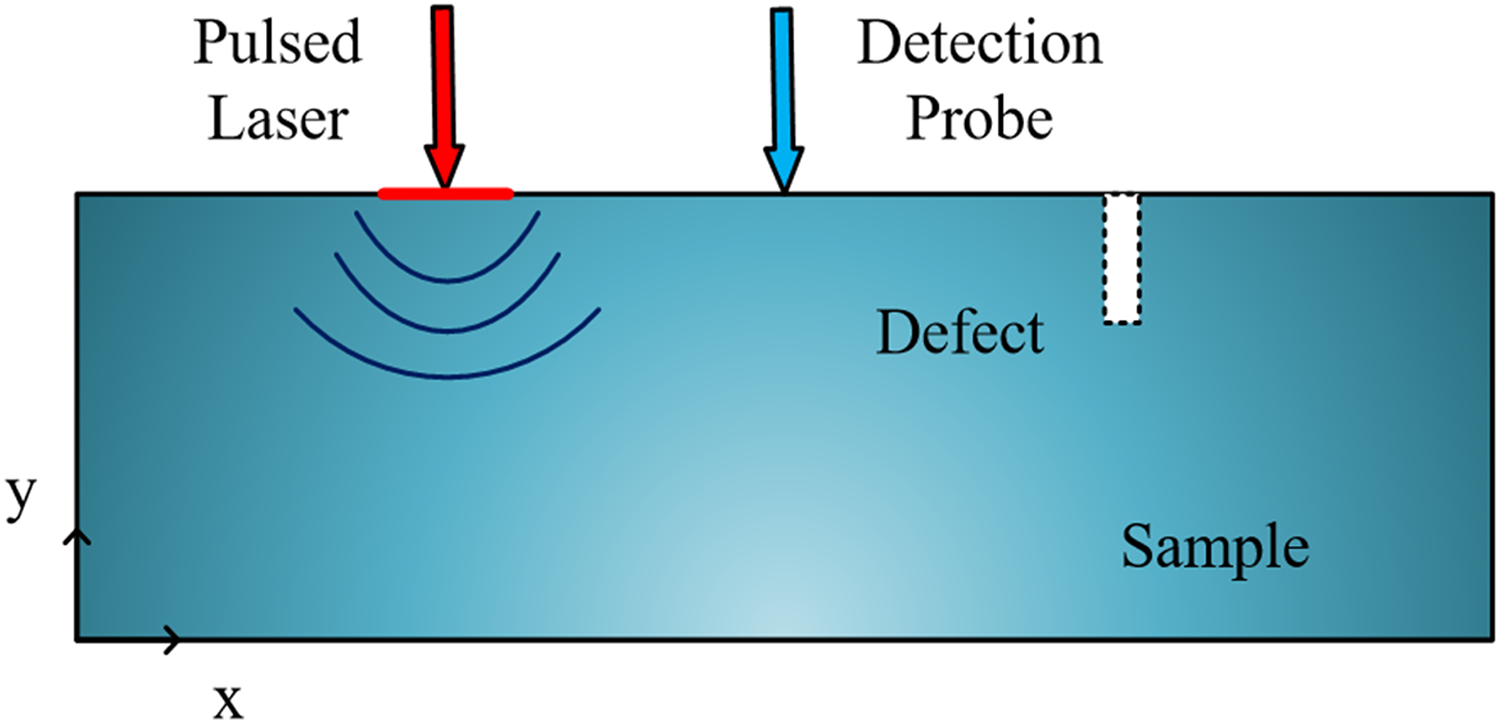
Schematic diagram of laser ultrasonic detection of surface defects.
When the pulsed laser acts on the surface of the material to be measured, the thermal effect generated by the irradiation of the laser can be regarded as a boundary condition of the model, when the laser radiation area absorbs energy, the temperature increases, and there is a large temperature gradient field, which eventually leads to the thermal expansion of the material and the generation of ultrasonic waves.
If the height of the sample material is h and the radial length is R, the boundary condition of the laser action region on the upper surface is


where
Finite element method and model
In this paper, based on COMSOL finite element software, two physical fields, solid mechanics and solid heat transfer, are used for modeling and solving. The essence of the mutual coupling of the structural and temperature fields is to link the structural and temperature field equations using the thermal strain term as a bridge. The controlling equation for the coupling of the thermal-structural physical fields of an isotropic material is18–20


where: the transient temperature distribution is

where: the heat conduction matrix

where: the mass matrix is

where:
Support vector machine algorithm
Support vector machine (SVM) is a machine learning method firstly proposed by Vapnik, which can be divided into Support Vector Classification (SVC) and Support Vector Regression (SVR) for classification and regression problems, respectively. Support vector machines use the structural risk minimization principle (SRM) to map the low-dimensional space and linearly indistinguishable information to the high-dimensional space by nonlinear mapping to make it linearly distinguishable, and then further classify and regress. The SVR algorithm is particularly good at small sample size training with good generalization ability, the computational complexity does not depend on the dimensions of the space, and it can effectively avoid the local extreme problem and prevent over-fitting in the regression processing to maximize the prediction accuracy.
The kernel function selection and related parameter settings are the keys to the support vector regression machine. In this paper, the SVR model is chosen and the most widely used radial basis kernel function is selected because it is suitable for processing different samples and various dimensional problems and has strong nonlinear mapping capability. The penalty factor C and the kernel parameter g in the SVR model are used in a grid search algorithm to find their optimal values.
The idea of the regression problem is to determine a function that can predict future values, and the general SVR estimation function can be expressed in the following form
21

where w is the weight, b is the function threshold,

where

The generic equation (1) can be rewritten as

In equation (12), the dot product can be replaced by the function

where
Numerical simulation and experiments
Model and simulation results
The time and space resolutions of the finite element model are important influencing factors for the convergence of the numerical simulation process, and the appropriate integration time step determines the accuracy of the numerical calculation results to a certain extent. In general, as the set time step decreases, the computational accuracy of the model increases. If the step size is large, the resolution results of the high-frequency components are not accurate enough. On the other hand, a time step that is too small will take a long time to compute. After previous investigations, when the rise time of the pulsed laser is in the nanosecond range, the time step is determined as
22

Where
The meshing in the model is also an important aspect that affects the accuracy of the calculation. To ensure the propagation of energy between two consecutive nodes in the grid, the cell size needs to be fine enough for the resolution of ultrasound to be accurately obtained. The grid cell size can be expressed as
23

Where:
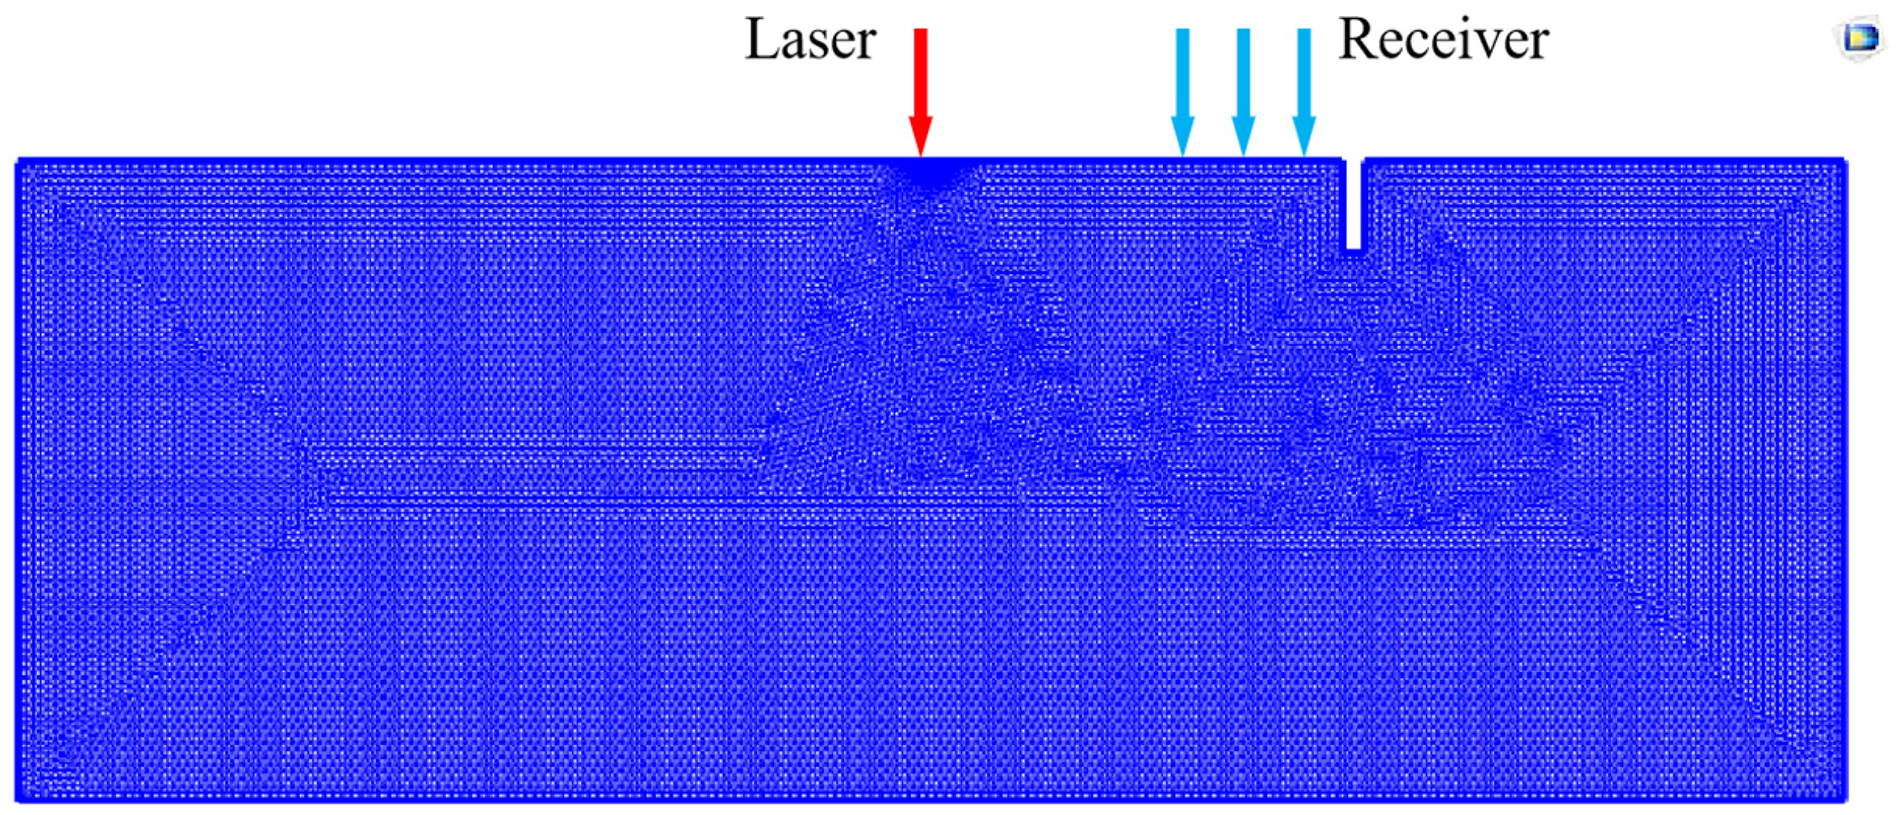
Meshing of the finite element simulation model.
In summary, when the model is built, the total time step is divided into two parts using the range function to save the calculation time, and the time step is set to 10 ns in the time period from 0 to 2.5 us, and the step is set to 100 ns in the other time periods. For the mesh division, as shown in the figure, the mesh is refined near the laser irradiation effect with a size of 0.1 mm, and the other regions are divided by a normal triangular mesh.
The geometric model established in the paper is an aluminum material plate of size 16mm*7 mm, and its various thermodynamic parameters are shown in Table 1. The laser source is irradiated at the center of the material surface, and the left edge of the defect is 4.5 mm away from the laser source point. A probe is added between the laser source point and the defect for obtaining a displacement waveform map of the ultrasonic signal.
Thermodynamic parameters of aluminum materials in the model.
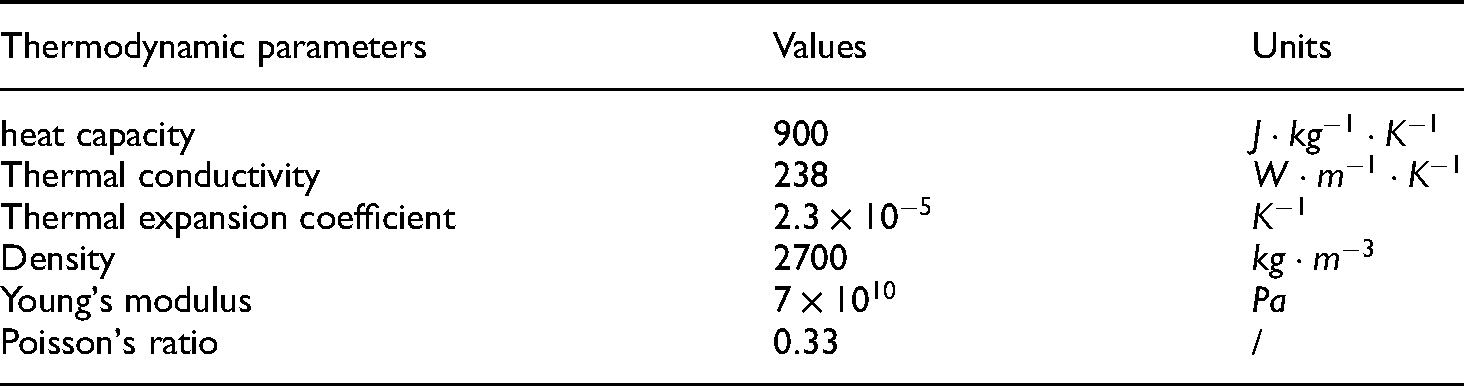
Figure 3 shows the ultrasonic field distribution of laser-excited ultrasonic waves in aluminum materials containing surface defects at different moments. From the figure, it can be observed that the laser can generate the longitudinal wave L, transverse wave S and surface wave R simultaneously in the aluminum material under the thermal-elastic mechanism. Among them, the longitudinal wave propagates the fastest and the surface wave the slowest As shown in Figure 3(b) to (d), when the surface wave meets the surface defect, part of the surface wave interacts with the defect and transforms into a reflected return wave RW, and part bypasses the defect to form a transmitted wave TW.
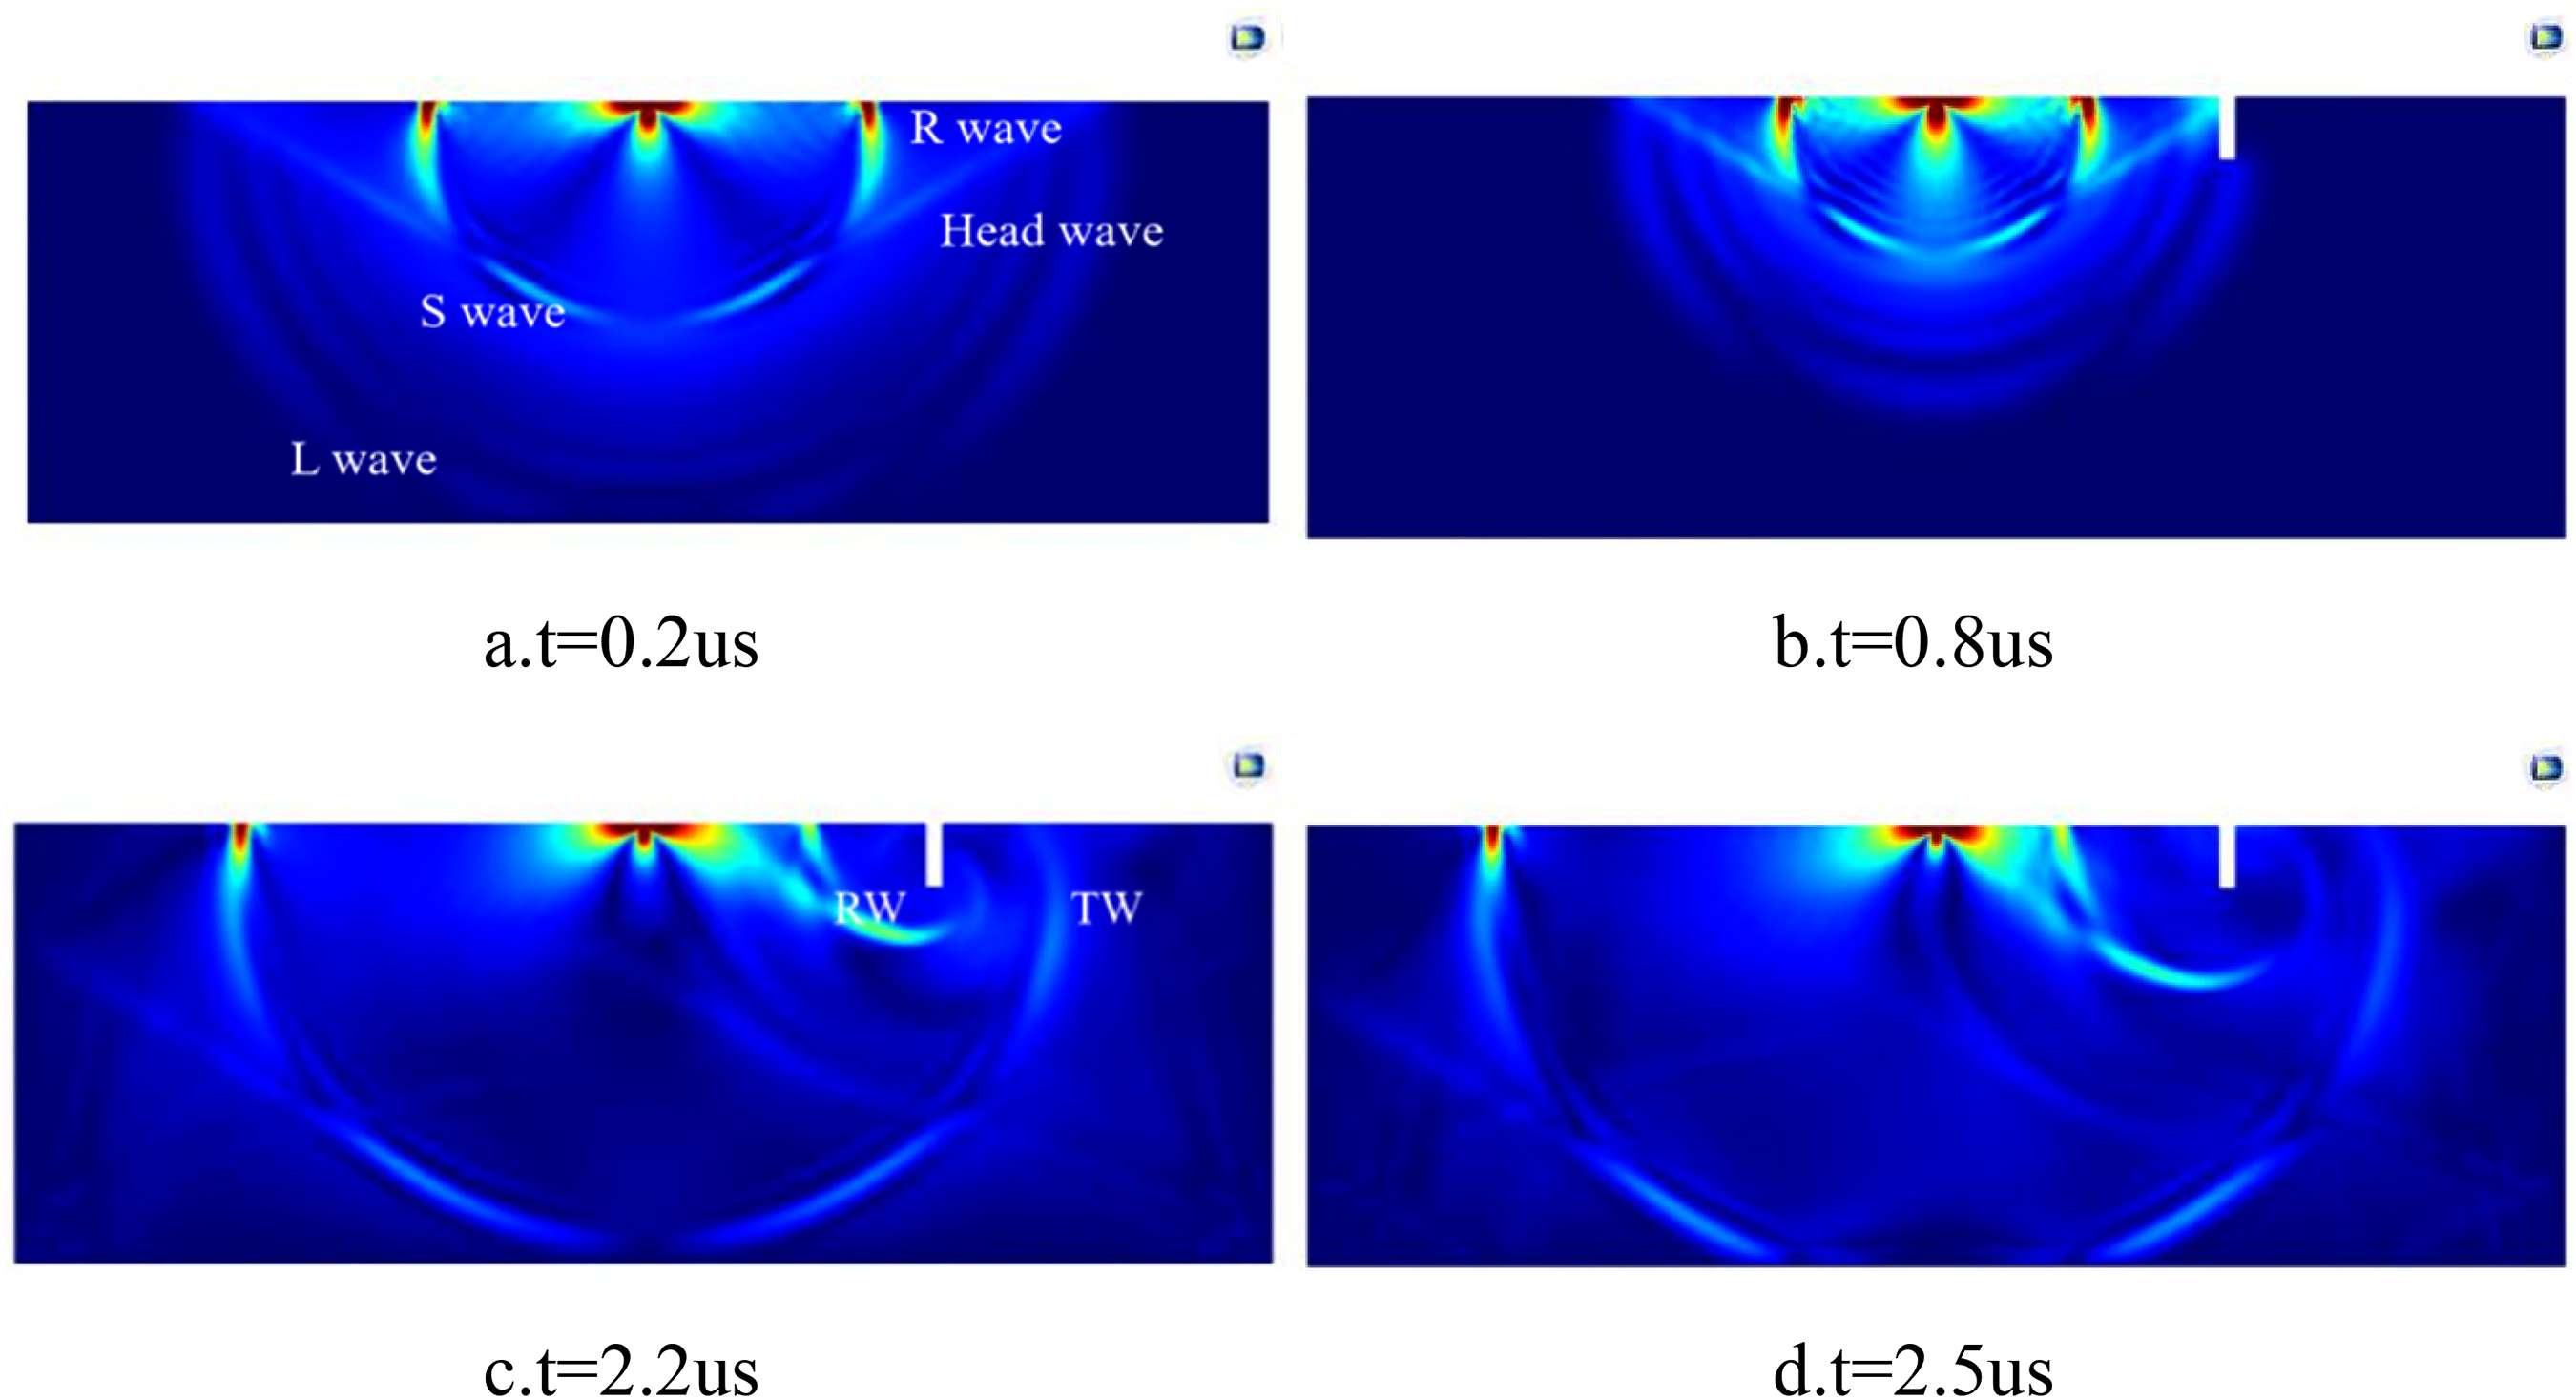
Ultrasonic field distribution of laser-excited ultrasonic waves in aluminum materials with surface defects at different moments.
The ultrasonic signal variation curves with time corresponding to different defect depths when the pulsed laser is irradiated on the surface of the aluminum material model are given in Figure 4. The laser spot radius is 100um, the rise time is 10 ns, the signal detection point is located 2 mm to the right of the excitation point, and the defect depth is 0.5 mm, 0.7 mm and 1.0 mm respectively. As can be seen from the figure, the laser is able to excite both longitudinal and surface waves, and after the ultrasonic signal interacts with the defect, additional reflected echo signal RW is generated, and the defect depth grows from 0.5 mm to 1.0 mm, and the peak signal of the reflected echo gradually increases, as shown in the local magnification in Figure 4.

Time-domain signal of reflected wave with different depth defects.
The finite element numerical simulation results express the interaction of the laser-excited ultrasonic waves with the material surface defects. Due to the presence of surface rectangular defects, the probe is able to detect additional ultrasonic echo signals and the magnitude of the signal increases with the depth of the defect. Therefore, information on the depth of the material surface defects can be characterized by measuring the change in displacement amplitude of the laser ultrasound signal.
Experiments and results
The focus size of the point laser source is small and the resolution is high. Therefore, the point laser source is used as the excitation source in this paper. The laser ultrasound experimental setup is shown in Figure 5(a). The experiment uses a nanosecond Nd:YAG pulsed laser as the excitation source with a laser pulse rise time of 10 ns and a wavelength of 1064 nm. The two-dimensional moving platform is used to realize the movement of the sample to be measured in different directions, to achieve different positions of scanning and detection. The scanning oscillator adjusts the range of the laser sweep area to complete the detection of the specified area. The ultrasound probe is used to acquire the generated ultrasound signals with a sampling length of 1024 for each set of data. The detection signal is acquired by an A/D high-speed data acquisition card. After the ultrasound signal acquisition is completed, the signal processing is finally performed and the acquired signal is imported into the computer. The experimental sample is a pure aluminum block with minor defects on the surface of the aluminum block processed by the wire-cutting process. Figure 5(b) shows the pure aluminum specimen samples containing different depth defects.
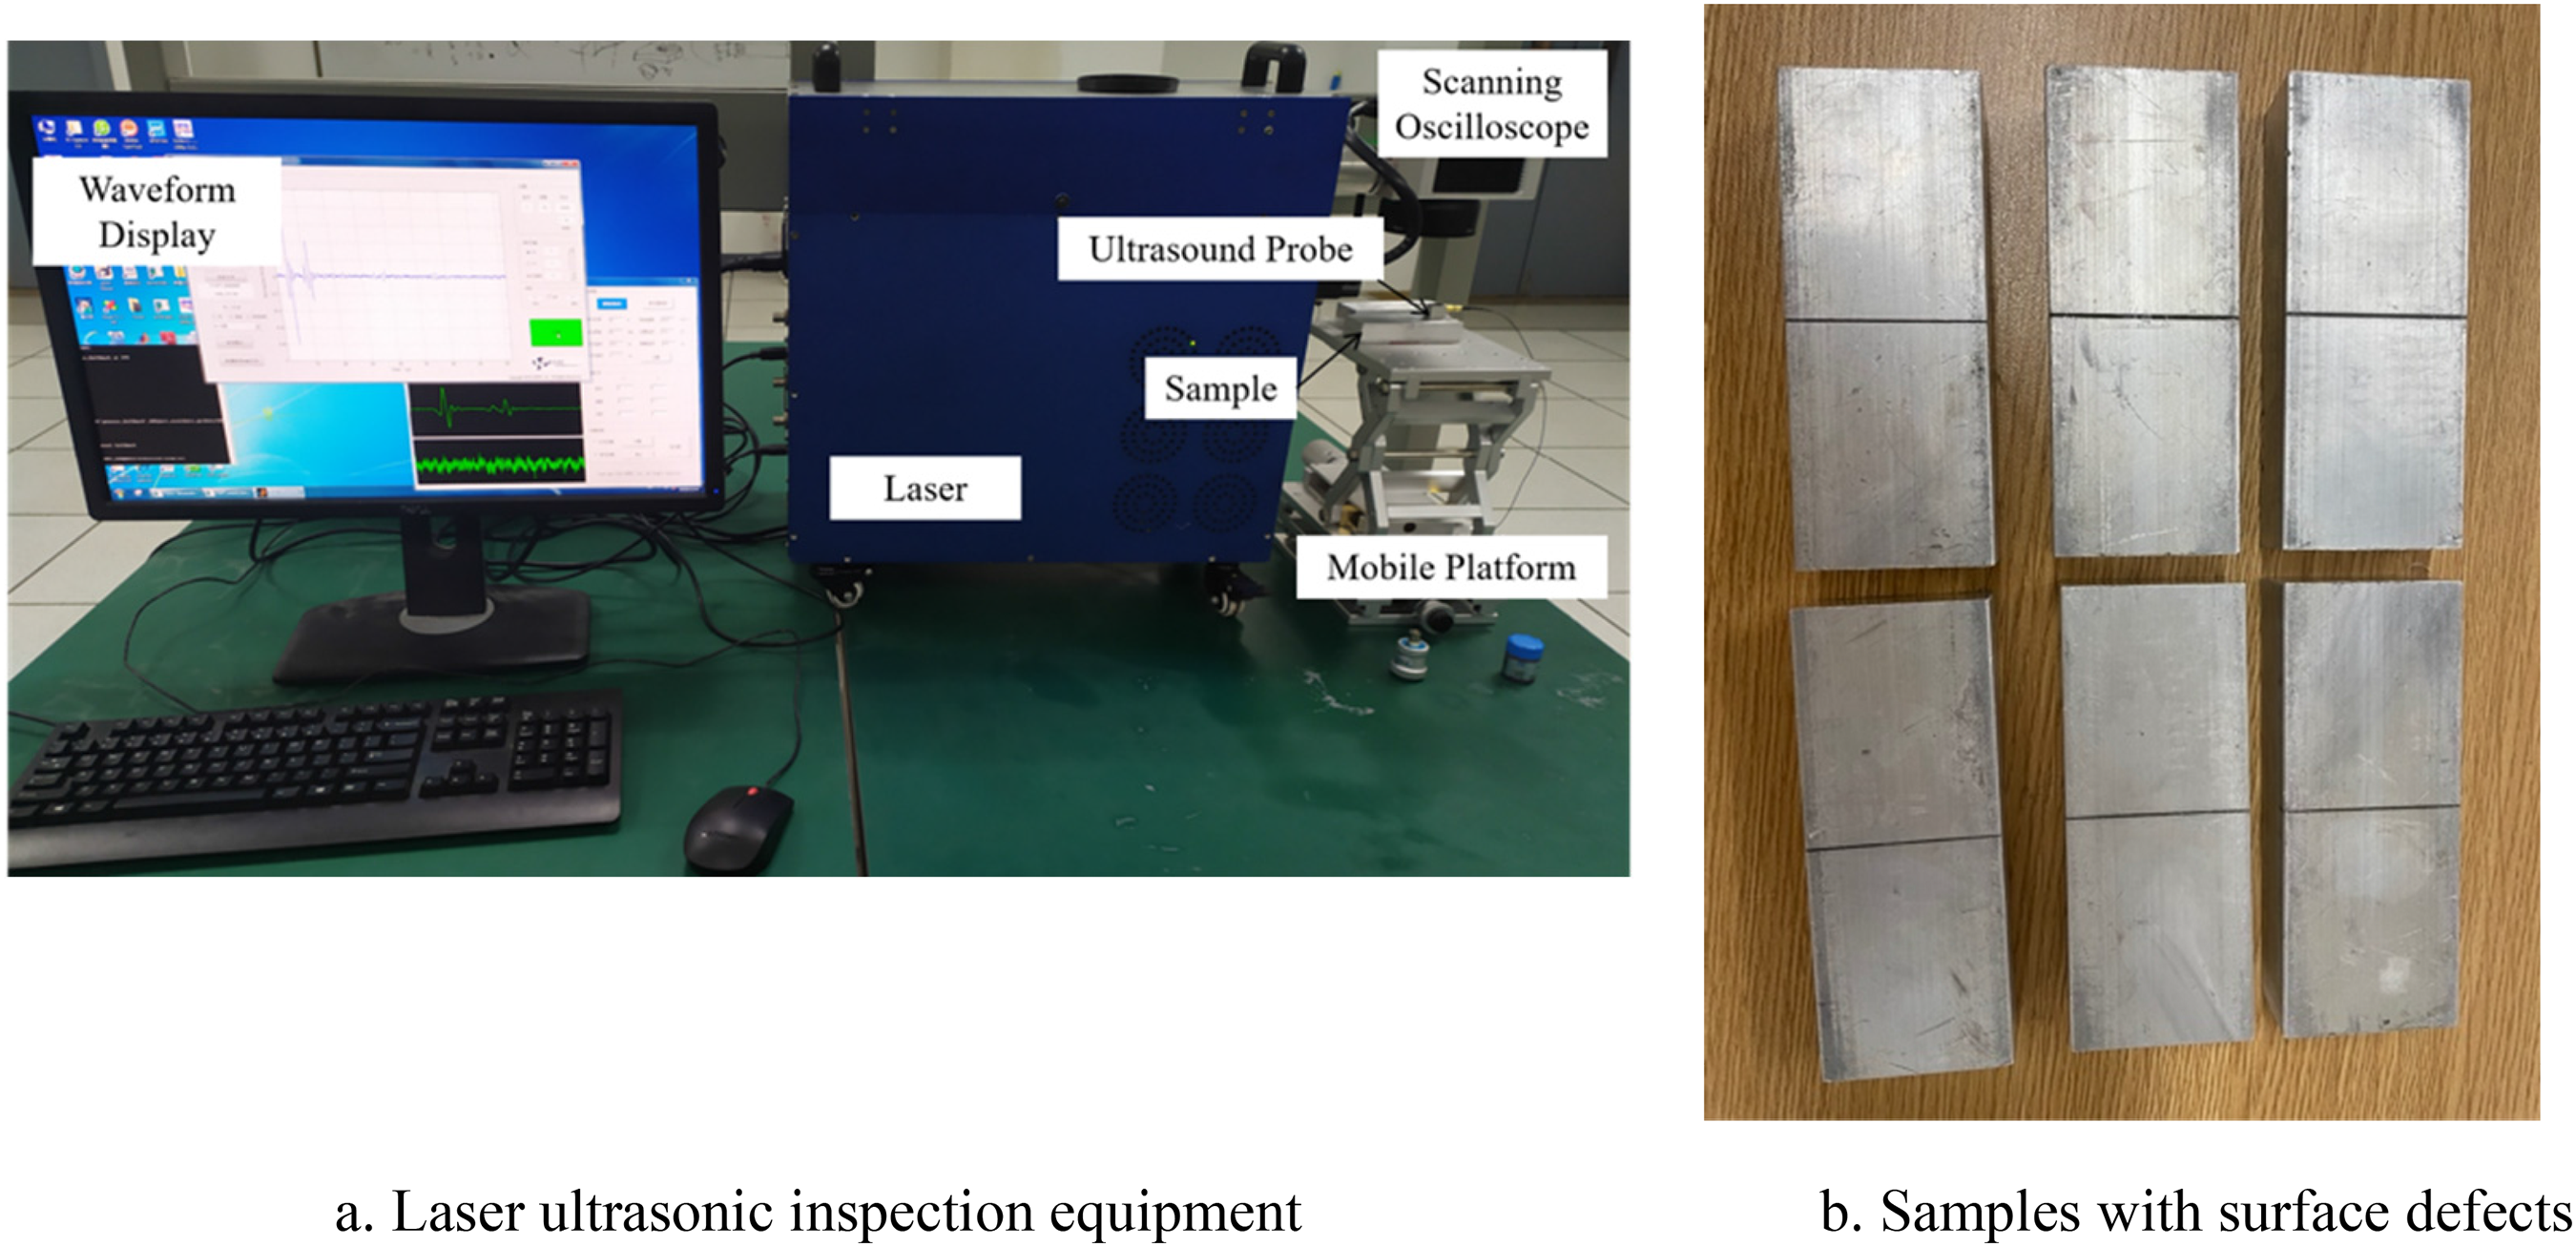
Schematic diagram of laser ultrasound experiment.
Since the signals collected in the experiment contain some noise signals, this paper uses a low-pass filter to denoise the experimental signals. It can be seen from Figure 6 that low-pass filtering can filter out a part of the noise signal, and the useful ultrasound signal is more obvious.
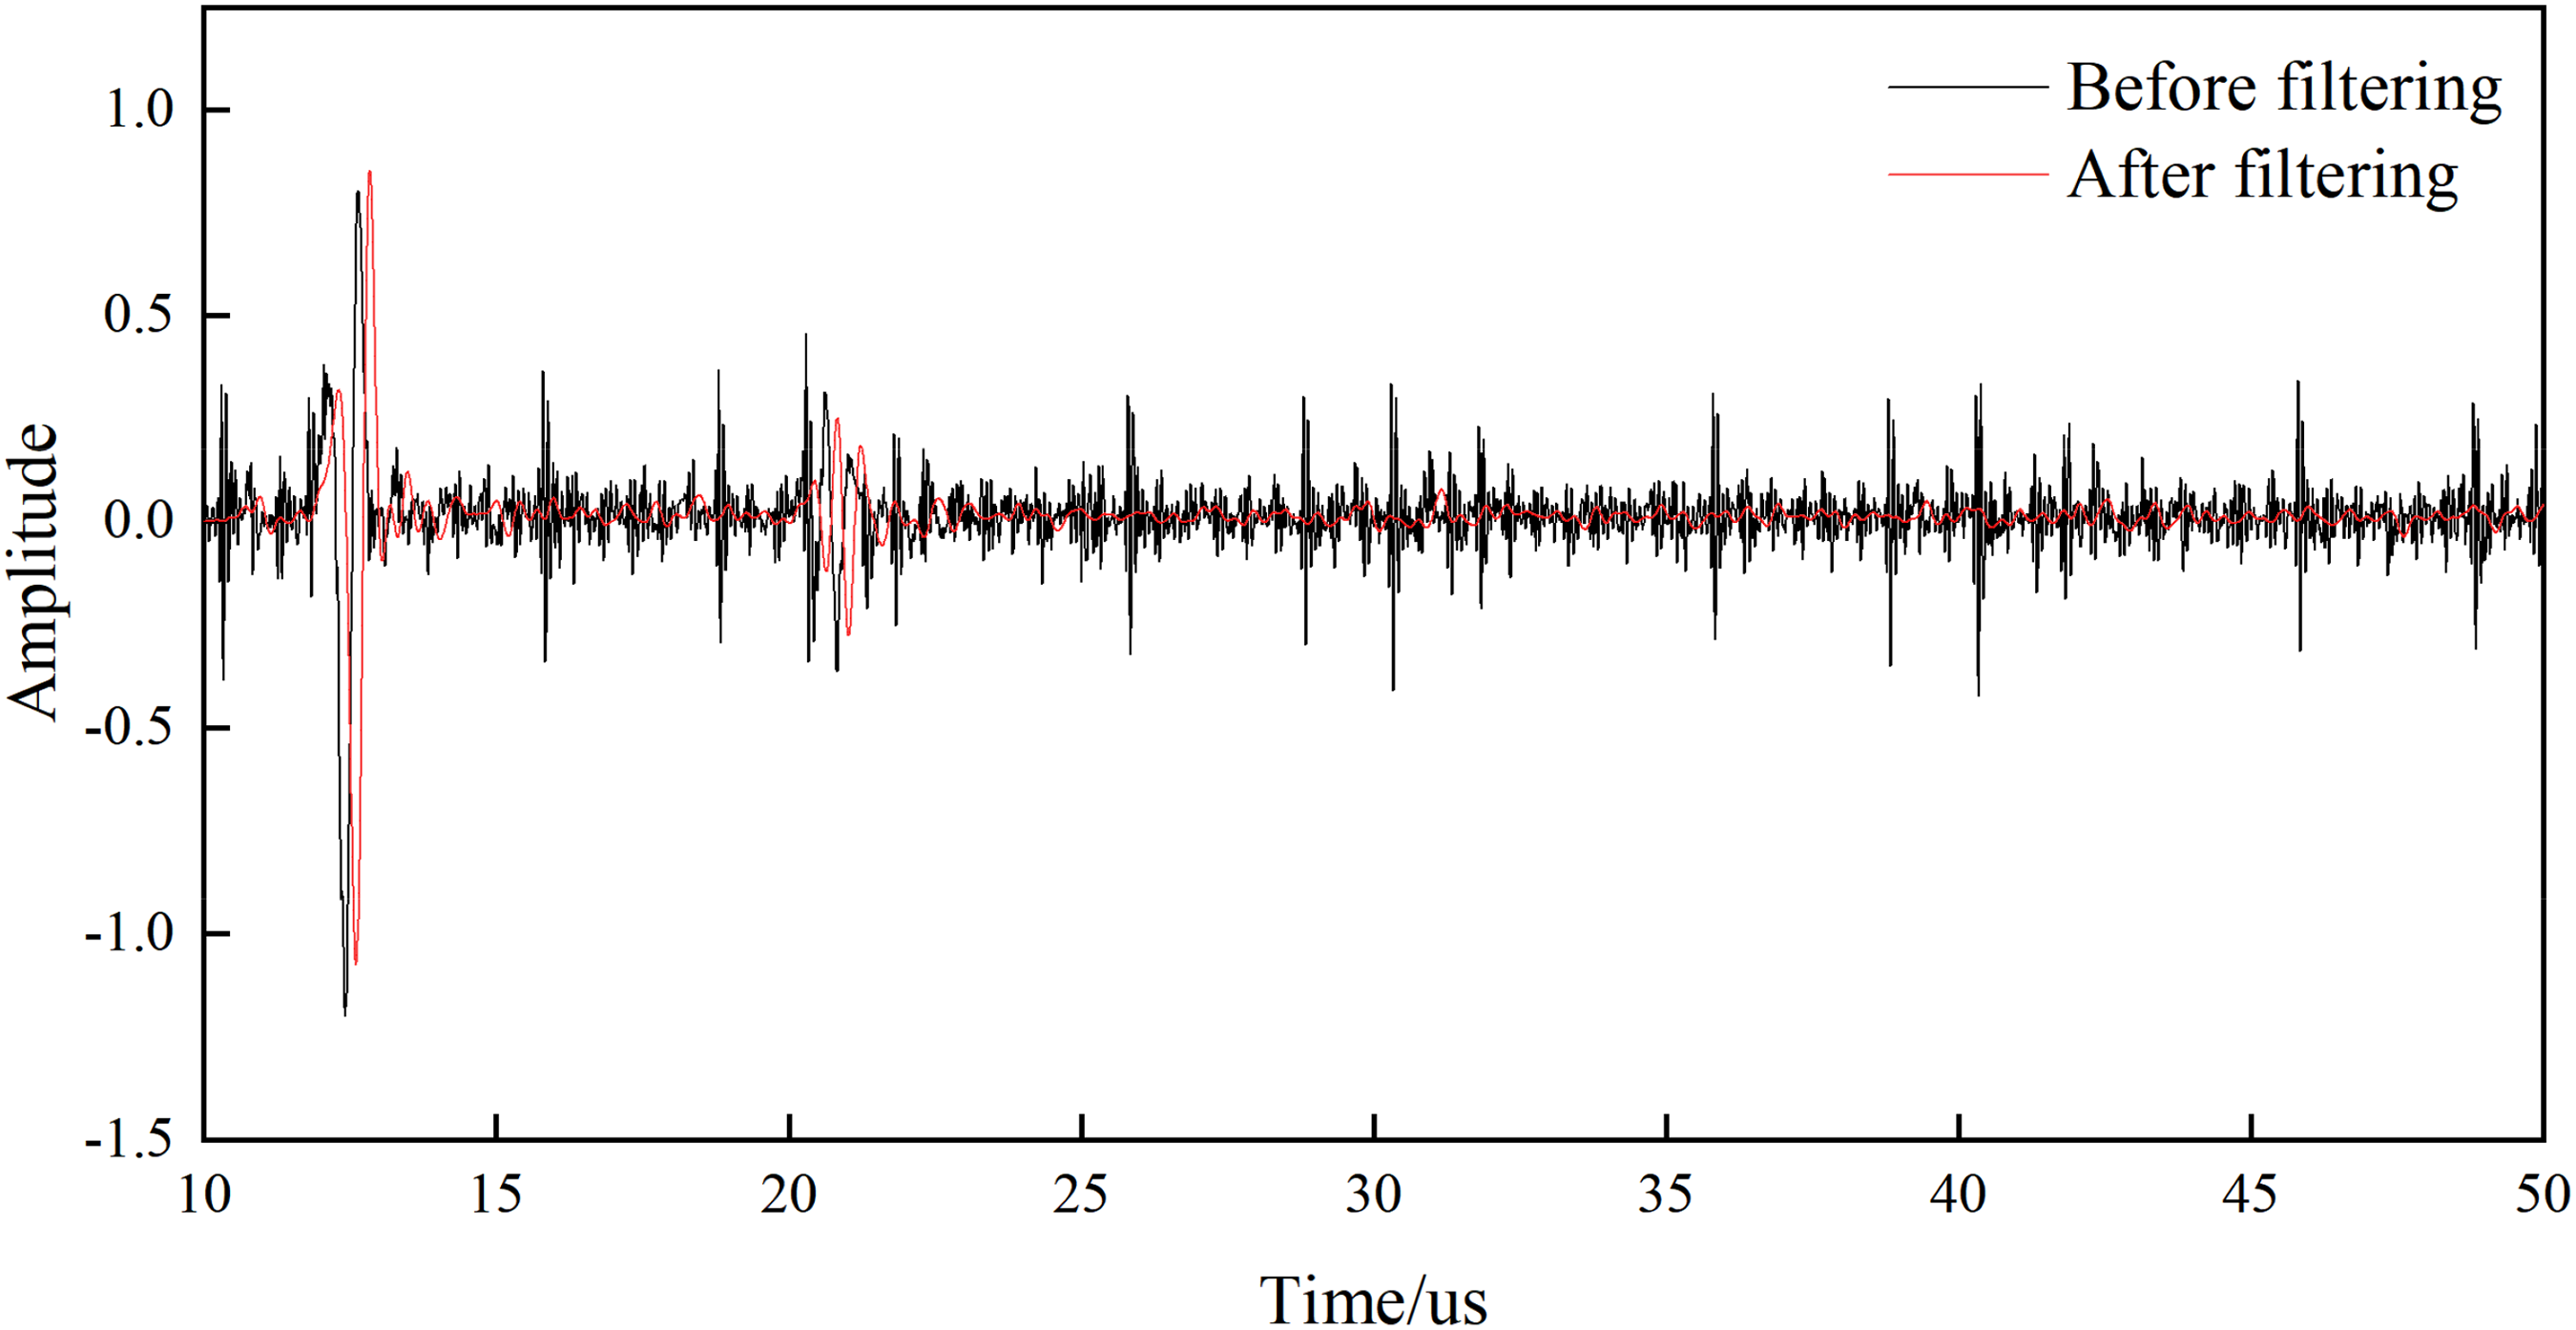
Signal comparison before and after filtering.
As shown in Figure 7, the time domain and frequency domain plots of the acoustic surface wave signals were collected at the same location with a defect depth of 0.2 mm and 0.5 mm, respectively. Comparing the signal waveform of two different depths of defects, it can be seen that: in the time domain, as the depth of the defect increases, the amplitude of the reflected echo increases; while the fast Fourier transform of the time domain signal shows that: in the frequency domain, as the depth of the defect increases, the corresponding amplitude of the center frequency also increases.

Time-domain signal and frequency domain signal for different defect depths.
In summary, the two ultrasonic signal parameters, reflected wave amplitude and center frequency corresponding amplitude, have a certain relationship with the variation of defect depth. However, it is difficult to identify small defects with high accuracy by relying only on these two variables, so multiple feature quantities need to be introduced to achieve quantitative identification of defect depth. The time-domain statistical indicators such as kurtosis, waveform factor, pulse factor and waveform factor are less sensitive to the amplitude and frequency of the signal and depend only on the amplitude probability density function of the signal, and the defect characteristics can be intuitively reflected in these indicators. This paper will combine the time-frequency domain amplitude of ultrasonic signals with multiple time-domain statistical indicators, and establish multiple feature vectors to achieve accurate quantitative identification of defect depth.
Defect depth recognition
Features extraction
In this paper, the ultrasonic signal acquisition for the standard ten micro-defect samples to be measured, the overall size of the sample is 100 mm * 40 mm * 20 mm aluminum block, at a distance of 10 mm from the edge of the sample for the processed surface defects, the defect width is 0.3 mm, the defect depth is 0.1 mm–1.0 mm, in increments of 0.1 mm, a total of ten samples, each sample for 10 times Laser ultrasonic inspection repeat experiments, each sampling length of 1024.
The waveform of laser ultrasound signals behaves differently in surface defects of different depths, which can be reflected in different signal amplitudes, energies, arrival times and other characteristics. According to the elaboration in the previous section, seven feature vectors, such as time-domain peak, center frequency peak, kurtosis, waveform factor, peak factor, pulse factor and margin factor of ultrasonic shape signal, are selected in this paper, which together forms the sample data set for the support vector machine to realize the depth recognition of defects. The kurtosis expresses the smoothness of the signal waveform. When the kurtosis is small, the waveform is smoother, and when the kurtosis is larger, the waveform is steeper; the peak factor expresses the extreme degree of the peak in the waveform, and the peak factor and pulse factor are used to detect whether the signal has an impact. the margin factor is the ratio of the signal peak value to the square root amplitude.
The parameters are defined as follows
kurtosis:
waveform factor:
peak factor:
pulse factor:
margin factor:
Where:
Feature vectors corresponding to different depth defects (partial).

Training and testing
In support vector machines, the cost coefficient C is used to weigh the loss and the weight of the classification interval, and the kernel coefficient g affects the radial range of action of the function and determines the range and distribution characteristics of the training sample data, and these two parameters have an important impact on its performance. In this paper, meshgrid function grid search algorithm is used to find the optimal cost and kernel coefficient, and further establish the recognition model of surface defect depth based on support vector machine.
Based on the constructed database set, the first 90 sets of data are used as training samples and the other sets of data are used as testing samples for computational testing. In this paper, the established SVR defect depth recognition model is trained and tested several times, and the performance of the established model is evaluated using the mean square error MSE and the coefficient of determination R-squared. To eliminate the influence of different magnitudes of data in the feature vector on the calculation results, firstly the data set was normalized. The results of the training and test sets after multiple calculations are given in Figure 8. It can be seen from the figure that the true and predicted values of each training set are in good agreement, with R-squares of 0.995, 0.992, 0.985, 0.990, 0.990 and 0.992, respectively; The goodness of fit between the true and predicted values was also high in the test set, with R-squared of 0.983, 0.961, 0.956, 0.978, 0.970 and 0.952, respectively. The accuracy of the training set is maintained at about 0.99, and the accuracy of the test set can be maintained above 0.95. At the same time, since the difference between the accuracy is small, it indicates that the established support vector machine-based defect depth recognition model has no over-fitting problem.

Defect depth prediction for the training set and test set.
To express the recognition performance of the model more intuitively, the average relative error between the true and predicted values in each of the above test sets was calculated separately, as shown in Table 3. As can be seen from the table, the relative errors using the model in these six test results are small, basically remaining below 10%, with the minimum error up to 3.16%, proving the feasibility and reliability of the laser ultrasonic surface defect recognition model based on support vector machines.
Average relative error of predicted and true values.

Based on the same experimental data environment, this section will introduce the traditional reflection echo method with BP neural network algorithm for the prediction of rectangular defect depth,and compared with the support vector machine depth prediction model proposed in this paper, the determination coefficients and mean square error MSE under different prediction methods are shown in Figure 9. It can be seen from the figure that the support vector machine-based defect depth prediction model improves the coefficient of determination by 8.3% and 5.9%, respectively, and the mean square error is significantly lower than the reflection echo method and BP neural network algorithm. Therefore, the support vector machine model is significantly due to the other two calculation methods in these two indicators, and the prediction accuracy of defect depth will be significantly improved.

Evaluation of prediction results of different methods.
Conclusion
In this paper, the laser ultrasonic NDT method is combined with a support vector machine, and a defect depth recognition model is constructed based on the nonlinear mapping function of the support vector machine, realizing the quantitative recognition of rectangular defect depth on the material surface.
Based on the principle of laser-excited ultrasound, a laser-excited thermal-solid coupling model was established based on COMSOL finite element software, and the interaction between laser-excited acoustic surface waves and material surface defects was numerically simulated. The reflected wave signal after interacting with the defect is obtained. The simulation result shows that the reflected wave signal waveform has a large difference in amplitude in the case of different depth defects. The larger the defect depth, the greater the reflected wave amplitude, and vice versa. On this basis, laser ultrasonic detection experiments were conducted for surface defects of different depths, and several sets of ultrasonic signal waveforms were collected. Based on the signal data, seven feature vectors, such as corresponding time-domain peak, center frequency peak, kurtosis, waveform factor, peak factor, pulse factor and margin factor, were extracted as the input features of the defect depth recognition model of the support vector machine, and the prediction of the surface defect depth was completed. The results of several calculations show that the coefficient of determination R-squared is maintained above 0.95, indicating that the established support vector machine laser ultrasonic surface defect depth recognition model is feasible and reliable.
Footnotes
Declaration of conflicting interests
The author(s) declared no potential conflicts of interest with respect to the research, authorship, and/or publication of this article.
Funding
The author(s) disclosed receipt of the following financial support for the research, authorship, and/or publication of this article: This work was supported by the Open Fund of Provincial and Ministerial Scientific Research Institutions of Civil Aviation University of China (Grants No.2021ASP-TJ01).