
Abstract
Porous media combustion has significant advantages of high thermal efficiency and low pollution emissions. However, the flow state in the porous media will affect the reaction rate. In order to increase the rate of chemical reactions, the fluid flow resistance in the porous media must be reduced. The pressure drop test of SiC foam ceramics was carried out. By changing the pore density of the experimental materials, the pressure drop characteristics of SiC foam ceramic are tested and analyzed. Based on the classical Ergun equation, a semi-empirical formula for calculating the pressure drop gradient of SiC foam ceramics with the airflow velocity is proposed. The two constants in the formula are calculated by measurement, and the applicability of the formula is verified. This formula can quickly analyze the pressure drop characteristics of SiC foam ceramic materials. The accurate measurement of pressure drop is helpful to determine the rated pressure of the head of foam ceramic burner and reduce the investment of front-end fans in industrial burners.
Introduction
Combustion is the primary means of energy utilization. During the process, a large number of pollutants are discharged into the atmosphere. Porous media combustion has significant advantages of high thermal efficiency and low pollution emissions. 1 Hence, to improve energy efficiency and reduce the emission of pollutants, porous media combustion and other new combustion methods can be used.
However, in a porous media burner that uses ceramic foam as the burner core, there will be a non-negligible flow resistance in the combustion chamber due to its irregular physical structure. To make the outlet flow rate reach a specific value at the burner head and maintain the flame for stable combustion, the burner head must keep a certain static pressure, thus reducing the energy consumption of the burner power system.
As a kind of porous material, SiC foam ceramic is widely used in different engineering fields. For example, in solar energy utilization, SiC foam ceramics can be used as a solar absorber in the volumetric solar receiver 2 to heat the gas flowing through the porous materials,3,4 which improves the utilization efficiency of solar energy. Also, in the chemical industry, SiC foam ceramics are often used as catalysts for chemical reactions. The flow state of the chemical raw materials in the porous media will significantly affect the reaction rate. Therefore, the fluid flow resistance in the porous media must be reduced to increase the rate of the chemical reaction.5,6
Furthermore, in energy engineering, SiC foam ceramics can be used in heat exchangers to improve thermal efficiency, supporting the development of heat exchangers because the flow state of fluid will significantly influence the heat transfer effect.7–9 As a result, in addition to good heat transfer performance, a lower flow pressure drop is also necessary for SiC foam ceramics. SiC foam ceramics can also be used as construction materials to absorb solar energy and meet indoor heating demand.10,11 They are the storage and transportation materials of methane hydrate, increasing the rate of hydrate formation and promoting hydrates. 12
For strengthening the application of porous media in various fields, the resistance characteristics of SiC foam ceramics should be studied to provide a more accurate calculation method for resistance and help the research and development of SiC foam ceramics.
The earliest research on flow resistance is Darcy's law in 1856, which only considers the fluid's viscous resistance and is only suitable for fluids with a small Reynolds number. In 1901, Forchheimer modified Darcy's law considering the viscous resistance and inertial force of the fluid, and believed that the pressure drop in porous media is proportional to the square of the fluid velocity. In 2008, Edouard et al. 13 reviewed the pressure drop formulas of porous foams, and the results showed that all the formulas are based on the Darcy–Forchheimer formula, and it is called the Ergun equation as equation (1).
The flow resistance needs to consider the porosity, pore size, viscosity, and inlet velocity of porous media. The pressure drop of unidirectional flow in porous media is the sum of the primary and secondary terms of the fluid velocity.
14
The classic Ergun equation was proposed based on the particle-packed bed model and calculated the two empirical constants (A = 150, B = 1.75) in the equation using the least square method. However, through experimental method and numerical simulation, these two empirical constants are not fixed depending on porous media materials. For example, Dietrich measured A = 110, B = 1.45.
15

This article will calculate and correct the two empirical constants in the Ergun equation by measuring the pressure drop of SiC foam ceramics. The accurate measurement of these constants will help determine the head of the foam ceramic burner's head pressure and reduce the investment in the front-end fans of the industrial burner.
Methodology
Theoretical analysis
The typical characteristics of SiC foam ceramics are small pore size, large specific surface area and irregular pore structure. They can enhance the convective heat transfer between gas and solid, and enhance the flow resistance of fluid in the foam ceramic. Select the inlet and the outlet of foam ceramic along the airflow direction as the resistance characteristic calculation sections, as shown in Figure 1.

Measurement section.
From Bernoulli’s equation:

From the continuity equation:

The experiments were tested in 1 day to reduce the influence of the environment so that the fluid density can be viewed as constant. Therefore, v1 equals v2.

From the structures, the foam ceramics can be regarded as the opposite model of the particle-packed bed model, so the packed particles can be viewed as the pores inside the foam ceramic, and the voids around the particles are the solid skeleton of foam ceramics.
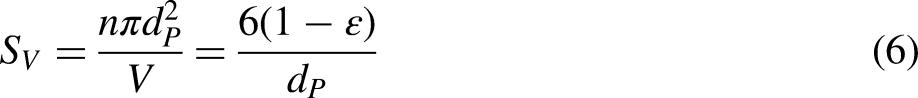
Therefore, suppose the particle-packed bed with a total volume of V (m3) is composed of n solid particles with the diameter of dp (m), and the volume of solid is Vp (m3). The porosity ɛ and the specific surface area SV (m2/m3) are calculated as equations (5) and (6).


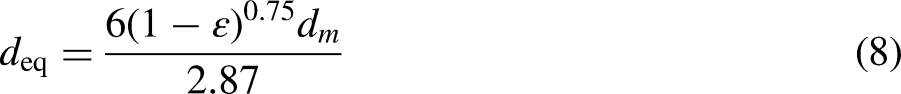
Through equations (6) and (7):

Experiment
Experimental system
The experimental system is shown in Figure 2, mainly composed of an air compressor, a surge tank, a flowmeter, SiC foam ceramics, and a micro-pressure gauge.

Experimental system.
The SiC foam ceramics are filled in a transparent tube. The pressure measuring end is a slender tube with a length of 1 m, and a rubber tube is connected with a micro-pressure gauge whose accuracy is 1 Pa.
Experimental material
The temperature of the environment in this experiment is 15 °C. The fluid used for measurement is air, so the viscosity μ is 1.7 4 × 10⁻⁵ Pa s, and the density ρ is 1.27 kg/m3. The experimental material is SiC foam ceramic with these nominal parameters: a diameter of 70 mm, a thickness of 20 mm, a porosity of 80%, and a pore density of 10 PPI, 15 PPI, 20 PPI, and 30 PPI. The different materials are shown in Figure 3.

Experimental material. (A) 10 PPI; (B) 15 PPI; (C) 20 PPI; (D) 30 PPI.
The pore volume is measured by the Archimedes drainage method, and the volume porosity is used to define the actual foam ceramic porosity. The porosity is the ratio of tiny interconnected voids in SiC foam ceramic to the outer volume of SiC foam ceramic.

The measurement results of porosity of initial materials are 78–83%. To ensure the accuracy of the experiment, similar porosity of SiC foam ceramics are selected to the experiment. This measured porosity is 80 ± 0.5%, which matches the nominal value. Six pieces of SiC foam ceramics under each pore density, a total of 24 pieces, were selected to conduct experiments to ensure accuracy. Small PPI means large pore diameter, but the size of the skeleton is also large, and the skeleton of SiC foam ceramic is thin under large PPI. Therefore, generally, the porosity could be kept constantly, although the PPI changes under the same volume of materials.
The mean pore diameter refers to the average value of the actual pore size of each skeleton unit in the foam ceramic, representing the average distance between the relative pillars that define the pores. A vernier caliper is used to measure along the sideline of the skeleton unit. The measurement results are shown in Table 1.
Parameter of SiC foam ceramics.

The pore Reynolds number Rem is defined by the mean pore diameter of the foam ceramic, and its expression is: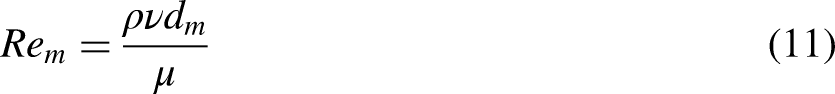
Experimental process
To reduce the influence of the pressure drop caused by the test system itself, a pre-experiment was carried out before the experiment without foam ceramic. If the pressure drop caused by the test system is <1 Pa within the range of the test conditions, the error caused by the test system can be ignored.
Taking the SiC foam ceramics with a thickness of 120 mm (total 6 pieces) and a pore density of 15 PPI as the research object, the inlet air velocity is adjusted to 0 and gradually increased to 2 m/s.
Measure the pressure drop on both sides of the SiC foam ceramic under different airflow speeds to derive the semi-empirical formula.
Keep the thickness of the foam ceramic remains unchanged, replace SiC foam ceramics with different pore densities (10 PPI, 15 PPI, 20 PPI, and 30 PPI), and repeat process (3) to verify the applicability of the semi-empirical formula in different pore density, and analyze the error.
To reduce the error caused by the accidental factors of the experiment, the average of measured values in three times is taken for each experiment result. The 120 mm thick SiC foam ceramic is a stack of 6 pieces of 20 mm thick materials, which is similar to the actual product requirements.
Result and analysis
Semi-empirical formula
Figure 4 reflects the effect of airflow velocity on the pressure drop gradient after air is introduced into 15 PPI SiC foam ceramics, compared with previous literature.14,15 As the airflow velocity increases, the pressure drop gradient also increases. When the airflow velocity is small, the pressure drop gradient rises slowly, and when the airflow velocity is large, the pressure drop gradient changes significantly. The pressure drop gradient can be fitted to the sum of the first and secondary terms of the fluid velocity. The main reason is that viscous resistance has a positive linear correlation with flow velocity, and inertial resistance has a quadratic relationship with flow velocity. When the flow velocity is small, the viscous resistance plays a leading role, and the pressure drop rises slowly with the increase of the flow velocity. After the flow velocity gradually increases, the inertial resistance increases significantly. Under the combined action of the viscous resistance and the inertial resistance, the pressure drop rises more obviously with the flow velocity increasing. Therefore, in the research range, the pressure drop gradient is expressed as the sum of the first and secondary terms of the fluid velocity.

Pressure drop gradient under 15 PPI.
From Figure 4, the Ergun classic formula does not fit the actual measured value, and the difference is obvious. The main reasons are that the Ergun classic formula uses particle-packed bed as the experimental object, and there is a significant difference in structure from foam ceramics. For packed particles, the volume between each particle is relatively close, and although the overall porosity of foam ceramics remains basically constant, a significant difference exists between tiny individual pores. The overall effect is different from the parameters obtained by the particle-packed bed model. The empirical values of A and B can be calculated by fitting with equation (9). The result is A = 61, B = 0.28, which is significantly different from the constant value of the Ergun classic formula.
Validation of applicability
To verify the applicability of A and B values for different conditions, the calculated pressure drop of foam ceramics with different pore densities was compared with the actual measured values. The comparison results and their errors are shown in Figure 5 and Table 2.
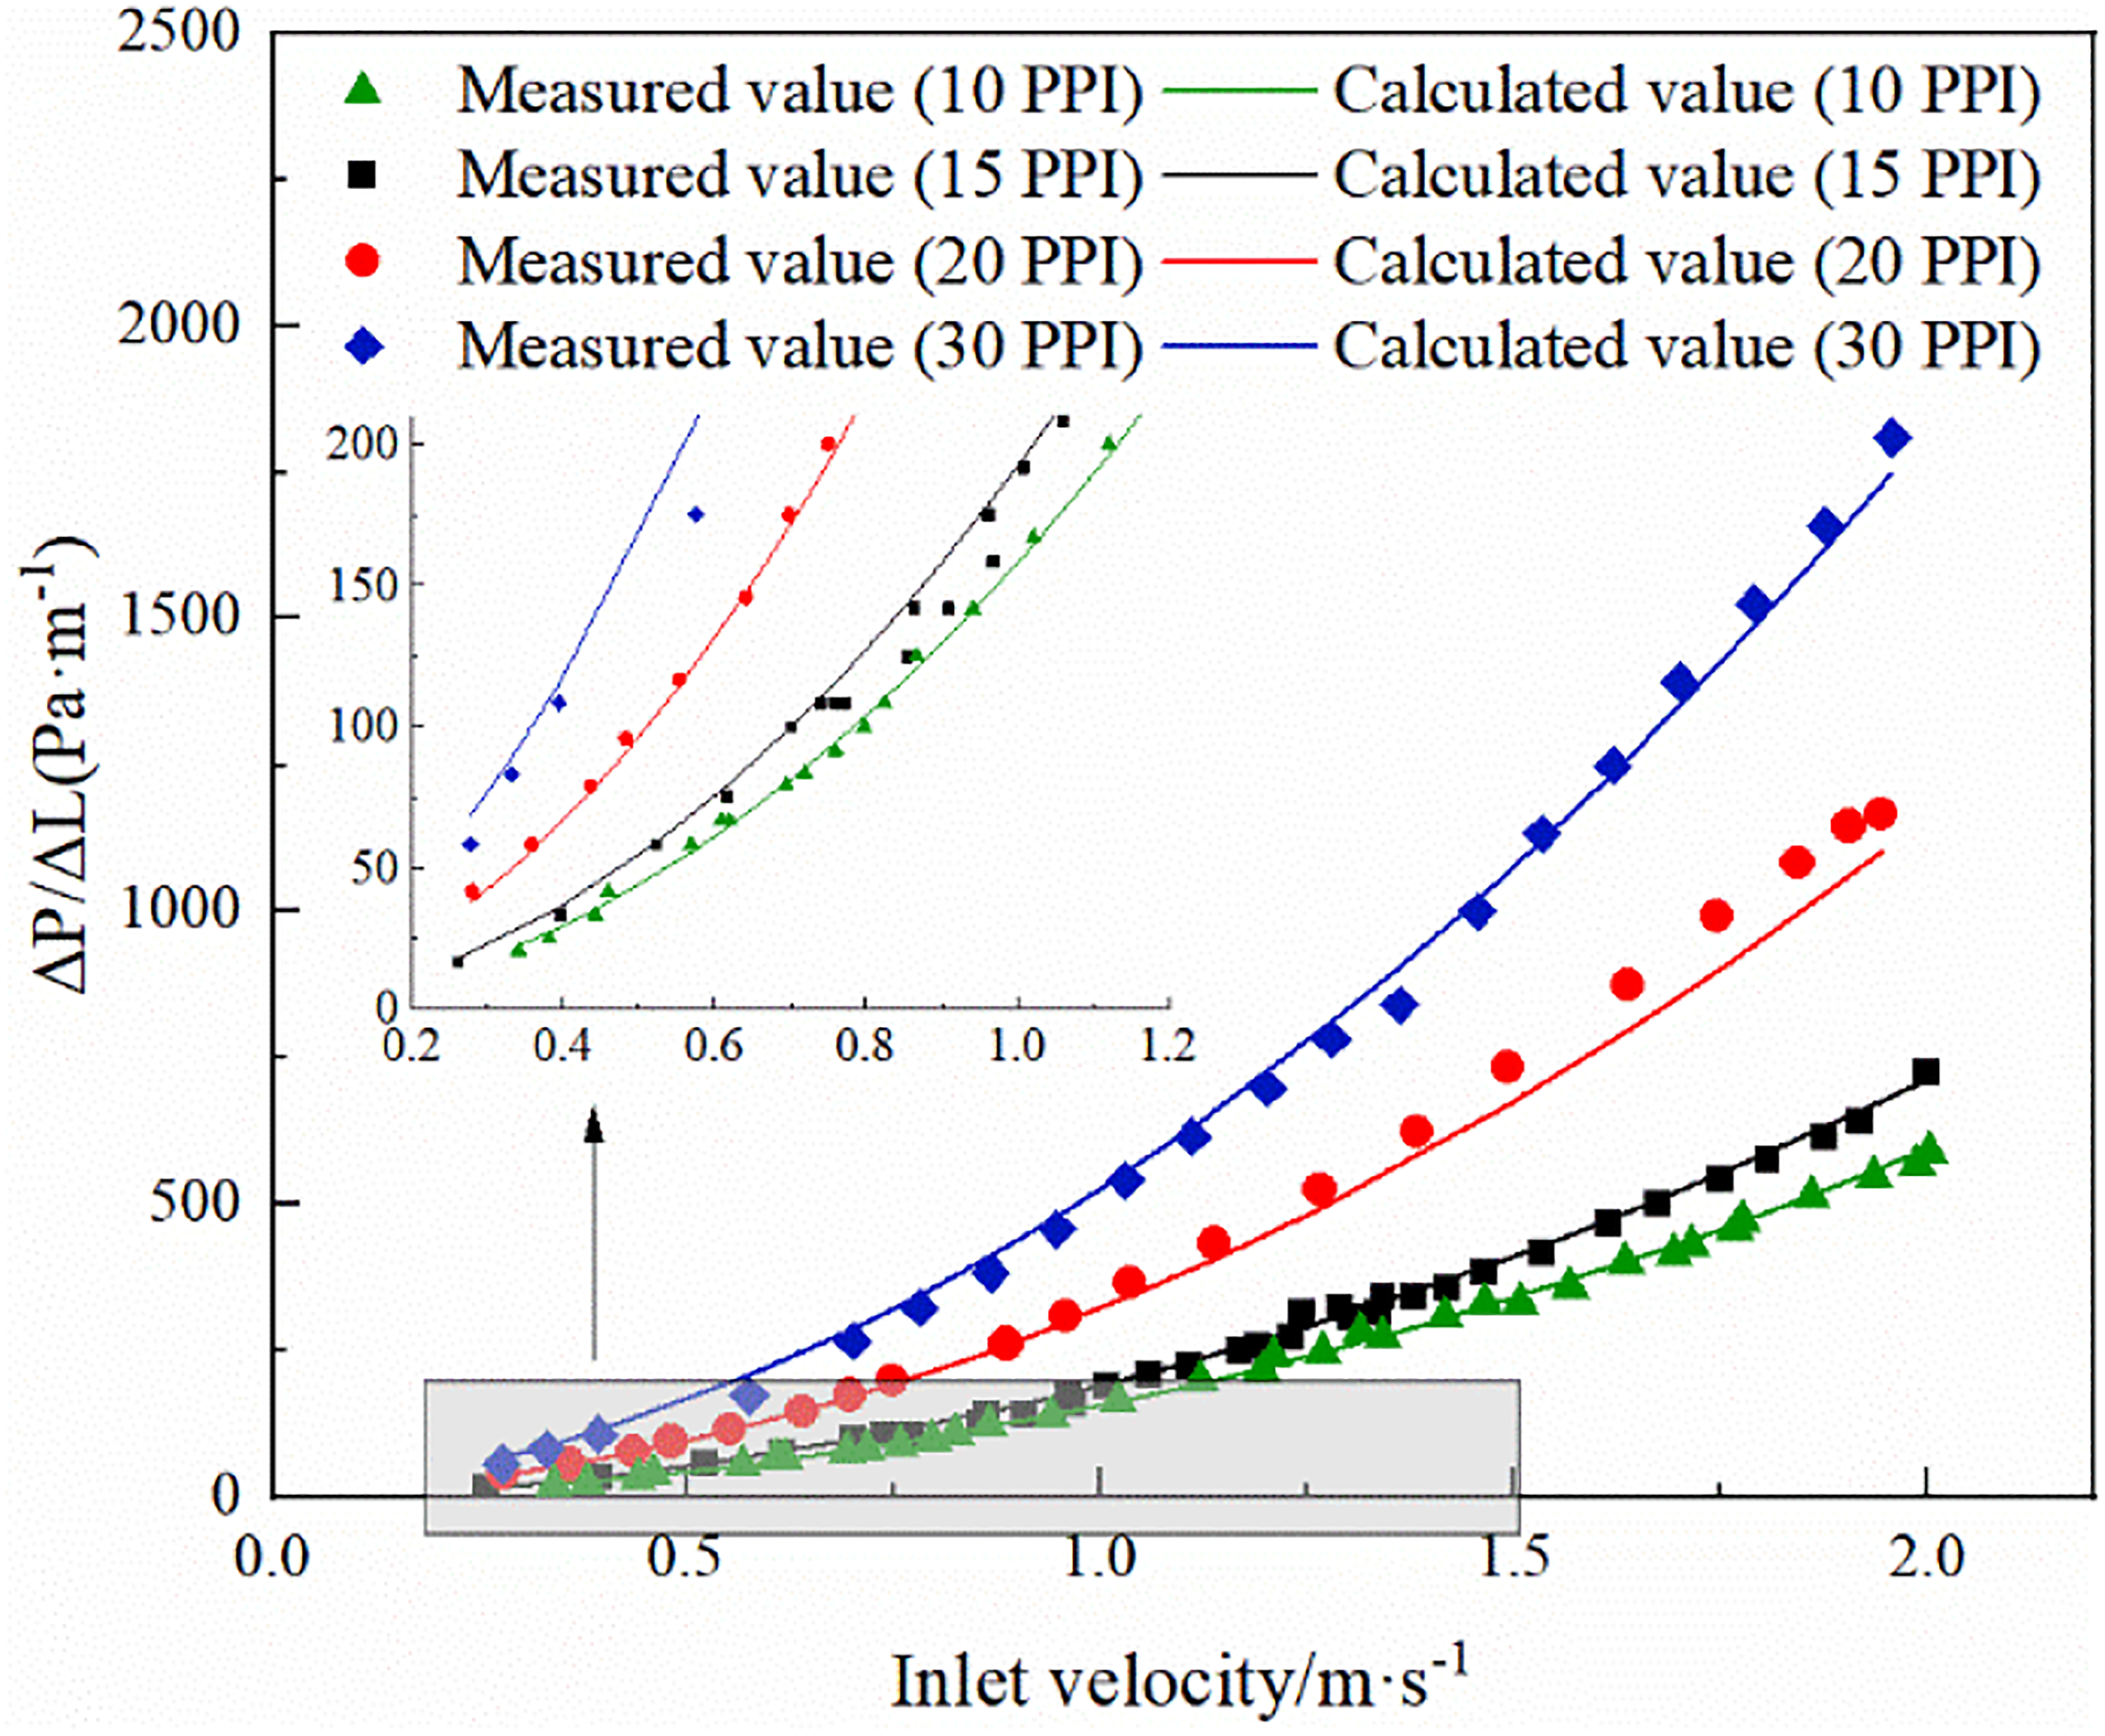
Pressure drop gradient under different pore density values.
Maximum error and proportion of errors.

This semi-empirical formula mainly considers viscous resistance and inertial resistance. When the fluid flows at low speed, viscous resistance dominates. Fluid is easier to adhere to on the SiC foam ceramic surface.
From the data in Table 1, the specific surface area of 10 PPI, 15 PPI, and 20 PPI is 564.50, 685.46, and 959.64, respectively. The difference between the specific surface area of 10 PPI and 15 PPI is 120.96, and that between 15 PPI and 20 PPI is 274.18. When other factors are the same, a larger specific surface area means a larger pressure drop. At the same time, the difference between 30 PPI and 20 PPI is 472.66, which confirms the more obvious change in the 30 PPI pressure drop curve in Figure 5.
It can be seen from Figure 5 and Table 2 that the semi-empirical formula derived from the 15 PPI can also be well applied to the SiC foam ceramics of 10 PPI, 20 PPI, and 30 PPI. The theoretical calculation curves match the measured values, and the maximum error is 17.7%. Among them, 10 PPI and 30 PPI have the best application results, all measured values have an error within 10%, and most of the 20 PPI material has an error between 5% and 10%.
High pore density of porous media means small pore size and large pressure drop gradient, showing that the resistance to airflow is apparent. Based on the structure of SiC foam ceramics, high pore density causes sizeable specific surface area and tiny pores. Therefore, high skeleton density in the unit space increases the fluency that the gas collides with the skeleton rises, raising the friction resistance coefficient, resulting in the obstructive effect on the airflow. Also, high pore density means a large flow resistance coefficient, leading to a large pressure drop.
Due to the rounding of decimals when determining the constant value in the fitting formula, the error of 15 PPI SiC foam ceramics is more apparent when the flow velocity is low. Moreover, because the accuracy of the micro-pressure gauge is limited, when the airflow velocity is small, the pressure drop changes are not noticeable. The micro-pressure gauge can only be accurate to 1 Pa, resulting in a particular gap between the calculated value and the measured value. In addition, although the porosity of the material is not much different, the porosity value in this formula influences the pressure drop, and the porosity of experimental materials cannot be completely the same.
Therefore, in the range of Rem from 0 to 500, the semi-empirical formula for the pressure drop gradient of the SiC foam ceramic in the cold state can be expressed as:
Uncertainty analysis
To confirm the reliability of constant A and B, the uncertainty should be evaluated.
Uncertainty calculation
A total of 15 experiments were conducted independently with the same measurement accuracy. The results are A1, B1; A2, B2; … A15, B15.
The arithmetic mean values are as equation (13):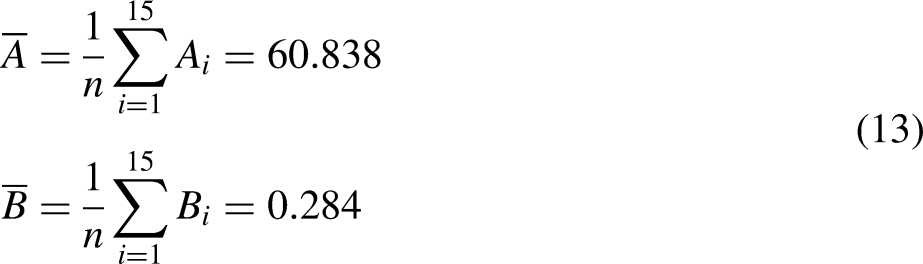
The experimental standard deviations are as equation (14):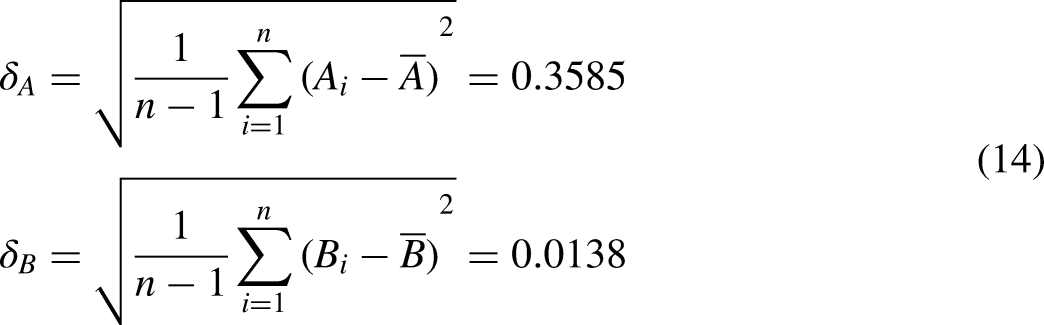
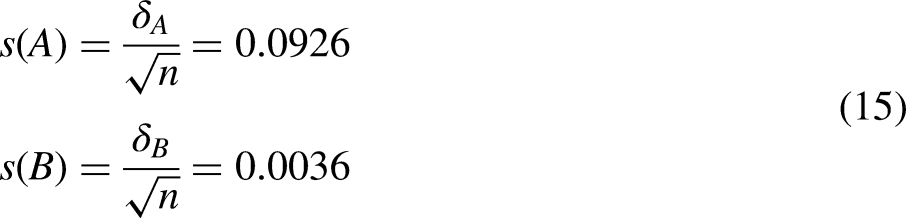
Hypothetical test
When the significance level α is 0.05, a hypothesis test is performed on the experimental results.
Suppose H0: {A = 61, B = 0.28}. H1: {A≠68, B≠0.28}.
Since 

Conclusion
In this paper, a pressure drop experiment was carried out using SiC foam ceramic materials with a pore density between 10 PPI and 30 PPI and porosity of 80 ± 0.5%, and the pressure drop characteristics of the material were analyzed. Based on the Ergun formula, a semi-empirical formula for calculating the pressure drop gradient of SiC foam ceramics with the airflow velocity is proposed. The two constants in the equation are calculated, and their applicability is verified, and the two constants are irrelevant to the pore size and porosity of the material. When Rem is in the range of 0–500, the pressure drop gradient when air passes through the SiC foam ceramic can be expressed as a quadratic function of the airflow velocity. The specific form of this equation is as follows:
Footnotes
Acknowledgements
All the authors wish to thank the referees and editor for the suggestions and comments on this manuscript.
Author contributions
SC: conceptualization, methodology, modeling, experiment, formal analysis, visualization, writing original draft, writing review and editing. SS: conceptualization, methodology, experiment, formal analysis, visualization, writing original draft. YZ: conceptualization, methodology, modeling, experiment, formal analysis, writing original draft and editing. SZ: conceptualization, methodology, formal analysis, visualization, supervision, writing original draft, writing review and editing. SP: conceptualization, supervision, funding, writing review and editing.
Declaration of conflicting interests
The authors declared no potential conflicts of interest with respect to the research, authorship, and/or publication of this article.
Funding
The authors disclosed receipt of the following financial support for the research, authorship, and/or publication of this article: This work was supported by the Postgraduate Cultivation Fund of Chongqing University (grant number 0219001105303/059).