
Abstract
To fight COVID-19, global access to reliable data is vital. Given the rapid acceleration of new cases and the common sense of global urgency, COVID-19 is subject to thorough measurement on a country-by-country basis. The world is witnessing an increasing demand for reliable data and impactful information on the novel disease. Can we trust the data on the COVID-19 spread worldwide? This study aims to assess the reliability of COVID-19 global data as disclosed by local authorities in 202 countries. It is commonly accepted that the frequency distribution of leading digits of COVID-19 data shall comply with Benford’s law. In this context, the author collected and statistically assessed 106,274 records of daily infections, deaths, and tests around the world. The analysis of worldwide data suggests good agreement between theory and reported incidents. Approximately 69% of countries worldwide show some deviations from Benford’s law. The author found that records of daily infections, deaths, and tests from 28% of countries adhered well to the anticipated frequency of first digits. By contrast, six countries disclosed pandemic data that do not comply with the first-digit law. With over 82 million citizens, Germany publishes the most reliable records on the COVID-19 spread. In contrast, the Islamic Republic of Iran provides by far the most non-compliant data. The author concludes that inconsistencies with Benford’s law might be a strong indicator of artificially fabricated data on the spread of SARS-CoV-2 by local authorities. Partially consistent with prior research, the United States, Germany, France, Australia, Japan, and China reveal data that satisfies Benford’s law. Unification of reporting procedures and policies globally could improve the quality of data and thus the fight against the deadly virus.
Background
The novel virus—also known as Coronavirus Disease 2019, COVID-19, or SARS-CoV-2—is a respiratory illness. The widely accepted understanding is that the virus typically spreads via airborne droplets from an infected patient’s coughs or sneezes. 1 The unpleasant news of SARS-CoV-2 emerged with the World Health Organization (WHO) announcement on January 10, 2020. The WHO distributed a brief report on new pneumonia cases of unknown cause detected in Wuhan City, in the Chinese province Hubei, on December 31, 2019. After several months, the world now faces millions of Coronavirus cases and deaths while COVID-19 has been rapidly propagating.
The severe impact of the fast-paced increase in Coronavirus cases and deaths has intensified in line with the logistic law. 2 Since the rapid surge of Coronavirus in early 2020, incidents have continued to escalate with unprecedented speed across all countries worldwide. Since the beginning of the pandemic, a tidal wave of data on Coronavirus has emerged, often without scientific proof. The commonly reported measures are “new cases”—individuals testing positive for the virus—and “new deaths”—patients who have died due to infection with COVID-19.
Data on Coronavirus is typically generated and governed by local authorities, governments, national, and subnational agencies around the globe. These statistics, mainly on the known cases, may not tell the entire truth about the pandemic. The unknown instances or asymptomatic infectious individuals—those who carry the virus in their bodies but show no symptoms—add additional complexity in this context, as these are entirely neglected in global measurement.
Balsari et al. 3 address their concerns on the quality of information on COVID-19. They propose transparency, thoughtfulness, and steadfast expertise as the foremost principles for the dependability and overall quality of any data, publications, or reports on Coronavirus spread and related crises.
The Johns Hopkins University (JHU) of the United States has been collecting, aggregating, and publishing updates on confirmed cases and deaths for all countries since January 22, 2020. Millions of people track the development of the pandemic by using the John Hopkins data. To effectively fight the pandemic, it is essential to have reliable data that is freely accessible to the global research community. This way, researchers worldwide can create and share new insights. Local authorities can make better policy choices to fight the rapid circulation of the virus. Public confidence in pandemic data can create a sense of urgency for radical but effective socio-economic policies, such as nationwide lockdowns, as witnessed in many territories, for example, in China, France, the United Kingdom, Italy, and Germany.
In its comprehensive assessment and benchmarking of health security and related capabilities across 195 countries—the 2019 Global Health Security Index (GHSI)—the JHU investigated national infrastructures, systems, and policies to respond to epidemics of potential international concern. Only 19% of countries demonstrated sufficient abilities in early detection and reporting. 4 The inaugural report gave the topmost scores to the United States (ranked 1), Australia (ranked 4), Canada (ranked 5), and other advanced European countries, such as the United Kingdom (ranked 2), France (ranked 11), and Germany (ranked 14). The 2019 GHSI took laboratory systems, real-time surveillance and reporting, epidemiology workforce, and data integration between the human, animal, and environmental health sectors into consideration.
Initial doubts about the credibility of Coronavirus data, especially in the case of China, led to a slow response to the emerging pandemic across the world. 4 In recent studies on the evolution and reliability of new cases and deaths from countries with the highest COVID-19 incidence, researchers operationalized forensic techniques, such as Benford’s law. Koch and Okamura 5 confirmed the reliability of the official data coming from COVID-19 flashpoints, such as China, the United States, and Italy. University professors Sambridge and Jackson 6 tested pandemic data reported by 51 countries from January 16 to April 9, 2020. They found statistical evidence for the authenticity of the Coronavirus data coming from those countries. Wei and Vellwock 7 analyzed the Benfordness of pandemic data from China and 20 COVID-19 hot spots as of September 1, 2020. By making use of one goodness-of-fit test, Wei and Vellwock found full compliance with the law for the United States, Brazil, India, Peru, South Africa, Colombia, Mexico, Spain, Argentina, Chile, the United Kingdom, France, Saudi Arabia, China, the Philippines, Belgium, Pakistan, and Italy. In this study, significant irregularities were found for Russia combined with a small divergence in case of Iran. 7 An additional study accompanied by Lee et al. proposed an epidemic growth model and assessed conformation to Benford’s law. Lee et al. 8 discovered that all countries except for Japan satisfied Benfordness.
All of these studies face three major challenges: first, lack of consistency of data stemming from independent states; second, limitations with the sample size—application of forensic techniques require sufficient levels of data; and third, different approaches to the measurement and statistical techniques used in their own workings. This article overcomes these boundaries by extending the scope of the study to 202 countries worldwide, over a longer timeframe, increasing the number of quantifiable variables for measurement, and operationalizing three proven statistical techniques to advance the goodness-of-fit tests.
Method
Benford’s law and goodness-of-fit tests
Benford’s law is a commonly applied technique for the detection of data manipulation and fraud. Its core idea relates to the frequency of leading digits in naturally generated datasets, known as Benford’s law. In a dataset consisting of arbitrary collected integers, the first digits of the numbers should be distributed across nine orders of magnitude. According to Benford’s law, the leading digits of numbers from randomly generated real-life data are skewed toward Benford’s first digit distribution and follow a very specific logarithmic pattern: 30.1% for one, 17.6% for two, 12.5% for three, 9.7% for four, 7.9% for five, 6.7% for six, 5.8% for seven, 5.1% for eight, and 4.6% for nine. 9 Benford 10 asserted that, “Benford’s law reflects a profound harmonic truth of nature.”
In an artificially generated dataset distribution, the numbers would not appear in the same frequency as Benford’s law. If data show a geometrical tendency characterized by the non-existence of minima and maxima, such as population or pandemic distributions, one can observe Benford’s law. The idea relies on Newcomb’s 10 findings of 1881, which addressed the probabilities of first-digit numbers as being given by the following equation:

Benford’s law is common practice in social sciences and has been applied in various disciplines, such as finance and accounting,11–13 politics, 14 and pandemics.5–8 For example, the groundwork theory was used by Roukema 14 to investigate the reliability of election data in Iran.
The body of knowledge accepts different goodness-of-fit tests to assess the reality to the expected distribution. Three commonly used techniques are known and frequently used: Kolmogorov-Smirnov statistic, Chi-square, and Euclidean distance.
The Kolmogorov-Smirnov statistic (or K-S) is a non-parametric test for discrete data and quantifies the distance between the empirical distribution of samples of observations and the cumulative distribution of Benford’s
9
first digit probability. The Kolmogorov-Smirnov statistic was applied to detect potential anomalies and incompliance of data in prior research.12,13 Manipulation is evident if the Kolmogorov-Smirnov statistic is greater than the square root of the total number of the leading digits observed in a probability sample (hereafter referred to as cut-off). Once the K-S statistic is identified, the null hypothesis can be accepted, if:
Another popular technique is the Pearson chi-square (

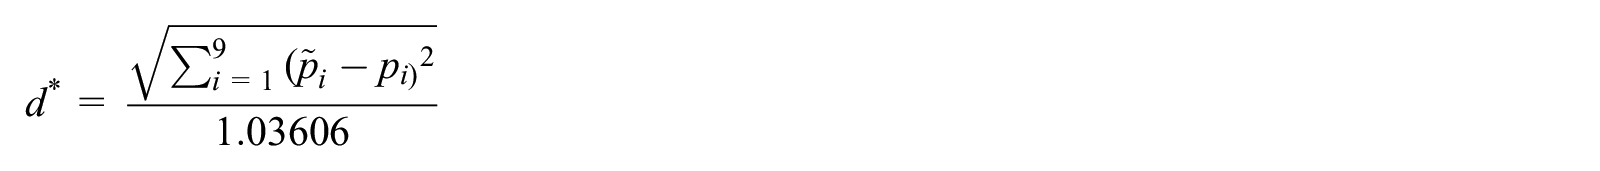
For small sample sizes, the chi-square test encounters difficulties too. 20 As a less sensitive technique to the sample size, the d-factor (d*) is calculated as follows:
For each jurisdiction in the scope of this study, we postulate and draw the following null hypothesis, H0: COVID-19 data from Ji adhere to Benford’s law, where Ji stands for individual jurisdiction in the scope of our analysis. This study operationalizes three goodness-of-fit tests stated above based on a 0.05 significance level.
COVID-19 data sampling
A sample consisting of 1000 observations is considered an acceptable size, although the minimum threshold is not specified in the body of knowledge. The measurement of Benfordness only makes sense if the COVID-19 sample size is not too small. Small datasets may not indicate nonconformities to the expected distribution.
It is logical to assume that conformity to Benford’s law rises if the size and range of the underpinning dataset grows. In contrast to prior research, this study employs the theory based on a larger dataset from 202 countries worldwide and a longer time frame.
Datasets used in this research stem from the COVID-19 Data Repository by the Centre for Systems Science and Engineering at Johns Hopkins University in the US; they include daily submissions of 202 national authorities on daily new cases and new deaths. The John Hopkins Institute provides one of the first glimpses of a global view of how the COVID-19 virus is spreading; the related online services were made available to the public from January 22, 2020. All numbers are taken into consideration to evaluate the compliance of the first digit distribution appearing in the 106,274 cumulative integers reported by 202 nations worldwide, from December 31, 2019, to September 24, 2020.
Our observations are built using three variables quantifiable on a daily basis: (1) new cases, (2) new deaths, and (3) new tests. This study uses a new variable, “new tests,” as an additional measure, which was technically not available in prior research, or was purposefully neglected by researchers. New tests indicate the number of individuals identified for being contaminated with the novel Coronavirus. As of writing this report, the author documents 106,274 integers in total (N, or sample size), including 45,031 on new cases and 16,212 on new tests from all countries in the scope. The data contained either no information, or incomplete information, on new tests for some countries, such as China.
Most of the countries affected by COVID-19 have reported sharp growth in new cases and new deaths, and with some delay, new tests. Some countries report data with no substantial growth rates. The largest sample size of the data on the pandemic stems from the United States. On the contrary, the smallest sample sizes, less than 100, belong to Anguilla, the Falkland Islands, Montserrat, the Vatican, the Western Sahara, Greenland, Dominica, Saint Kitts, and Nevis and can be excluded from the analysis. A list of 155 countries with a sample size larger than n = 100 was extracted, resulting in 384 observations on average.
Results
For each country disclosing big data on the COVID-19 spread in their territories, we evaluated the consistency of the leading digits, mainly by applying Benford’s law and Kolmogorov-Smirnov, chi-square, and d*-factor test statistics. Evaluation of the leading digits reported by 202 jurisdictions since the beginning of the pandemic revealed surprising anomalies. Inconsistencies of the COVID-19 data worldwide are illustrated in Figure 1. Countries that fully comply with the distribution of the leading digits are highlighted green. All countries that do not comply with Benford’s law based on the three goodness-of-fit tests are flagged red. Territories highlighted yellow do not obey the law in at least one of the tests conducted in this study. Gray jurisdictions are those areas for which no sufficient sample size was available, and therefore, a statistical assessment was not applicable.

Worldwide reliability of data on Coronavirus at a glance.
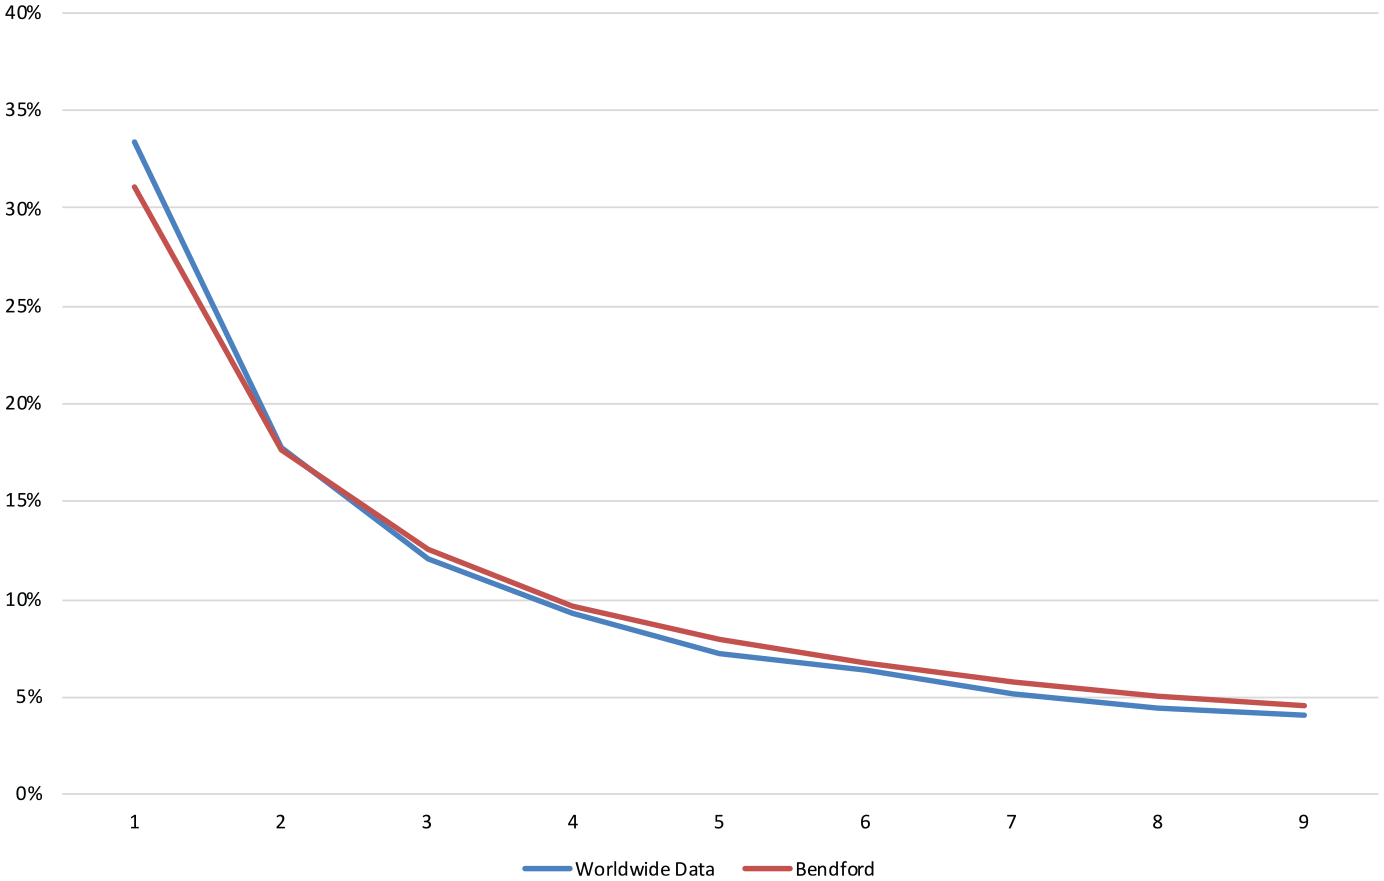
When aggregating all reports from 202 countries, the global data fully complies with Benford’s law (see Figure 2).
Distribution of the worldwide data on Coronavirus—green: complaint countries; yellow: evidence found for incompliance; red: incompliant countries.
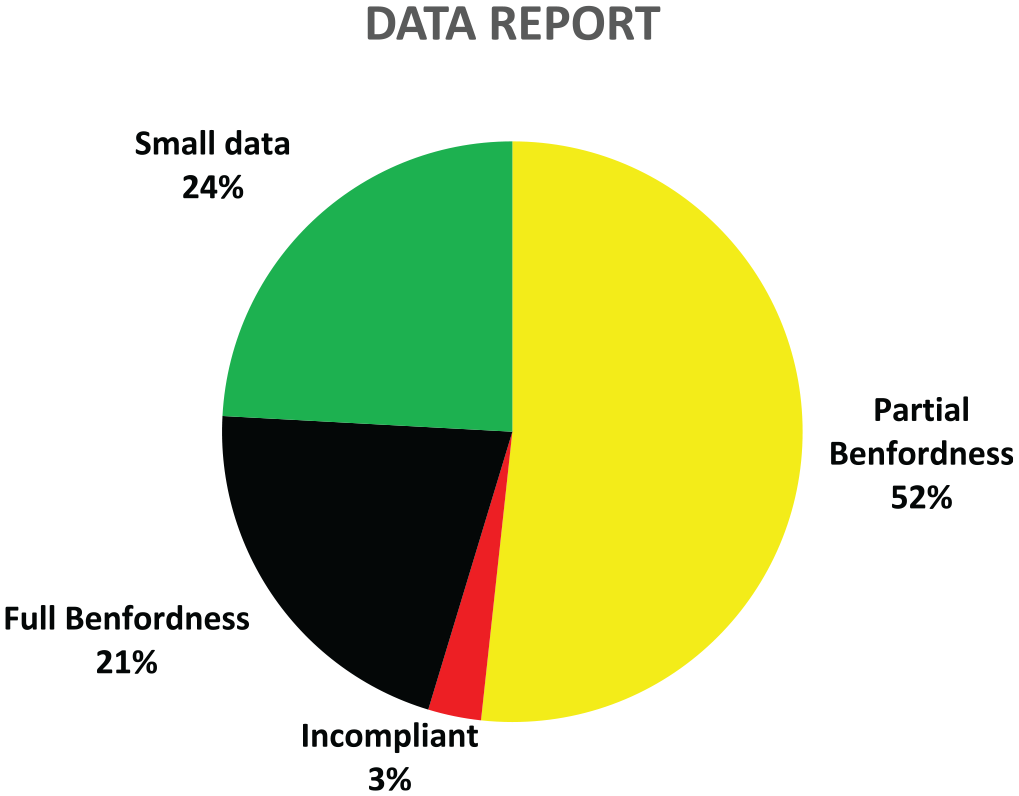
Overall, the author operationalized three variables, new cases, new deaths, and new tests, from 202 countries. For 49 countries or 24% of the observations, the sample size was smaller than 100 (n < 100), which did not allow a statistically significant assessment of Benfordness for these countries. Twenty-seven percent of the countries in scope showed full compliance with the law, followed by 69% (42 territories) that complied based on two measures of goodness-of-fit test. Most notably, 4% of the countries worldwide did not conform to Benford’s Law (see Figure 3). Thus, the null hypothesis can be rejected for these jurisdictions.
Compliance of countries reviewed at a glance.
Table 1 summarizes the results of the statistical analyses of the COVID-19 data worldwide. Table 1 portrays the frequency of the leading digit distributions for 154 countries. It is evident that the K-S and chi-square tests reveal similar patterns, while Euclidean distance statistics do not always flag anomalies in the distribution of first digits.
Results of the Benford’s leading digit distribution analysis.
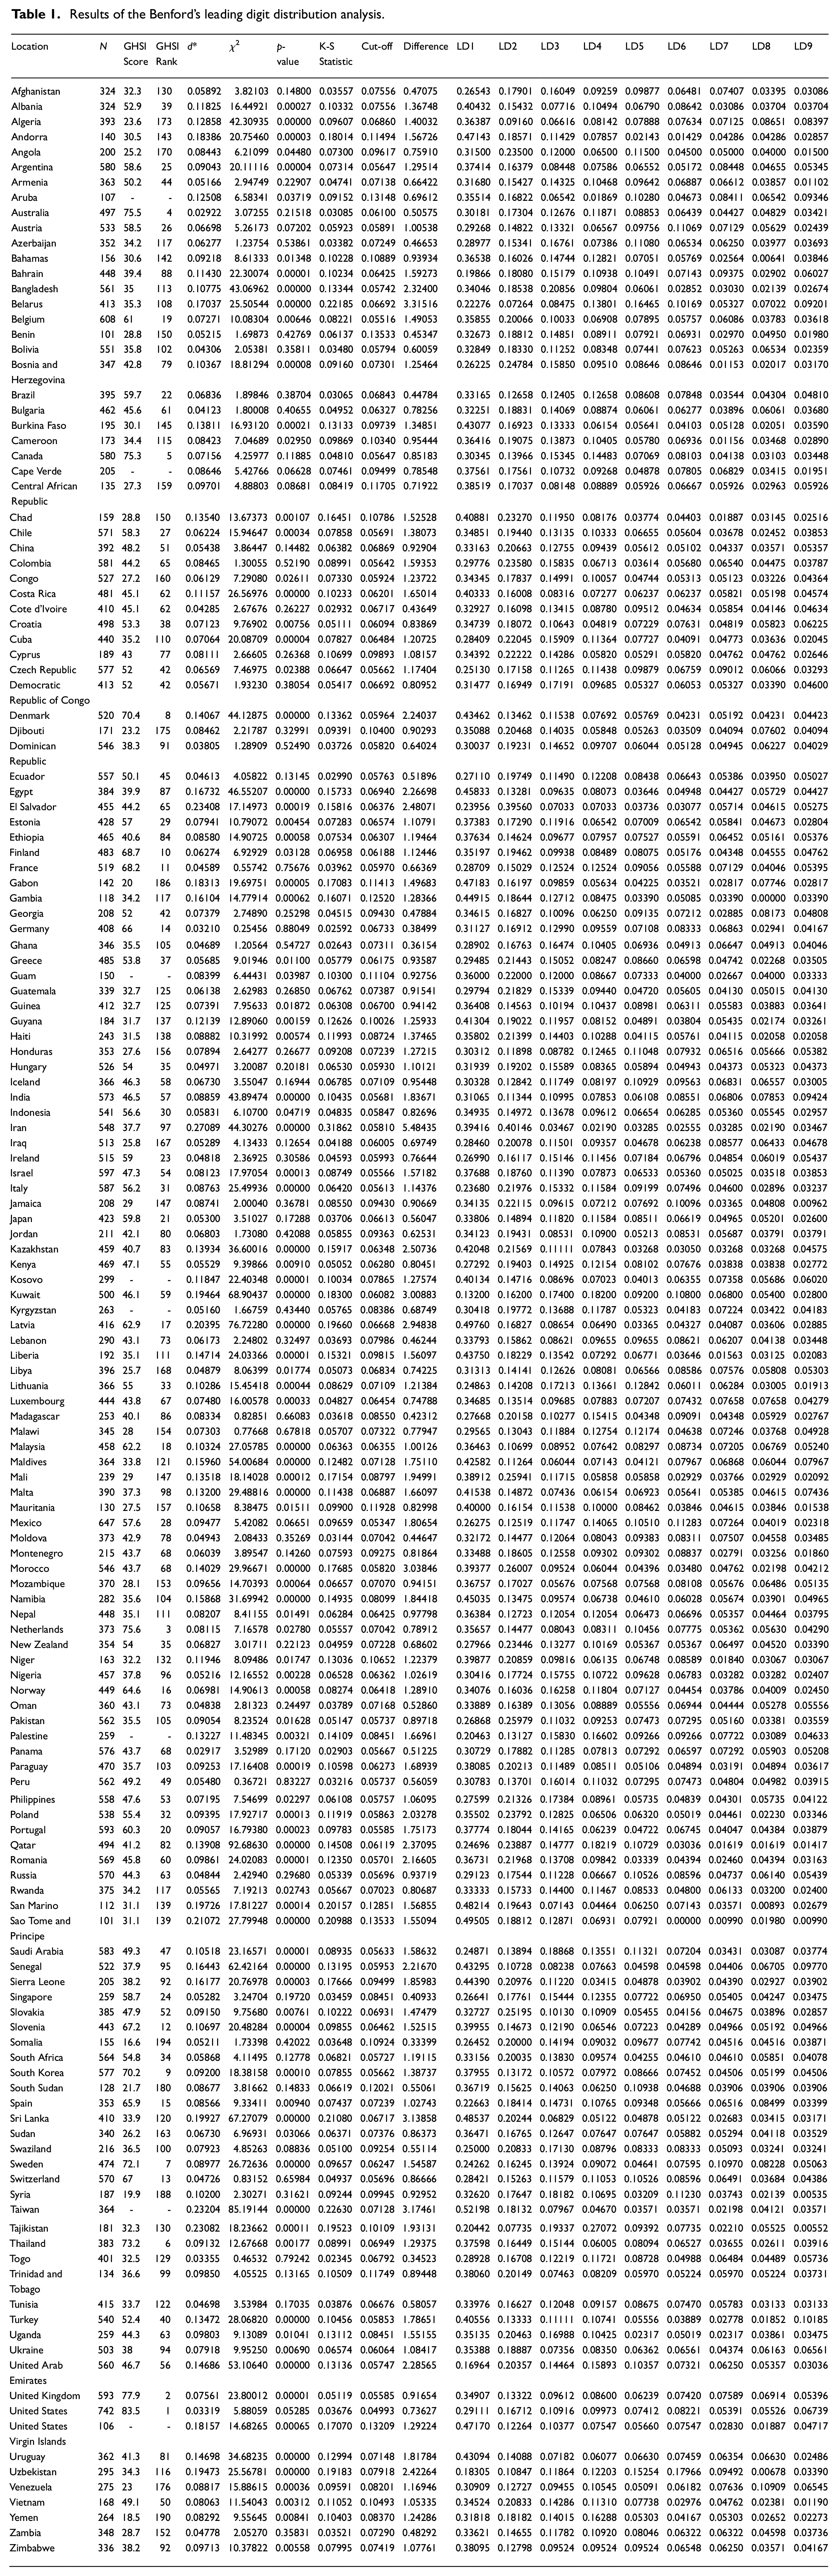
As stated earlier, the tests quantify the distance between the reported and referred distributions. According to the K-S statistics, the most substantial evidence for abnormalities with the law was found with Iran’s data, with a cut-off
Consequently, Iran also fails to meet the d*-factor/Euclidean distance requirements with a substantial result of 0.271. As suggested by Goodman, as well as Wie and Vellwock, a Euclidean distance with 0.25 or above indicates irregularities in the reported distribution. Notably, Iran shows by far the largest distance from the Benford distribution according to all statistical assessments, followed by Taiwan, Latvia, El Salvador, Tajikistan, and Sao Tome and Principe. These countries fail to confirm the null hypothesis based on all three goodness-of-fit tests. Some countries meet Benford’s expectations in all three tests, such as the United States, Germany, France, New Zealand, China, and Japan—followed by 35 other countries (see Figure 4).

Distribution of leading digits of Benford’s violators.
The Euclidean distance suggests compliance with Benford’s law for all nations, except for Iran, El Salvador, Latvia, Sao Tome and Principe, Taiwan, and Tajikistan. The chi-square and K-S statistics indicate that some countries do not conform to the first-digit distribution law, such as Denmark, Norway, and Sweden. Figure 2 illustrates the observed distributions of the top violators of Benford’s law.
To better visualize the results of the most compliant countries, see Figure 5, illustrating the countries that fully meet the requirements of the statistical tests.

Distribution of the first leading digits of compliant countries.
Conclusion
The author extended the sample size and related goodness of fit tests, as stated earlier. This approach has improved the quality of the analysis and, thus, the reliability of the findings in this study. According to the K-S statistic, Germany seems to disclose the most compliant data worldwide. Other countries obeying Benford’s law, such as China, the United States, and France, pass all goodness-of-fit tests applied in this study. These outcomes are, to some extent, in agreement with prior research.5–8
The records of cumulative infections and deaths from the United States, Japan, Indonesia, and most European nations adhere well to the law. Koch and Okamura came to a similar conclusion and also confirmed China’s compliance with the law. Furthermore, consistent with prior research, all European countries (with the exception of Latvia), demonstrate Benfordness by satisfying at least one of the goodness-of-fit tests. This is also the case with North and Latin American as well as Asia Pacific countries.
In contrast to Germany, the most significant irregularities concerning data compliance with the law occurred in the Islamic Republic of Iran, El Salvador, Latvia, Sao Tome and Principe, Taiwan, and Tajikistan. In other words, these countries do not provide reliable data on the COVID-19 epidemics since they do not pass all goodness-of-fit tests.
Notably, and in particular, Iran merits our attention since the Islamic Republic shows by far the largest distance to Benford’s distribution of leading digits—five times larger than expected. This is consistent with the WHO assessment in March 2020, suggesting that the number of cases reported by the Iranian authorities could represent only about a fifth of the real numbers in the early stages of the epidemic. 22 Our analysis, moreover, suggests that Iran reveals a persistent pattern for reporting questionable data within a large period. Iran was also crystallized out as an outlier in earlier studies. 7 In addition, the Islamic Republic was blatantly stated as demonstrating statistical inconsistencies during the growing outbreak in early 2020. The Washington Post published satellite pictures of mass graves for Coronavirus victims in Qom, the primary hub of Iran’s outbreak in 2020. 21 By looking at all records, one can recognize that Iran decided to report equally distributed leading integers starting with all first digits (see Figure 2).
Last but not least, the 2019 GHSI seems to partially explain why countries demonstrating overwhelming compliance with the law belong to the same groups in this study, such as Russia and Mali, flagged yellow or the United States and Germany, flagged green. Iran ranked 103 and Tajikistan 144 for early detection and reporting. Latvia, however, was placed second in the same benchmark after the United States and Australia and before Germany and France. 4 In a further attempt, Pearson product-moment correlation analysis was used to explore the relationship between the GHSI scores for early detection and reporting and the goodness of fit tests for all countries. Preliminary analyses were conducted to ensure no violation of assumptions of normality, linearity, and homoscedasticity. The author identified a moderate, negative partial correlation between the GHSI score and K-S statistic for all countries (r = −0.264, n = 154, p < 0.0005). This suggests that, at a moderate level, countries with a high GHS Index score are prone to report reliable COVID-19 data.
Contradictions with the law can be explained through artificially fabricated data. 20 They may pertain to varying national policies and limited abilities to detect and collect data on the spread of submicroscopic infectious organisms. For example, some nations may not have access to sufficient testing kits, as already reported by the WHO. 22
Future research
One cannot claim that lack of compliance with Benford’s law is always strong evidence for fraud. Our analysis did not investigate the formative indicators of incompliance with the natural distribution of leading digits. The most important question that emerges in our study is why countries report data with considerable inconsistencies with Benford’s law. To address this question, one shall further examine the social-economic conditions of those countries. Local authorities may have additional reasons for providing incompliant data on COVID-19, such as fearing a rise in opposition or a decline in inbound tourism.
Based on the key results of this paper, the author recommends establishing a global governance model and unifying measurement standards to examine better and review distributed statistics on the spread of any disease in the future. For the sake of reliability and accuracy in such extraordinary situations, having access to compliant data is vital in the fight against disastrous epidemics of potential international concern. To effectively protect people from pandemics and save lives globally, political will and global leadership appear to be essential for success.
Limitation
The author acknowledges a fundamental limitation in this study related to the statistical regime of Benfordness. The underpinning data collected from divergent regions and countries might not be comparable. They are generated based upon different public health systems and policy decisions, locally controlled and enforced by unaligned authorities. Small countries, mainly, may not possess the required capabilities and capacity to fully detect COVID-19 cases and precisely report the number of incidents.
Footnotes
Acknowledgements
The author sincerely thanks the editorial team and peer reviewers of this paper for critical review.
Declaration of conflicting interests
The author(s) declared no potential conflicts of interest with respect to the research, authorship, and/or publication of this article.
Funding
The author(s) received no financial support for the research, authorship, and/or publication of this article.