
Abstract
The springback directly affects the forming accuracy and quality of metal bent-tube, and accurate springback prediction is the key to the springback compensation and control. This paper investigates the springback of mandrel-less rotary draw bending (MLRDB) of circular metal tubes, and an innovative method, springback angle prediction considering the interference of cross-sectional distortion (IoCSD-SAP), is proposed. The digit decomposition condition variational auto-encoder generative adversarial network (D2CVAE-GAN) is developed to augment the data samples. Considering the nonlinear interference of the cross-sectional distortion on springback, auxiliary extended radial basis function (AE-RBF) is proposed. It establishes the mapping relationship between the characteristic parameters and cross-sectional distortion. By extracting the information encode of cross-sectional distortion as the condition input, this model realizes the condition prediction of springback angle. Taking MLRDB of 6060-T6 Al-alloy circular tube as a case study, the proposed method, IoCSD-SAP, is verified. According to the experimental results, the mean absolute percentage error (MAPE) for the springback angle of our proposed method is 4.73%, and three different analytical models are 38.92%, 14.39%, and 14.22%, respectively. It can be seen that our proposed method significantly improves the prediction accuracy of springback angle. For the springback angle prediction of circular metal tube in MLRDB, the data augmentation can effectively reduce the generalization error and improve the prediction accuracy. The nonlinear interference of the cross-sectional distortion on springback should be taken into account to improve the accuracy and robustness of the springback prediction model.
Keywords
Introduction
The metal bent-tubes are widely used in aero engines, ship steam turbines, etc. 1 The complex bending process of metal tubes, the compact layout of the pipeline and the high assembly accuracy of tubes put high requirements on the bending process of tubes. NC mandrel-less rotary draw bending (MLRDB) is currently a commonly used bending method of metal tubes. When the load is removed, the shape of the tube will partially recover and the springback inevitably occurs. The actual geometric dimensions of bent-tubes deviate from the design requirements, directly affecting the forming accuracy and quality of the metal tube. Therefore, the accurate springback prediction of the metal bent-tube is the key to the compensation and control of springback in MLRDB. Experts and scholars have carried out a lot of research in the analysis of springback factors, springback mechanism and law, and springback prediction.
The main factors affecting the springback include the mechanical properties of material, the forming process parameters, etc. Jiang et al. 2 and Li et al. 3 revealed the effect of the the material properties and the forming parameters on the springback. Zhu et al. 4 and Zhang et al. 5 studied the sensitivities of process and material parameters on the springback and the section deformation. Wu et al. 6 investigated the influences of temperature, bending velocity and original grain size on the bendability of tubes.
Regarding the springback mechanism and law of metal bent-tubes, Gu et al. 7 and Zhan et al. 8 revealed the springback mechanism of thin-walled tube using numerical simulation. Clausen et al., 9 Miller et al., 10 Corona, 11 and Zhu and Stelson 12 investigated the influence of loading path, friction, tensile force on the deformation, and springback of rectangular tube.
Through theoretical calculation, an analytical model can be established to predict the springback of metal bent-tube. Al-Qureshi and Russo 13 derived an analytical model for predicting springback behavior and residual stress distribution. Zhan et al. 14 proposed a numerical-analytic method to analyze the springback mechanism of the tube bending. El Megharbel et al. 15 and Daxin and Chen 16 derived the numerical formula to calculate springback angle based on exponential hardening law. Wu et al., 17 Zhang et al., 18 and Zhang and Wu 19 developed the analytical model for springback of 3D tubes. Liu and Daxin 20 and Zhu et al. 21 established the theoretical analysis model of springback angle by taking sectional deformation into consideration. Li et al. 22 and Zhan et al. 23 established the analytical model for springback prediction considering neutral layer shift.
The analytical models can cause large error because of simplifications and assumptions. Therefore, researchers used surrogate model to predict springback. Liu et al., 24 Katayama et al., 25 Zeng et al., 26 and Han et al. 27 used the response surface method to predict the springback of metal sheet. Kazan et al. 28 used artificial neural network to develop the prediction model of springback. Baseri et al. 29 proposed a new fuzzy learning back-propagation algorithm to predict the springback. Narayanasamy and Padmanabhan 30 compared the regression and neural network modeling for predicting springback of steel sheet.
The above researches have made progress in the analysis and prediction of springback, which helps to improve the accuracy and quality of metal bent-tubes. However, the metal bent-tubes have the characteristics of mini-batch and multi-type, resulting in low springback prediction accuracy. The cross section of the metal tube will be distorted during the bending process, and the cross-sectional deformation have a complex effect on springback. The existing methods cannot fully consider the nonlinear interference of cross-sectional distortion on springback, which limit the accuracy and efficiency of springback prediction.
Problem description
Elastoplastic deformation occurs in the process of MLRDB of circular metal tubes. The deformation distribution is uneven along the thickness of the tube and the direction of the bending line, as shown in Figure 1(a). When the load is removed, the elastic strain energy is released, and the volume and shape of the bent-tube are partially restored. Springback inevitably occurs, so that the bending angle of bent-tube decreases and the bending radius of bent-tube increases, as shown in Figure 1(b). In this figure, R and

Sketch of NC mandrel-less rotary draw bending of the circular metal tube: (a) before springback and (b) after springback.
As can be seen from Figure 1, the inner and outer contours of the cross section of the circular metal bent-tube bending area have different degrees of flattening deformation. The degree of flattening is unevenly distributed along the direction of the bending line. The complex cross-sectional distortions occur in the process of bending. In the figure, d and
Data augmentation method based on D2CVAE-GAN
The metal bent-tubes have the characteristics of mini-batch and multi-type, and the number of samples used for springback prediction could be small. It leads to low accuracy of springback prediction. Therefore, the data augmentation method is applied to enlarge the number of training data samples and increase the data diversity, thus reducing the generalization error of the springback angle prediction model and improving the prediction accuracy.
Conditional variational auto-encoder generative adversarial networks (CVAE-GANs) 31 consists of four components: Encoder network (E), Generator network (G), Classifier network (C), and Discriminator network (D). By combining variational auto-encoder and generative adversarial networks, CVAE-GANs uses discrete class labels of samples to achieve conditional generation, which can generate real and diverse data samples.
Considering that the springback angle and cross-sectional distortion rate of data sample have continuous numerical properties but are not characterized by discrete categories, the proposed data augmentation model, digit decomposition condition variational auto-encoder generative adversarial network (D2CVAE-GAN), makes two improvements on the basis of the original CVAE-GANs. This model applies the continuous response value (springback angle or cross-sectional distortion) of the data sample to achieve conditional generation, thus improving the quality of the generated samples. The framework of D2CVAE-GAN is shown in Figure 2. The two improvements are as following: (1) replace the original Classifier network with a Predictor network (P), which predicts the response value of the given sample; (2) replace the original category label

Framework of D2CVAE-GAN. The model contains four components: Encoder network, E; Generator network, G; Discriminator network, D; Predictor network, P.
In order to use the continuous response value of data samples as one of the inputs of encoder and generator, a digit decomposition coding method is developed to encode the response value. As shown in Figure 2, the coding process of this method includes the following steps: (1) decompose the response value of the given sample into an integer and n decimal values. The number of decimal values n depends on the accuracy of the response value; (2) take the integer value and n decimal values obtained by decomposition as the corresponding integer place label and n decimal place labels, respectively; (3) encode the decimal place labels separately and then take the average of these codes as the decimal place code; (4) encode the integer place label and take the code as the integer place code; (5) multiply the integer place code and the decimal place code of the given sample, and take the element-wise product result as the code of the response value of given sample. According to the accuracy requirement of springback angle and cross-sectional distortion of bent-tubes, n is set as 4.
Based on the digit decomposition coding method, the code of the continuous response value of given sample can be expressed as:


where
For a given sample, Encoder network outputs the mean and covariance of the latent vector corresponding to the sample. In order to reduce the gap between the prior distribution of the latent vector and the distribution of training samples, the KL divergence is applied as the loss function of Encoder network. That is:


where
According to

where
Predictor network outputs the response value for a given sample, thus minimizing the

where
Discriminator network distinguishes whether a given sample is real or generated, thus minimizing the following loss function to train it.

where
In order to make the training process of Generator network more stable, mean feature matching and pair-wise feature matching are used, thus minimizing the following loss function to train it.


where
Therefore, the training goal of D2CVAE-GAN is to minimize the following loss function:

where
Springback angle prediction method based on AE-RBF
Springback angle prediction process
To predict the springback angle of circular metal bent-tubes in MLRDB, the method, springback angle prediction considering the interference of cross-sectional distortion (IoCSD-SAP), is proposed. Considering the nonlinear interference of cross-sectional distortion on springback, the Taguchi method, finite element (FE) simulation, analysis of variance (ANOVA), the developed D2CVAE-GAN and auxiliary extended radial basis function (AE-RBF) model are integrated to realize the credible prediction of springback angle of circular metal bent-tube in MLRDB. The Taguchi method for design of FE simulation experiment is utilized to organize orthogonal experiments, thus effectively reducing the number of experiments. The FE simulation obtains the springback angle and cross-sectional distortion of the circular metal bent-tube. ANOVA is applied to identify the most important factors related to the springback and cross-sectional deformation. D2CVAE-GAN is developed to realize the data augmentation. It enlarges the training samples to reduce the generalization error of the springback angle prediction model. AE-RBF is developed to predict the springback angle. This model establishes the mapping relationship between the impact factors and cross-sectional distortion, and expresses the features of different levels of cross-sectional distortion. By extracting the information encode of cross-sectional distortion as the condition input of the springback angle prediction, this model realizes the condition prediction of springback angle and improved the prediction accuracy. The prediction process of the springback angle of circular metal bent-tube in MLRDB is shown in Figure 3.

Flowchart of the springback angle prediction.
It can be seen from Figure 3 that the main steps of springback angle prediction include the acquisition and processing of the data samples obtained by FE simulations, data augmentation, and springback angle prediction. The specific process can be described as:
Step 1: Identify the parameters that have an influence on the springback and sectional deformation as design variables, and determine the value range.
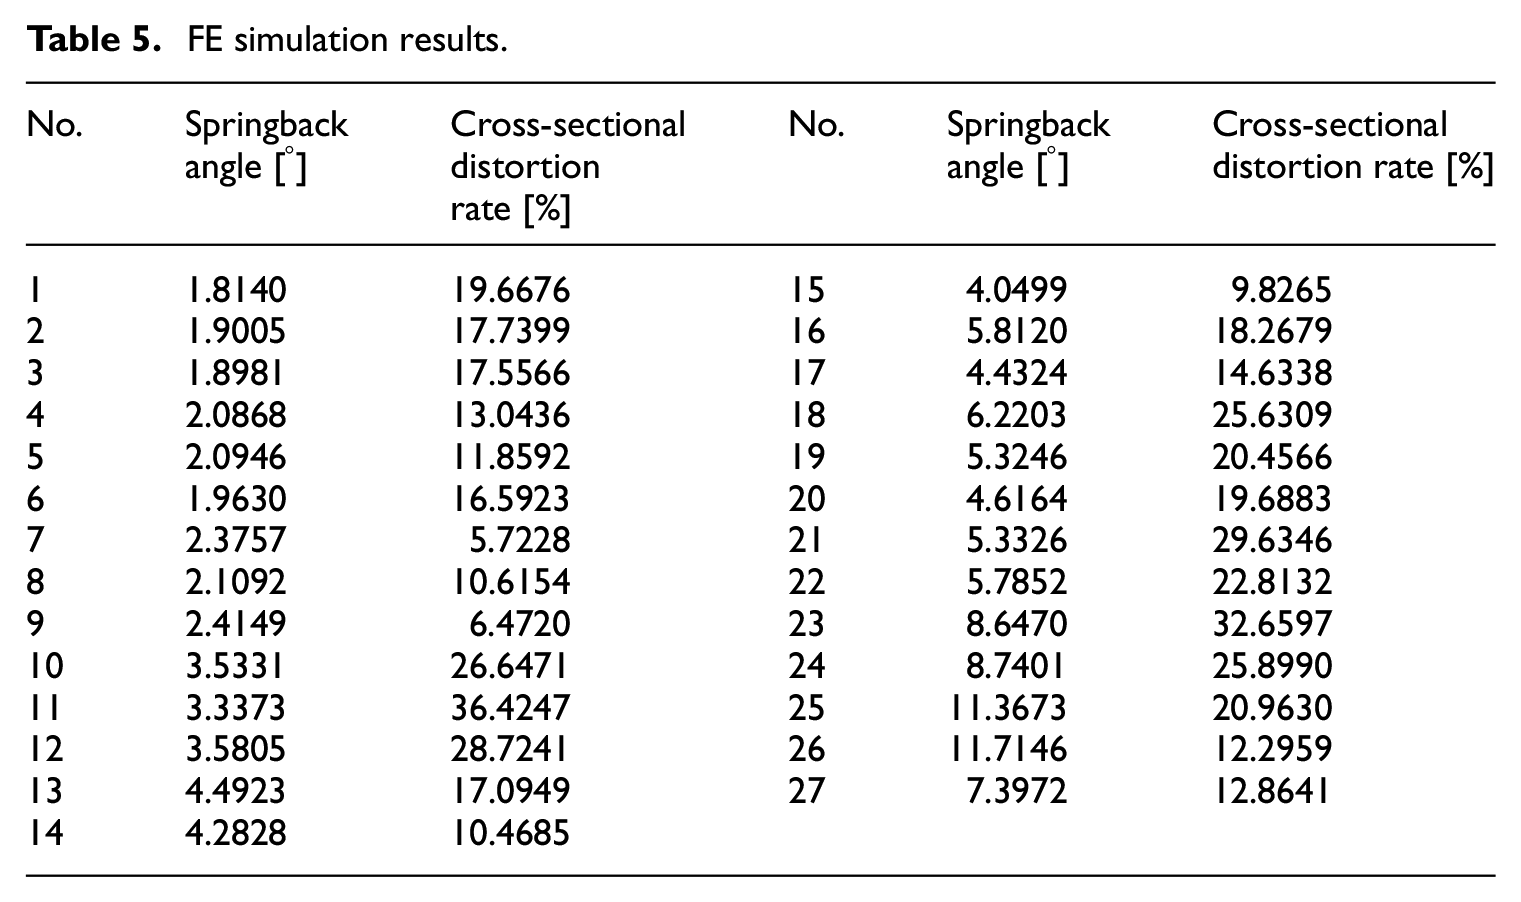
Step 2: Apply the Taguchi method to execute the design of FE simulation experiment, and conduct FE simulations to obtain the springback angle and cross-sectional distortion rate of the bent-tube.
Step 3: Analyze the data samples obtained by FE simulations through ANOVA. Identify the important design variables that have significant impact on springback angle and cross-sectional distortion rate, and determine the input features of data augmentation and springback angle.
Step 4: Data augmentation. Taking the data samples obtained by FE simulations in Step 2 as training samples, construct and train the D2CVAE-GAN model, and then generate samples in the same distribution as the original data samples obtained by FE simulations. In the training process, the mini-batch learning method is adopted, and the parameters of each component are updated in the order of predictor, discriminator, generator, and encoder.
Step 5: Springback angle prediction. Taking the augmented data samples (the mixed samples of original samples obtained by FE simulations and generated samples) as training samples, construct and train the AE-RBF model. This model is applied to predict the springback angle, which consists of two components, an encoder and a predictor. Considering the nonlinear interference of cross-sectional distortion on springback, the process of realizing the springback angle prediction includes: (1) encoding process of cross-sectional distortion information of circular metal bent-tube based on the encoder; (2) prediction process of springback angle of circular metal bent-tube based on the predictor.
Step 5.1: Encoding process of cross-sectional distortion information. Construct and train the encoder, which establishes the mapping relationship between the input parameters and cross-sectional distortion. It can identify the features of cross-sectional distortion at different levels, and express the information of cross-sectional distortion at different granularity.
Step 5.2: Prediction process of springback angle. Construct and train the predictor, which predicts the springback angle. The parameters of the encoder are frozen, and the code of cross-sectional distortion information is extracted through the encoder. The conditional prediction of springback angle can be realized by taking the extracted code as the condition input of the predictor.
Encoding of cross-sectional distortion information
For the pure bending of power-hardened tubes, the springback angle

where M and I respectively represent the bending moment and cross-sectional moment of inertia of the bending section; R is the bending radius;
If the interference of cross-sectional distortion is not considered, the bending moment M and the cross-sectional moment of inertia I in equation (13) are expressed as:


If the interference of cross-sectional distortion is considered but its non-uniformity along the bending line is not considered, the bending moment M and the cross-sectional moment of inertia I in equation (13) are expressed as:


In comparison with equations (14)∼(17), the change of the cross-sectional shape of the bent-tube can directly affect the bending moment and the cross-sectional moment of inertia during the springback process. It can cause errors in the analysis and prediction of springback angle.
According to theoretical analysis to establish the analytical model for springback angle prediction, the bent-area of tube is discretized into a plurality of uniformly distorted micro-tubes, and the cross section of each micro-tube is simply approximated as an ellipse. In this way, when considering the nonlinear interference of cross-sectional distortion on springback, there are assumptions and simplifications, and the nonlinear interference of cross-sectional distortion cannot be accurately expressed.
In order to express the nonlinear interference of cross-sectional distortion on springback more accurately, the cross-sectional distortion information is encoded, as shown in Figure 4. In this figure, the encoder establishes the mapping relationship between the input feature parameters (bending angle, relative bending radius, relative wall thickness, friction coefficient between bending die and tube, friction coefficient between wiper die and tube, clearance between wiper die and tube, relative boosting velocity) and cross-sectional distortion rate. It can identify the feature of cross-sectional distortion at different level, thus expressing the information of cross-sectional distortion at different granularities.

Encoding process of cross-sectional distortion information based on the encoder component of AE-RBF model.
Back Propagation Neural Network (BPNN) with four-layer network architecture is used as the encoder, which consists of one input layer, two hidden layers and one output layer, as shown in Figure 4. The input layer contains seven nodes, which respectively correspond to the input feature parameters of the training samples. The parameters are bending angle, relative bending radius, relative wall thickness, friction coefficient between bending die and tube, friction coefficient between wiper die and tube, clearance between wiper die and tube and relative boosting velocity. The two hidden layers contain
Using the


where
The more times the neural network layer is processed the finer the recognized features and the richer the information expressed. Therefore, the output of the second hidden layer is extracted as the code of cross-sectional distortion information. The code can be expressed as:

where
Springback angle prediction based on E-RBF
Considering the nonlinear interference of cross-sectional distortion on springback, the feature vector of the cross-sectional distortion information is extracted as the condition input of the springback angle prediction, as shown in Figure 5. In this figure, the parameters of the encoder are frozen, and the code

Prediction process of springback angle based on the predictor component of AE-RBF model.
Extended radial basis function (E-RBF) 32 is used as the predictor, which uses a combination of radial basis functions (RBFs) and non-radial basis functions (N-RBFs) to build. Compared with the classic radial basis function (RBF), E-RBF makes the meta-modeling process more flexible in various complex engineering applications, avoids unique solvability, and is more adaptable under widely varying conditions.
N-RBFs is composed of three distinct components:


where
Non-radial basic function.

E-RBF model is the linear combination of RBFs and N-RBFs, and defined as:

where
Gaussian function is selected as the radial basis function, which can expressed as:


where r is the Euclidean distance;
Using the

where
Experimental design
FE simulation model
Taking 6060-T6 Al-alloy circular tube as a case study, its mechanical properties are shown in Table 2. The mechanical properties of 6060-T6 Al-alloy are derived from the public webpage and published literature.33,34 The plastic stress-strain response of the alloy 6060-T6 for the major part of the fatigue life has been investigate in Borrego et al.
34
Based on the monotonic and cyclic stress-strain curves presented in Borrego et al.,
34
the exponent hardening law as
Mechanical properties of 6060-T6 Al-alloy circular tube.

The 3D FE models for the MLRDB of the circular 6060-T6 Al-alloy tube is shown in Figure 6. The tube is defined as a 3D deformable shell body, and the dies are defined as discrete rigid bodies. The tube material is an isotropic, homogeneous, and rate independent material. The 3D linear reduction integration continuum elements with eight nodes (C3D8R) are used to mesh the shell of the tube, and the dies are meshed by 3D bilinear rigid quadrilateral elements with four nodes (R3D4). The global seeds are used to mesh the tube and dies. The sizing controls for the global seeds are as follows: the approximate global size is 2 mm; the maximum deviation factor of the curvature control is 0.03 which means that the approximate number of elements per circle is 26 when the outer diameter of the tube is 10 mm; the minimum size controlled by fraction of global size is 0.1.

The FE models of MLRDB of circular metal tube: (a) bending forming model and (b) springback of bent-tube.
The “surface-to-surface contact” method is used to define the interaction between the tube and the dies. The “penalty contact method” is used to describe the mechanical constraints formulation, and the “finite sliding” is used to describe the sliding formulation for all contact pairs. The “penalty” is applied to describe the friction formulation of the contact property between the tube and the bending die, pressure die and wiper die, while the “rough” is applied between the tube and the clamp die. The “beam connection” is used to define the connection between the bending die and clamp die and the “kinematic coupling” method is used to define the constraint between the tube and clamp die, where all degrees of freedom are constrained to ensure the synchronous movement between the tube, clamp die and bending die. The “displacement/rotation” and “symmetry/antisymmetry/encastre” conditions are applied to define the boundary conditions, which can simulate the actual mandrel-less rotary draw bending process. As shown in Figure 6, the bending die is constrained to rotate along the global Z-axis, while the pressure die is constrained to translate only along the global X-axis. The “Encastre” condition is used to constrain the wiper die, which is constrained along all degrees of freedom. For the rotation of the bending die and the translation of the pressure die, the smooth step amplitude curves, which describe the change of the velocity with time, are defined to ensure little inertial effects.
After the bending analysis is finished, the results from the bending simulation in Abaqus/explicit are imported into Abaqus/standard to implement springback analysis. In the static implicit analysis of the springback, all dies and corresponding interactions are removed. The “predefined field,” which is imported from the result of bending analysis, describes the stress state of the bent-tube before springback and is used to define the initial state of the tube. The “Encastre” boundary condition is used to constrain the rigid motion of the tube in the springback process, which is applied at the end away from the bent area of the bent-tube. In addition, the “specify damping factor” is used to stabilize the implicit iteration procedures of the springback analysis.
Design of simulation experiment
The Taguchi method is used in the design of FE simulation experiment to collect the data samples. The springback and cross-sectional distortion of the metal tube with specific material are influenced by factors such as geometric parameters and process parameters. Thus, the bending angle (
The bending of tube is completed under the constraint of dies. The long axis of the cross section of tube changes little because of the limitation of the groove of the bending die. In addition, the ellipse change rate is a comparison parameter and cannot accurately describe the real situation of the cross-sectional distortion. Therefore, the change rate of the short axis is used to measure the cross-sectional distortion of bent-tube.
The degree of cross-sectional distortion is the largest and evenly distributed along the bending line in the middle section of the bent-tube. Therefore, the average of the short axis change rate of the cross-sectional inner and outer contours at the center of the bent-tube bending area is calculated as the cross-sectional distortion rate of the bent-tube.
According to the selected of design variables, the settings of orthogonal experimental level for each design variable are shown in Table 3. The orthogonal array table is
Impact factors and level of Taguchi DOE.

Orthogonal array table.

FE simulation results.
Configuration of practical experiment
In the practical experiments, the material, outer diameter, and wall thickness of the circular metal tube are 6060-T6 Al-alloy, 10 mm, and 1.7 mm respectively; the bending device is A89CNC tube bender, as shown in Figure 7.

The practical experimental machine and material: (a) bent-tube and (b) A89CNC tube bender.
Results and discussion
Impact factors analysis of springback
The ANOVA can determine the most important design variables that have a significant impact on the selected response features to simplified the input of D2CVAE-GAN and AE-RBF. The results of ANOVA for springback angle and cross-sectional distortion rate are shown in Tables 6 and 7, respectively. The results are obtained by a statistical software, SPSS 21.0.
ANOVA result of springback angle.

ANOVA result of cross-sectional distortion rate.
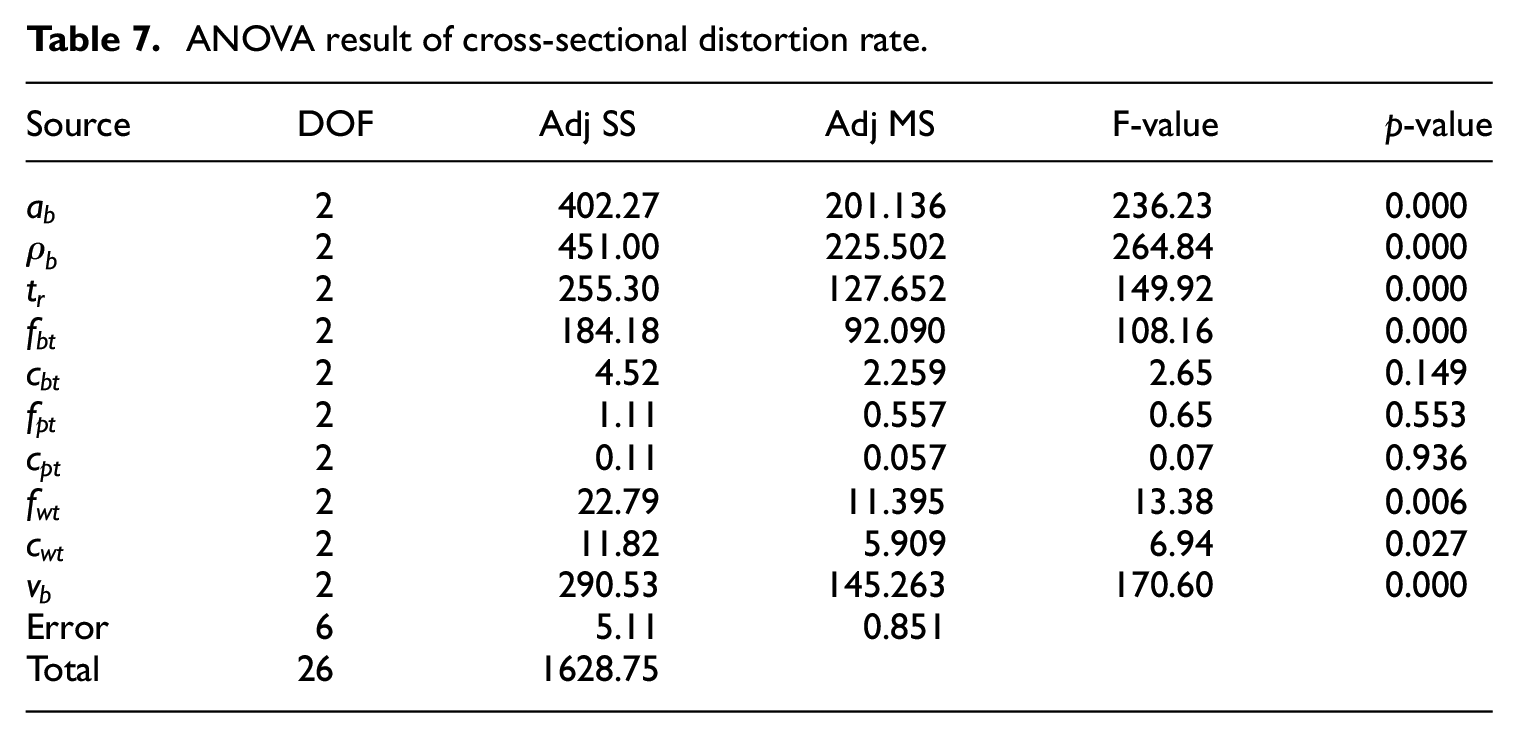
According to ANOVA, the following conclusions can be drawn: when p-value is less than or equal to 0.01, the corresponding design variable has an extremely significant effect on the response; when p-value is greater than 0.01 and less than or equal to 0.05, the corresponding design variable has a significant effect on the response; and, when p-value is greater than 0.05, the corresponding design variable has no significant effect on the response.
The results in Table 6 show that
The results in Table 7 show that
Because the proposed method takes the nonlinear interference of cross-sectional distortion on springback into account, the design variables that have a great influence on springback or cross-sectional distortion should be chosen. The bending angle (
Data augmentation of springback
Based on the results of ANOVA and data samples obtained by FE simulations, the data augmentation model D2CVAE-GAN is constructed and trained. The trained model receives a hundred data samples which randomly sampled from standard normal distribution as its input, and then generates data samples as shown in Table 8.
Generated samples.

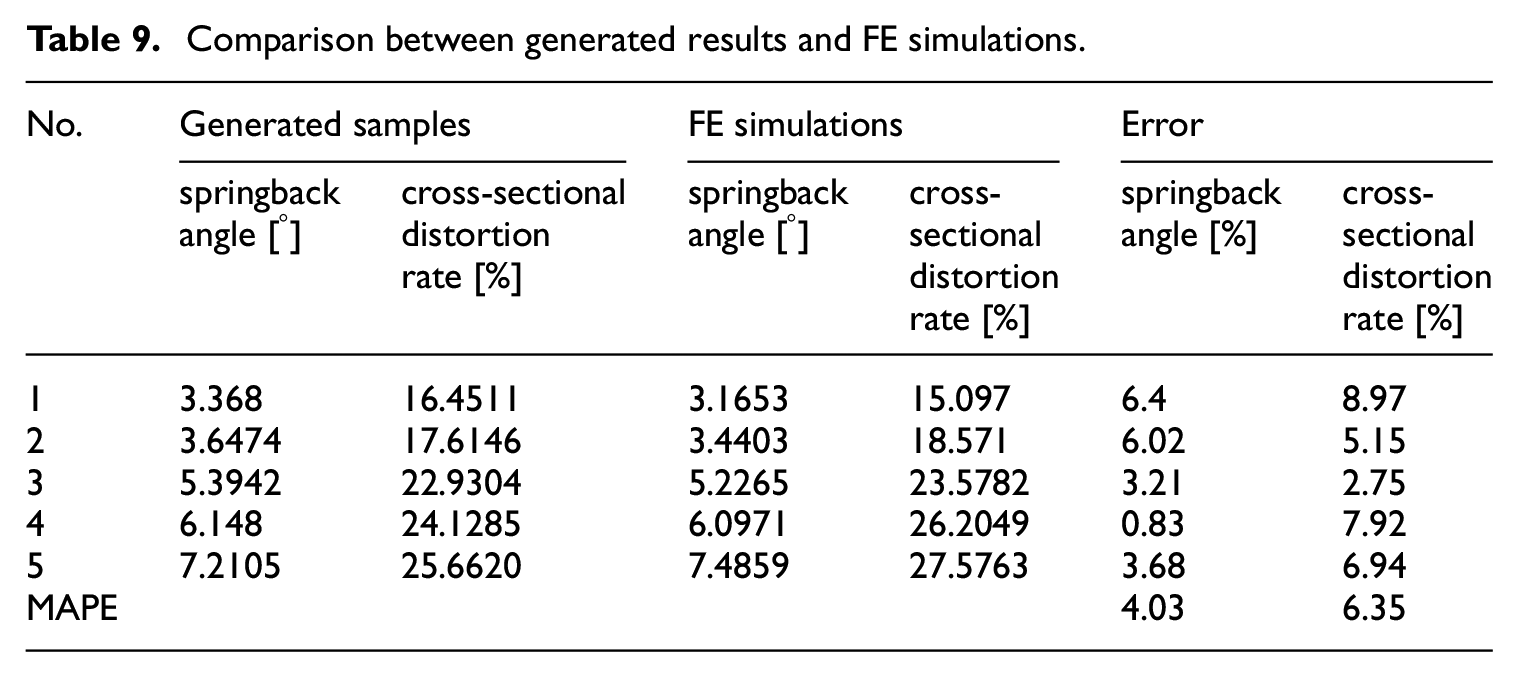
To verify the authenticity of the generated data samples, five data samples in Table 8 are selected to conducted FE simulations. The comparison between simulation results and generated results of the selected samples are shown in Table 9 and Figure 8. The mean absolute percentage error (MAPE) 36 is used to measure the accuracy of the generated responses, which is the average of the absolute percentage errors. The MAPE of the springback angle and cross-sectional distortion rate are 4.03% and 6.35%, respectively, both of which are controlled below 10%. Not exceeding 10% margin of error indicates that the results are quite rational. 37 Therefore, the generated data samples are credible.
Comparison between generated results and FE simulations.

Response values comparison between generations and FE simulations: (a) springback angle and (b) cross-sectional distortion rate.
To evaluate the distribution consistency between generated samples and original data samples obtained by FE simulations, the proposed model D2CVAE-GAN is compared with three other widely used generative methods: autoencoder, 38 variational autoencoder (VAE) 39 and generative adversarial networks (GANs). 40 The comparison results are shown in Figure 9, and this figure shows the distributions in the two-dimensional feature space. In this figure, red lines and green lines represent features of the original simulation samples distribution and the generated samples distribution, respectively. The solid lines correspond to the same feature, and the dashed line correspond to the other same feature.

The comparison between the distribution of generated samples and the distribution of original simulation samples in two-dimensional latent space: (a) D2CVAE-GAN, (b) autoencoder, (c) VAE, and (d) GANs.
The mean distance and the relative error of KL divergence are used to measure the distribution consistency. The mean distance is the Euclidean distance between the mean vectors of two distribution. The relative error of KL divergence is the relative error of the KL divergence of the generated sample distribution to the KL divergence of the original simulation sample distribution. As shown in Figure 9, it can be found that the distribution of samples generated by D2CVAE-GAN is more consistent with the distribution of original simulation samples compared with other three models.
Experimental verification of springback prediction
To verify the prediction accuracy of the proposed prediction model AE-RBF, the predicted results of springback angle are quantitatively compared with FE simulation results and practical experimental results, as shown in Table 10. The MAPE of predicted results to FE simulation results and practical experimental results are 5.07% and 4.73%, respectively. FE simulation results are close to practical experimental results. Considering the processing and measurement errors, the predicted results can meet the requirement of prediction accuracy, which can verify the effectiveness of our proposed prediction model.
Experimental results and prediction errors.

In addition, the following four methods are used to predict the springback angle of the samples: (1) D2CVAE-GAN + AE-RBF; (2) D2CVAE-GAN + E-RBF; (3) AE-RBF; (4) E-RBF. The predicted results given by the above four methods are compared with the results of practical experiments and FE simulations, as shown in Figure 10.

Method Comparison about the prediction accuracy and performance: (a) D2CVAE-GAN + AE-RBF, (b) D2CVAE-GAN + E-RBF, (c) AE-RBF, and (d) E-RBF.
In Figure 10, red points represent the observations of practical experiments in Table 10 and blue points represent the observations of FE simulations in Table 4. In the left subfigure of Figure 10(a) to (d), black lines indicate that prediction equals to true value, so that the closer the observation point is to the black line, the higher the prediction accuracy. In the right subfigure of Figure 10(a) to (d), black dash lines indicate that the difference between the prediction and true value equals to zero, so that the observation points are evenly distributed on both sides of the black dash line and the closer the distance from the black dash line, the better the performance of the prediction model. By comparison, AE-RBF has higher prediction accuracy and more robust prediction performance combined with D2CVAE-GAN.
Comparison of springback prediction methods
Based on the practical experiments in Table 10, our proposed method is compared with three different analytical models.13,16,20 The comparison results are shown in Table 11 and Figure 11.
Springback angle prediction models comparison.

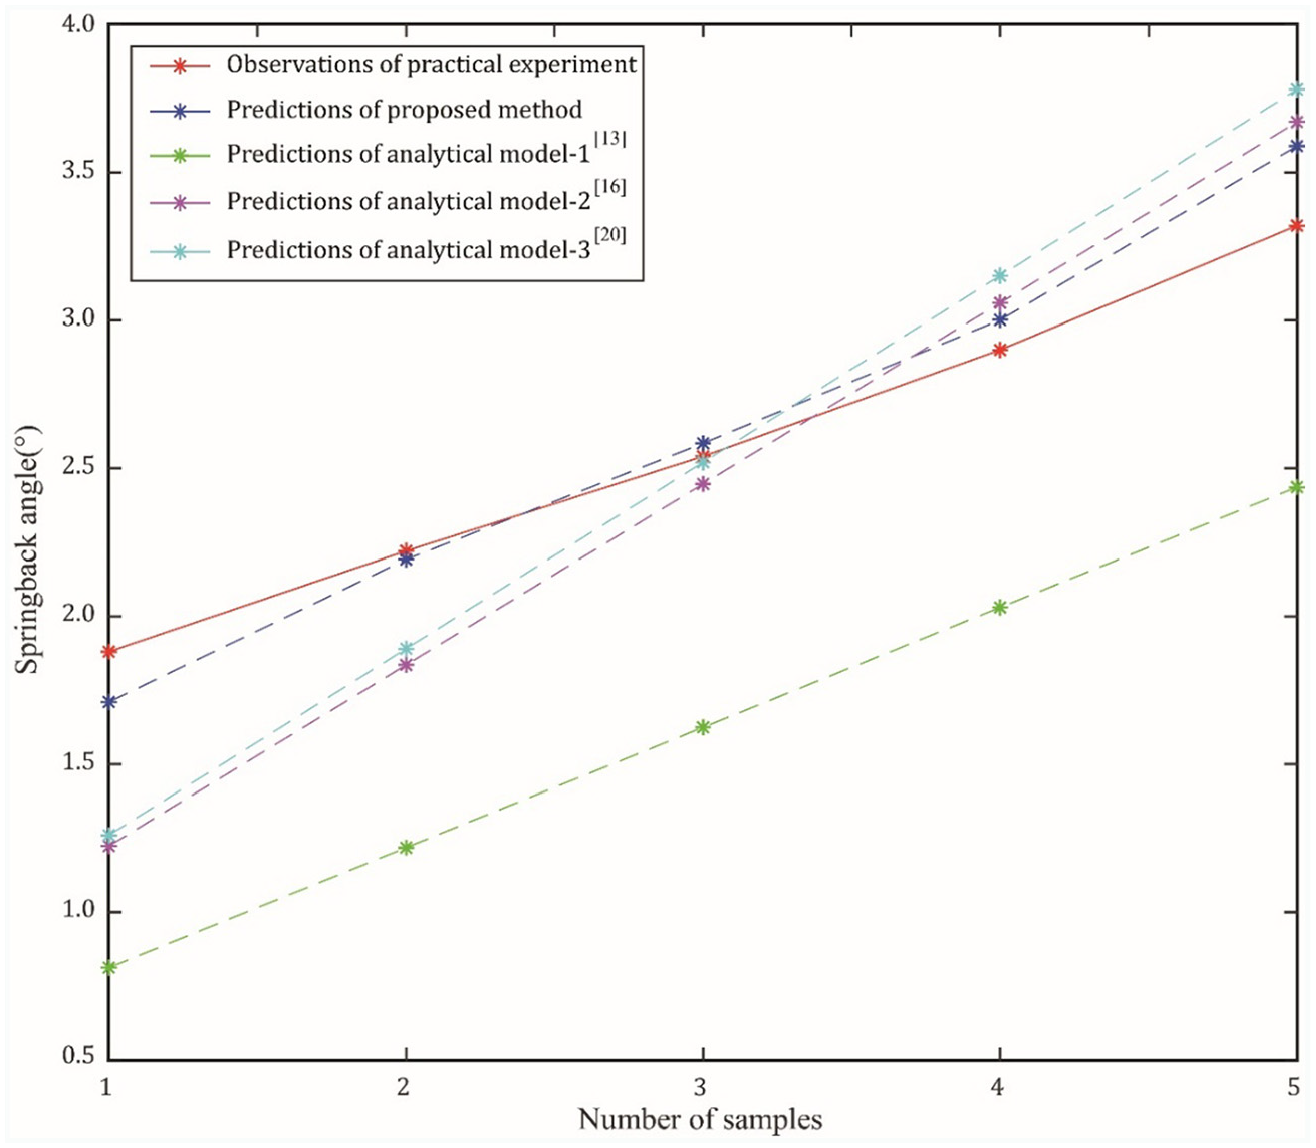
Springback angle comparison between experiments and predictions.
It can be seen that the MAPE of the proposed model is 4.73%, and the MAPE of three different analytical models13,16,20 are 38.92%, 14.39%, and 14.22%, respectively. Therefore, the prediction accuracy of our proposed method is much higher than the analytical models13,16,20 listed in Table 11.
Conclusion
For the springbakc angle prediction of the MLRDB of the circular metal tube, we propose a springback angle prediction method considering the interference of cross-sectional distortion (IoCSD-SAP). The conclusions are as follows:
(1) D2CVAE-GAN model realizes the data augmentation and enlarges the size of the training samples for springback angle prediction by generating data samples at the same distribution as original simulation samples. It can effectively reduce the generalization error and improve the prediction accuracy of the springback angle prediction model. In addition, the proposed digit decomposition coding method encodes the continuous response value of the data sample. It makes full and reasonable use of the response value of data samples during the condition generation process of D2CVAE-GAN, thus effectively improving the authenticity and credibility of the generated samples.
(2) The proposed prediction model AE-RBF consists of two components: the encoder and the predictor. The encoder encodes the cross-sectional distortion and expresses the distortion features at different levels and the distortion information at different granularities. The predictor predicts the springback angle of the circular metal tube. This model considers the nonlinear interference of cross-sectional distortion on springback, and realizes the conditional prediction of springback angle through taking the information encoding of the cross-sectional distortion extracted by the encoder as the condition input of the predictor.
(3) The MAPE of springback angle and cross-sectional distortion of the samples generated by D2CAVE-GAN are 4.03% and 6.35%, respectively, both of which are controlled below 10%. The effectiveness of the data augmentation model D2CVAE-GAN can be verified. Compared to three widely used generative models (Auto-encoder, VAE and GANs), the distribution of the samples generated by D2CVAE-GAN are more consistent with the distribution of the original simulation samples. Combined with D2CVAE-GAN, the MAPE of our proposed springback angle prediction model AE-RBF for springback angle is 4.73%, and the MAPE of three different analytical models13,16,20 are 38.92%, 14.39%, and 14.22%, respectively. The prediction accuracy of AE-RBF can reach 3∼8 times of the enumerated analytical models. The effectiveness of our springback angle prediction method IoCSD-SAP can be verified.
Footnotes
Declaration of conflicting interests
The author(s) declared no potential conflicts of interest with respect to the research, authorship, and/or publication of this article.
Funding
The author(s) disclosed receipt of the following financial support for the research, authorship, and/or publication of this article: This work has been funded by the National Key R&D Program of China (No. 2019YFC1511502) and the National Natural Science Foundation of China (No. 51875516).
Data availability statement
The data used to support the findings of this study are included within the article.