
Abstract
Vertical screw conveyors are used widely in industry for elevating bulk materials over relatively short distances, but the problem of insufficient feeding and low conveying efficiency always exist in the vertical conveying process. In this paper, a vertical screw conveyor with variable screw section is presented, and the characteristics of vertical screw conveyor are investigated under the variable screw sections using discrete element method (DEM). The results show that the particle volume fraction in the inlet and the mass flow rate increase in the condition of variable screw section, and the screw rotational speed has a significant influence on mass flow rate. It is evident that the design of variable screw section provides an effective way in improving the particle feeding rate and the conveying efficiency.
Introduction
Bulk materials widely exists in industrial production, that is, grain, coal, metal ore. The vertical screw conveyor is a kind of continuous conveying equipment, which is used for transporting all kinds of powder, granule, and lump materials with high efficiency, small pollution and saving space. It consist of a screw flight, a screw shaft connected to a driving device, a cylindrical casing, and so on. Despite its structure simplicity, the mechanics of the conveying progress is very complex and the vertical screw conveyor design relies heavily on empirical performance data. 1
Many scholars have made theoretical research on particle conveying of vertical screw conveyor. Roberts 2 analyzed the granular vortex motion of the enclosed vertical screw conveyor theoretically, and an expression for volumetric efficiency was obtained. Rademacher 3 studied the effect of conveying section and inlet section on delivery capacity by theoretical derivation. Evstratov et al. 4 theoretically established an applicable model of granular flow movement in vertical screw conveyor, and adequate mathematical analysis of conveying process were given, but relevant experiments was not carried out to validate the theoretical model.
With the development of computer technology, DEM simulation software becomes one of the more effective tool to investigate particle behavior in various engineering fields. Ono et al. 5 conducted a study about the influence of elemental shape on cutting resistance of soil in soil-machine interaction progress by comparing DEM simulation and experimental results. Tsunazawa et al. 6 presented a numerical contact model for wet particles considering quantitatively the effect of the cohesive force in contact states, and the experiments for the validation of this model was conducted. Kobayakawa et al. 7 studied the interaction force between the inclined plate and dry granular materials, and the effect of the rake angle of the plate on the drag force acting on the plate was investigated. Shimizu and Cundall 8 firstly used DEM to investigate particulate flow in a screw conveyor, and the results showed that DEM was sufficiently developed to analyze the performance of screw conveyor. Cleary et al.9,10 conducted various industrial DEM simulation to get better understanding the dynamics of industrial particle flow, and it was concluded that DEM simulation was able to give reasonable prediction for complex industrial processes.
The research of vertical screw conveyor mainly focuses on upgrading conveying efficiency. The capacity of vertical screw conveyor is affected by many factors, such as feed quantity, screw rotational speed, material filling rate, screw pitch, etc. Owen et al.11,12 studied the influence of different angles, rotational speeds and filling rates on the conveying performance using DEM, and the predictions of characteristic parameters, that is, particle speeds, mass flow rate, energy dissipation and power consumption, varied with different operating conditions were investigated. However, the relevant research of improving conveying efficiency and blockage for vertical screw conveyor by changing structure or operation parameters hasn’t been proposed yet.
In this paper, a vertical screw conveyor with variable screw section is presented to improve conveying efficiency. Firstly, the DEM parameters are calibrated by the disk experiment. Then, the conveying process of soybean in a vertical screw conveyor with variable screw section is numerically investigated by DEM. The particle dynamic characteristics are compared under different variable screw section and a traditional constant screw section. At last, in order to analyze the performance of variable screw section, the conveying capacity and power consumption with different screw rotational speeds are investigated.
DEM simulation
DEM contact model
The dry particles simulated in DEM are typically assumed as perfectly smooth spheres with infinite rigidity. This means there is only a single contact point between two particles when they come into contact. Also, particles are not allowed to deform but are able to overlap. The overlaps are used to determine the contact forces. The classical contact model in DEM is the Hertz-Mindlin (no slip) model which is also adopted for the contacts between particles and boundaries. It is described as follows. For two contact particles i and j, the contact forces are typically resolved into a normal force and a tangential force, each of which has two components. The normal force is independent of the tangential force. As shown in Figure 1, the normal contact force consists of the forces resulted from a spring and a damper. Similarly, the tangential force also contains a spring force (the shear force) and a damping force. 13

Hertz-Mindlin (no slip) contact model, (a) Normal force (b) Tangential force.
DEM parameters validation
As we know, the particle DEM parameter of friction coefficient is difficult to obtain, and then the macroscopic properties of the particle angle of repose is often used to calibrate and validate these parameters which are difficult to measure. There are many researchers have focused on the use of quasi-static experiments to validate the DEM simulation parameters. However, investigations have shown that DEM parameters derived from static validation experiments are often unsatisfactory for dynamic DEM simulations. In order to accurately acquire the dynamic characteristics of particles in the conveying process, the DEM parameters are validated using the disk experimental device, comparing the simulation results with the disk experiment results is an effective way to validate and calibrate the DEM parameters.14,15 A schematic representation of the rotating disk apparatus is shown in Figure 2, it consists of measuring rods, circular casing, central axis, horizontal disk and variable speed motor. The horizontal disk imparts circumferential motion to the particles. When the disk is adjusted at a certain rotational speed, the particles also gradually flow to the tube wall until the free surface reaches a limit equilibrium state. The measuring rods are installed perpendicularly to measure the particle free face. The diameter of the disk is 200 mm, and the disk could be regarded as a screw flight with zero pitch. The motor drives the horizontal disk to rotate through the central axis, and thus the material rotation movement in the conveyor is simulated. Under the stable operation condition, the particles will not move axially, and the material movement state can be maintained.
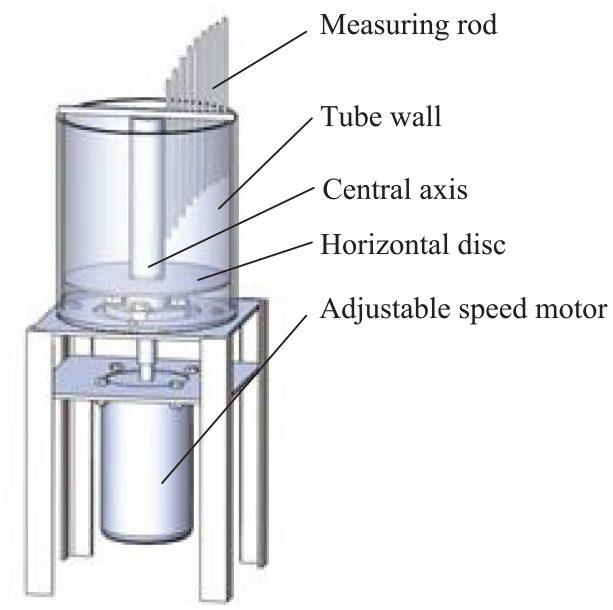
Disk experimental device.
The validation process is mainly to compare the free surface of the disk experiment with that of the DEM simulation. The parameters of DEM simulation which free surface is similar to the disk experiment are the calibration goal. The soybean DEM parameters are given in Table 1.
Parameters in experiment and DEM simulation.

The coefficient of restitution determines the post-collisional velocities and the rate of energy dissipation in direct particle impacts, and the Coulomb friction is dominated by static friction coefficient. 16 Therefore, the restitution coefficient and static friction coefficient should be calibrated, the calibration parameter groups are detailed in Table 2, the other DEM simulation parameters are consistent with the Table 1. The disk rotating speed is 150 rpm and the initial filling height of soybean is 30 mm. The maximum diameter D2 of each set of variable helix is increased by 60mm in turn, and the values are taken at equal intervals from 550 mm.
Simulation setting for calibration parameters.

Note: e is restitution coefficient;
In the disk experiment, the height data of the particle surface is measured using 12 vertical rod with equal distance. 12 calculation points are selected to measure the height in the DEM simulation in accordance with the disk experiment. In Group 1, the free surface of DEM simulation is shown in Figure 3(a). The height data of the disk experiment is compared with that of the DEM simulation, and results are illustrated in Figure 3(b). The determination factor R2 of the material height is calculated to illustrate the consistency between the simulation results and the experimental results.

The material free surface morphology of Group 1 (a) simulated material surface diagram (b) comparisons between simulation and disc experiment results of material surface.
The determinant coefficients R2 of Group1 to Group 5 are 0.973, 0.961, 0.921, 0.943 and 0.895, respectively. According to the R2 value in the simulation analysis, it is undeniable that random error exists in the experiment and the simulation when there are some particle instabilities jumping. But, it is clear that the consistency between the free surface simulation results and experiments from the value of R2, and the random error within 5%, it thus can be conclude that the Group 1 parameters can be used in the screw conveying simulations.
Vertical screw conveyor model with feeding funnel
The DEM simulation model is shown in Figure 4. The parameters of geometry model are as follows: diameter of the screw shaft d 140 mm, the diameter of the upper equal screw flight D1 550 mm, the maximum diameter of the lower screw flight D2, the thickness of the screw flight
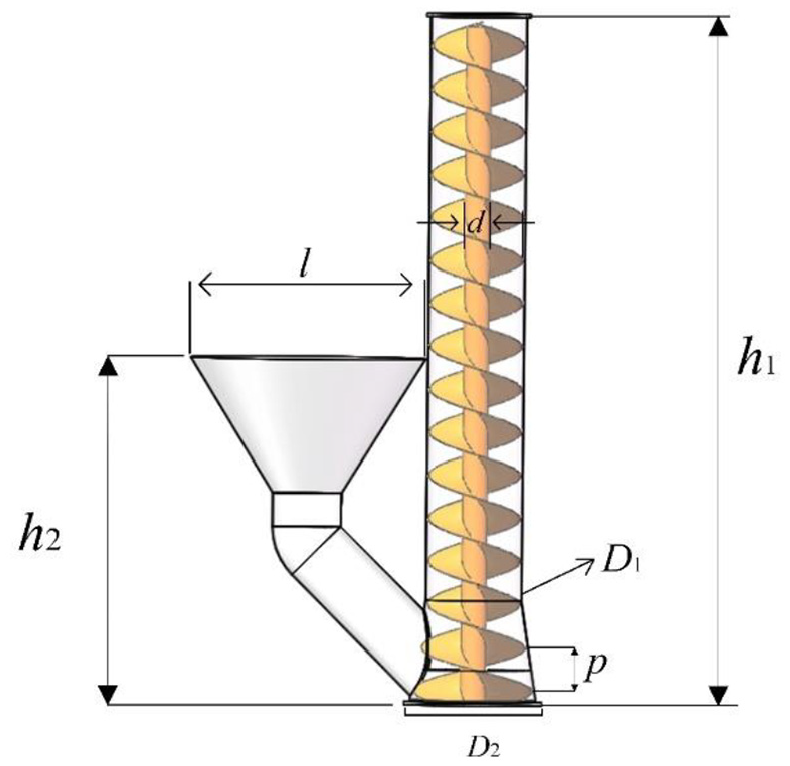
DEM model of screw conveyor with variable screw section.
The maximum diameter of screw flight D2 is set according to certain rules. As shown in Table 3, four groups simulation are set up, and a series of different screw rotational speeds are set up to investigate the particle dynamic characteristics for each group. The constant screw section is used in geometry model of Group 1, and the variable screw section is used in the other three groups.
Four different simulation cases.

Numerical analysis and discussion of simulation results
Particle velocity distribution in variable screw section condition
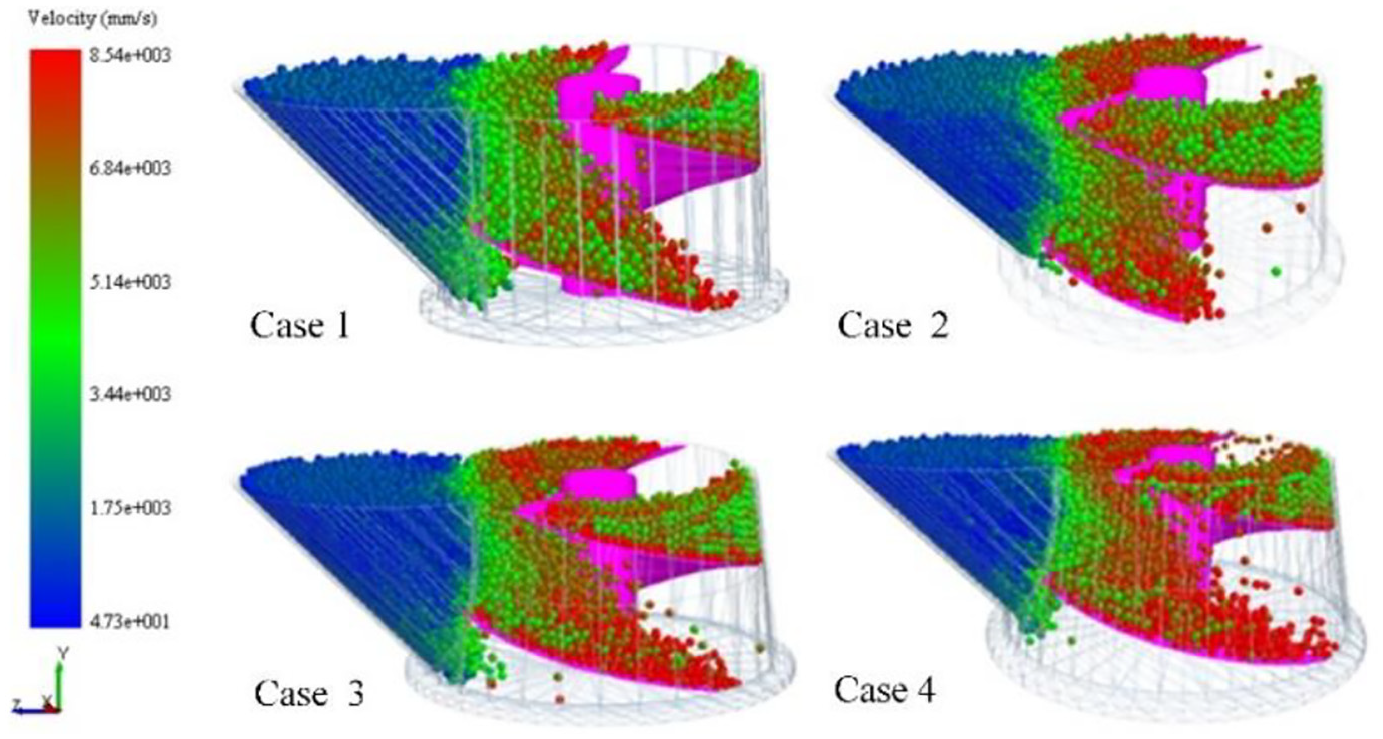
To get a better understanding of the particle flow in the inlet, the particle velocity distribution is investigated. 17 Figure 5 shows the particles axial velocity distribution in the variable screw section for four cases with the screw rotational speed 150 rpm. The particles are colored according to their speed grade. The faster moving particles are marked red 3m/s, the slower moving particles are marked blue 0m/s, and the intermediate velocity particles are marked cyan.

Distribution of particle axial velocity of different cases.
From Figure 5, it can be seen that from Case1 to Case 4, with the increase of the maximum diameter D2, the number of red particles gradually increase, which indicates the particles with high axial velocity have increased. The above results show that the variable screw section is beneficial to particles accelerating process.
The main view and the top view of the transverse section at the variable section of DEM simulation are shown in Figures 6 and 7. Figures 6 and 7 are consistent with Figure 5 in coloring. Figures 6 and 7 clearly show the particle axial velocity distribution at different screw sections of vertical screw conveyor.
Main view of particle velocity distribution in transverse section of different cases.

Top view of particle velocity distribution in transverse section of different cases.
Figure 7 shows that the quantity of high velocity particles (marked red) in the inlet increases gradually with the increase of diameter D2. This is due to the fact that the increasing contact area between screw flight and particles in the inlet, thus particles contact with screw flight directly, and then particles move to the edge of screw as the centrifugal force.
Particle number statistics at the bottom of screw
In the feeding process, the high rotational speed of screw flight influences particles movements strongly. 18 In order to investigate the influence of different screw diameters on feeding process, the particle number is counted at variable screw section region with different cases. As shown in Figure 8, the region with variable screw section is divided into 8×8×8 on average (512 small volume). The number of particles is counted with simulation time increasing. The results are expressed by the volume fraction of particles in the statistical region. Figure 9 shows the relationship between the volume fraction of particles in the statistical region and the simulation time under the screw rotational speed 150 rpm.

Statistical region.
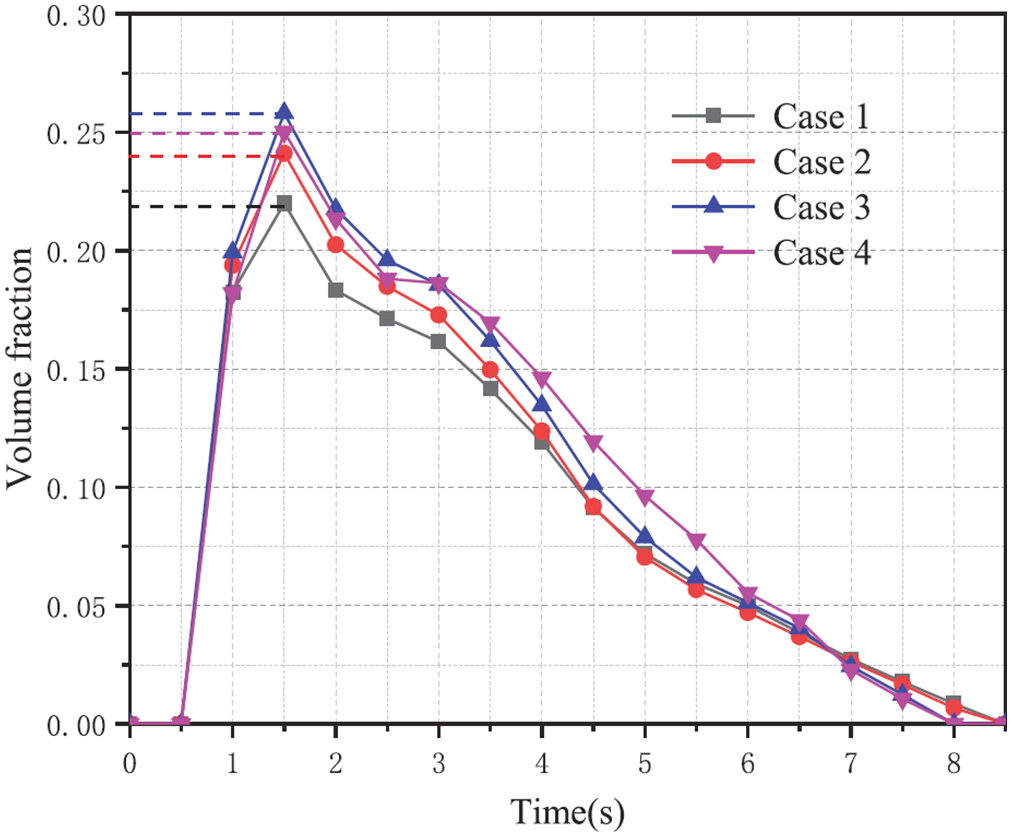
The volume fraction results under the different cases.
From the volume fraction curve of different cases in Figure 9, it can be seen that the material volume fraction in the variable screw section region has the maximum value. The results show that the maximum volume fraction of different cases appear at about 1.25 s of simulation time. The maximum volume fraction of Case 3 increased by 4% compared with Case 1. It is concluded that the feed efficiency is improved with the increase of diameter D2. However, when D2 increases continuously, the volume fraction of material in the variable screw section region decreases. This is due to the insufficient feed quantity in gravity drive mode.
Mass flow rate result of variable section screw conveyor
The particle mass flow rate is an important operating parameter for ensuring overall conveying stability in a screw conveyor.19,20 The flow capacity of material in vertical screw conveyor can be quantitatively expressed by measuring the material mass flow rate along the axis. To ensure the accuracy and the stability of particle mass flow rate, the mass flow monitor is set at the height of 2000 mm. The four simulations are conducted under the screw rotational speed 150 rpm. The DEM simulation monitoring results of the different cases are shown in Figure 10.

The mass flow rate results under the different cases.
From Figure 10, it can be seen that the maximum mass flow rate of Case1 to Case 3 increases gradually. The maximum mass flow rate of Case 1 is approximately 250 t/h, while that of Case 4 is about 180 t/h. Case 1 is a traditional vertical screw conveyor with constant screw section, and the others are in variable screw section condition. The decreasing mass flow rate of Case 4 is resulted from the reducing filling rate in the conveyor. When the bottom of screw flight in Case 4 becomes oversize, the feed quantity by gravity drive is not adequate for conveying. The results show that Case 3 has the highest conveying efficiency.
Power draw of screw shaft in conveying process
Power draw is an important index in screw conveyor design procedure, and it is related to torque which determines from DEM predictions of the forces exerted by the particles on the rotating screw. Figure 11 shows the relationship between the power draw and the conveying time under the screw rotational speed 150 rpm. The results show that the power draw of screw shaft varying with simulation time has the same trend for different cases. From the results of Case 1 to Case 4, it can be seen that the screw shaft consumes more power with the increase of diameter D2. On the one hand, it reflects that the vertical screw conveyor with variable screw section feeds more materials, which leads to more power consumption. On the other hand, combined with Figure 9, it is concluded that the rate of feed for particles in Case 4 is not able to catch up with conveying rate. In addition, the granular vortex motion is intensified due to the larger diameter D2. It consumes more power to keep the particles rotating at high vortex 2 speed, which means that the lateral centrifugal pressure exerted on particles is greater than the vertical, gravitational induced pressure. Therefore, the oversize diameter D2 is not beneficial for particle conveying.

The power draw results under the different cases.
Effect of screw rotational speed on conveying process
The conveying capacity of a screw conveyor is proportional to the screw rotational speed.21,22 Thus, the conveying characteristics of the above four cases at different rotational speeds are investigated, such as: volume fraction, mass flow rate, power draw of screw shaft. The relationship between above conveying characteristics and rotational speeds are shown in Figures 12–14 respectively.

Maximum volume fraction in statistical region variation with rotational speed.

Maximum mass flow rate variation with rotational speed.
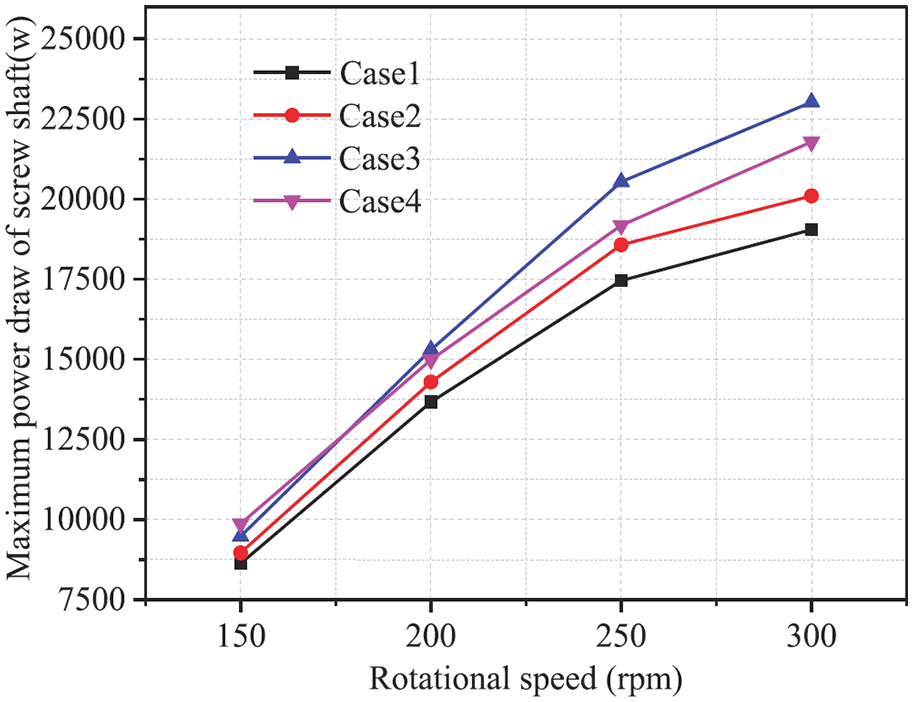
Maximum power draw of screw shaft variation with rotational speed.
Figure 12 shows that the volume fraction in the statistical area decreases with the increase of the screw rotational speed. This is caused by intensified particle movement in the statistical region. The faster movement reduces the residence time of particles in the statistical region, thus the maximum volume fraction decreases.
Figure 13 shows that the maximum mass flow rate of the four cases increases significantly with the increase of screw rotational speed. Compared with the traditional constant screw section in Case 1, the variable screw section in Case 2 and Case 3 get better conveying performance. As the restricted feeding and oversize diameter D2 reduce the filling rate, the variable screw section in Case 4 has the opposite effect on particles conveying.
For all cases, Figure 14 shows that the screw shaft consumes more power with the increase of screw rotational speed. Besides, the above curves show that the power draw increasing rate of four cases has a downtrend. At low rotational speeds, the maximum difference of power draw between four cases is 1300 W. With the screw rotational speed increasing, the difference between four cases becomes more obvious. Both Case 2 and Case 3 have more power consumption than Case 1, and the conveying quantity increases accordingly. The screw shaft of Case 4 consumes more power, but the mass flow rate of the Case 4 is ranked second, which indicates that the oversize screw section is not appropriate to elevate materials.
Conclusion
In this paper, DEM simulation is used to analyze the conveying process of a traditional vertical screw model with constant screw section and three kinds of variable screw section. The DEM parameters are calibrated through experiment. The effects of variable screw section on particles feeding process are studied. The dynamic characteristic, that is, particle velocity distribution, volume fraction, mass flow rate and power draw of screw shaft, are investigated. It can be seen from the results and discussion above that:
The volume fraction in the inlet in the condition of variable screw section is higher, and the mass flow rate also increases in the condition of variable screw section. It is obvious that the variable screw section design may effectively upgrade feed quantity and conveying efficiency comparing to constant screw section.
The particle vortex motion may intensify when the diameter D2 is oversize, which reduces the axial conveying velocity. The positive effect of variable screw section on particles conveying only happens under sufficient feeding.
The variable screw section design increases power consumption of the conveyor accordingly, thus the specific energy consumption should be an index to judge whether the design is reasonable.
Footnotes
Declaration of conflicting interests
The author(s) declared no potential conflicts of interest with respect to the research, authorship, and/or publication of this article.
Funding
The author(s) received no financial support for the research, authorship, and/or publication of this article.