
Abstract
Considering the multiple effects of product greenness and carbon emission trading, this article constructs a differential game model to study the collaborative innovation between enterprises in a green supply chain composed of one manufacturer and one supplier. This article examines the optimal green technology innovation strategies, optimal revenues of manufacturers and suppliers as well as the overall green supply chain revenues in the Nash non-cooperative game model, the Stackelberg master–slave game model, and cooperative game model, respectively. Through the comparative analysis of equilibrium results, it is found that the optimal strategies of suppliers and manufacturers as well as the total revenue of the green supply chain in the cooperative games are better than those in the non-cooperative game scenario. Meanwhile, undertaking part of suppliers’ green innovation cost by manufacturers is the Pareto optimization mechanism that increases the total revenue of the green supply chain and their respective revenues. The research results of this article provide theoretical support for green supply chain enterprises to formulate incentive mechanisms for scientific strategy-making and reasonable revenue distribution.
Keywords
Introduction
In recent years, the greenhouse gas emissions from human activities-related energy consumption are admitted to be one of the main causes of global climate change and environmental problems. 1 Accelerating the transformation of development mode and promoting the realization of green sustainable development have become one of the hotspots of governments, enterprises, and scholars. In this condition, many countries began to design carbon trading mechanisms and carbon emission constraints to reduce carbon emissions.2,3 Similar to other production resources, carbon emission rights have become a resource input for production and services, which can eventually bring profits. Therefore, the restrictions on carbon emissions and trading would change the cost composition and profit mode of enterprises, and ultimately affect the profit behavior of enterprises. 4 By introducing carbon emission constraints and trading mechanisms into the supply chain system, scholars mainly concern about the impact of carbon policies on the coordination and strategy-making optimization of upstream and downstream enterprises in the supply chain. Zhang et al. 5 figure out the optimal output of manufacturers faced with uncertain demand, as well as carbon emission constraints and trading mechanisms. Du et al. 6 introduce the concept of low-carbon effort to explore the win-win cooperation mechanism for the performance of supply chain and environmental. Scholars study the optimal emission reduction and low-carbon investment decisions of the supply chain based on the carbon policies, and also compare the overall profit level of the supply chain under two mechanisms of overall and decentralized decision-making. 7 Luo and Cai 8 adopt the decision-making game model to find that both distributors’ independent subsidies and government subsidies can reduce carbon emissions and increase the overall profit of the supply chain. Benjaafar et al. 9 discuss the cooperation of emission reductions among supply chain enterprises based on carbon footprint parameters, and present an optimization mechanism for enterprises to reduce carbon emissions. Du et al. 10 examine the Stackelberg game process of supply chain enterprises relying on carbon emission rights, and analyze the effect of carbon emission rights on the production operation of the supply chain based on the newsboy model. Zhao et al. 11 build a differential game model for vertical cooperation on carbon emission reduction between a single supplier and a single manufacturer, and dynamically resolve their optimal emission reduction strategies and profit functions. Xie and Zhao 4 further study the optimal production and profit distribution of a supply chain composed of a single supplier and two manufacturers considering the carbon quota allocation policy.
However, the mere implementation of carbon emission constraints and trading mechanism does not have enough utility. Magat 12 believes that the green technology innovation can not only improve the environment but also promote the economic growth, which is an effective means to solve economic development and environmental problems simultaneously. Since consumers’ preference for the green products significantly affects the enterprises’ strategy selection for the green technology innovation in recent years, it is necessary for enterprises to invest in the green technology innovation and improve the greenness of products. 13 Chen 14 states that more and more customers are willing to pay higher prices for green products with the gradual enhancement of green consumption consciousness. Ghosh and Shah 15 construct a manufacturer–retailer supply chain to study the impact of product greenness, pricing strategies, channel structure, and consumers’ sensitivity to green products on strategy choices of the supply chain members. Zhang et al. 16 focus on the effect of consumers’ environmental awareness on the order quantities and channel coordination in a two-echelon supply chain consisting of a single manufacturer and a single retailer. Zhu and He 17 analyze the influence of supply chain structure, green product types, and competition types on the greenness of products, and the results show that both wholesale price contracts and cost-sharing contracts cannot fully coordinate supply chain profits. In the supply chain management, Zhu and Dou 18 establish a three-echelon game model considering product greenness and government subsidies, and propose strategy-making methods of the government and the manufacturers of finished products adopting the positive and negative green supply chain strategies, respectively. In terms of the carbon emission constraints and carbon trading mechanism, Wang et al. 19 study the optimal order quantity and green emission reduction investment of the secondary supply chain under the low-carbon preference of consumers, and conclude that retailers’ profits under low-carbon supply chain are higher than those of non-low-carbon supply chain, realizing the supply chain coordination based on the Pareto improvement.
Based on the existing literatures, there are relevant research works on emission reduction strategies and revenue distribution of supply chain under the carbon emission constraints and carbon trading mechanism. However, a few literatures incorporate the product greenness and carbon emission trading simultaneously into the unified analysis framework of the long-term dynamic optimal equilibrium strategy of the green supply chain from the perspective of green technology innovation. From the environmental perspective, the green and sustainable production can reduce the carbon emissions to alleviate the environmental pollution; from the market perspective, customers become more and more inclined to green products with the increasing awareness of environmental protection. In this circumstance, how to implement green technology innovation, produce green products, and realize the “win-win” situation of economy and environment has become practical problems for green supply chain enterprises. Owing to the long-term, dynamic, and complex green technology, enterprises need to carry out green technology innovation continuously in order to obtain the core competitiveness. Thus, the continuous time variables affect the green supply chain enterprises’ decision-making for green collaborative innovation with the goal of maximizing revenue. In this case, differential games are important models which consider the impact of temporal dynamics on the revenues of green supply chain enterprises. Hence, a differential game model is established to study the collaborative innovation of manufacturers and suppliers of the green innovation supply chain in the dynamic framework. Faced with the random market demand, the impact of product greenness and carbon emission trading on the green supply chain is considered to investigate the optimal green technology innovation strategies of manufacturers and suppliers under the principles of revenue allocation and cost sharing, in order to achieve the Pareto optimality of the green supply chain. Besides, the revenue distribution and coordination mechanisms of the green supply chain are explored to provide the theoretical and strategy-making support for promoting the collaborative innovation among green supply chain enterprises.
The remainder of this article is organized as follows. The establishment of stochastic differential game models is presented in section “Establishment of stochastic differential game models.” The Nash non-cooperative game model, the Stackelberg master–slave game model, and cooperative game model are all resolved in section “Construction and solution of game model.” The equilibrium results in three game scenarios are compared and further analyzed in section “Comparative analysis of equilibrium results.” The analysis on the coordination mechanism of the green cooperative innovation is demonstrated in section “Analysis on the coordination mechanism of green cooperative innovation.” A numerical analysis is provided in section “Numerical analysis,” and the conclusion and the implication are shown in section “Conclusion and implications.”
Establishment of stochastic differential game models
Regarding the simplified model establishment, this article constructs a two-echelon green supply chain consisting of a single manufacturer (a) and a single supplier (b). It is assumed that suppliers and manufacturers implement green technology innovation by purchasing new equipment, introducing new technologies, and improving production processes to achieve carbon emission reduction goals. Meanwhile, manufacturers and suppliers are rational individuals aiming at maximizing their own benefits with complete information, and consumers prefer green products. Moreover, the carbon permit trading is introduced to control carbon emissions. In this model, the initial carbon emission reduction quotas of the manufacturer and the supplier are set by the government as
The carbon emission reduction of the manufacturer and the supplier is assumed to be
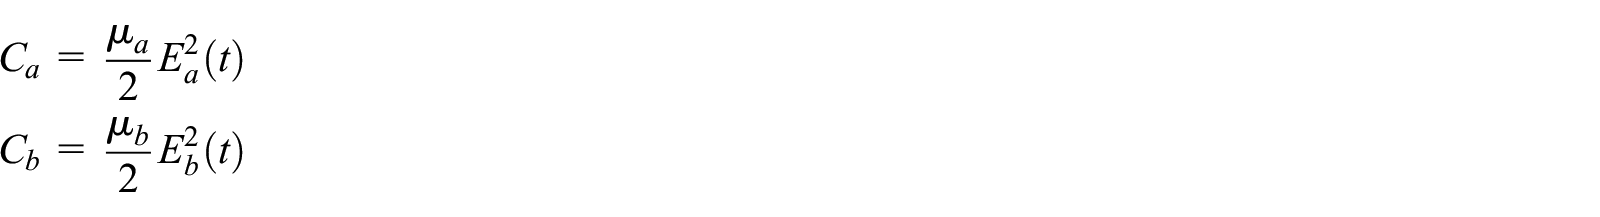
where

where
The market demand is determined by the greenness and retail price of the product, and consumers are presumed to prefer products with high greenness and low price. 22 The market demand factors have been divided by Ouardighi and Kogan 23 into price and non-price factors, which are both believed to affect the market demand in the form of separable multiplication. Hence, the market demand function is

where
The total revenue of the green supply chain is derived from the sale of green products and carbon emission rights trading. At time

where
It is supposed that the total revenue of the green supply chain is distributed between the manufacturer and supplier according to a certain distribution ratio. Specifically,
In order to simulate supplier (b) to conduct the green technology innovation, manufacturer (a) will take the initiative to bear
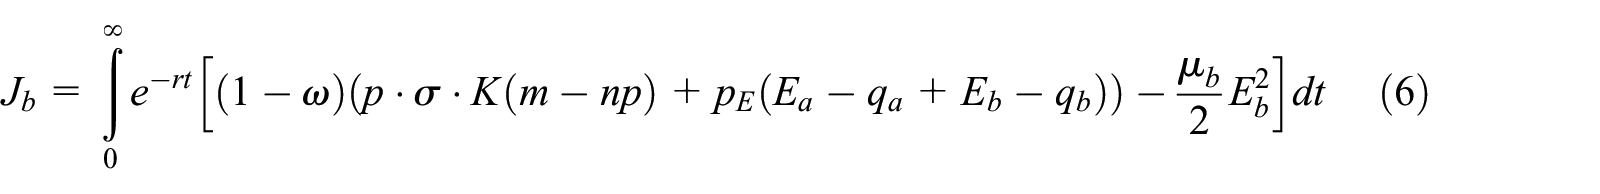
The objective function of manufacturer (a) is

The objective function of supplier (b) is

Construction and solution of game model
Nash non-cooperative game
In the Nash non-cooperative game, manufacturer (a) and supplier (b) are independent, and the green technology innovation strategies will be simultaneously made to maximize their own revenue. Thus, the rational manufacturer will not share the cost of green innovation for the supplier, which means
Accordingly, the manufacturer’s objective function becomes

Meanwhile, the supplier’s objective function becomes
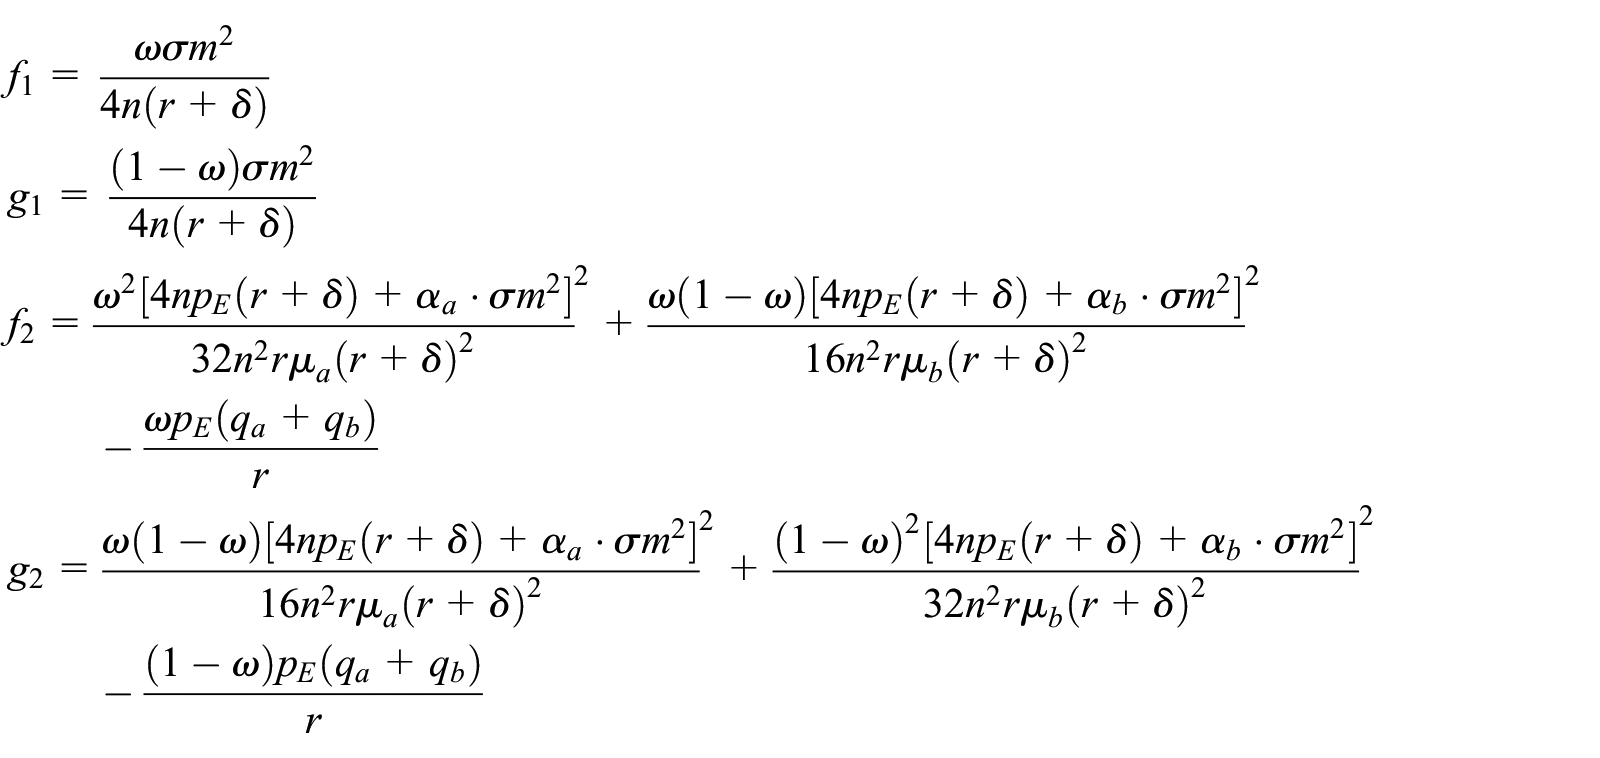
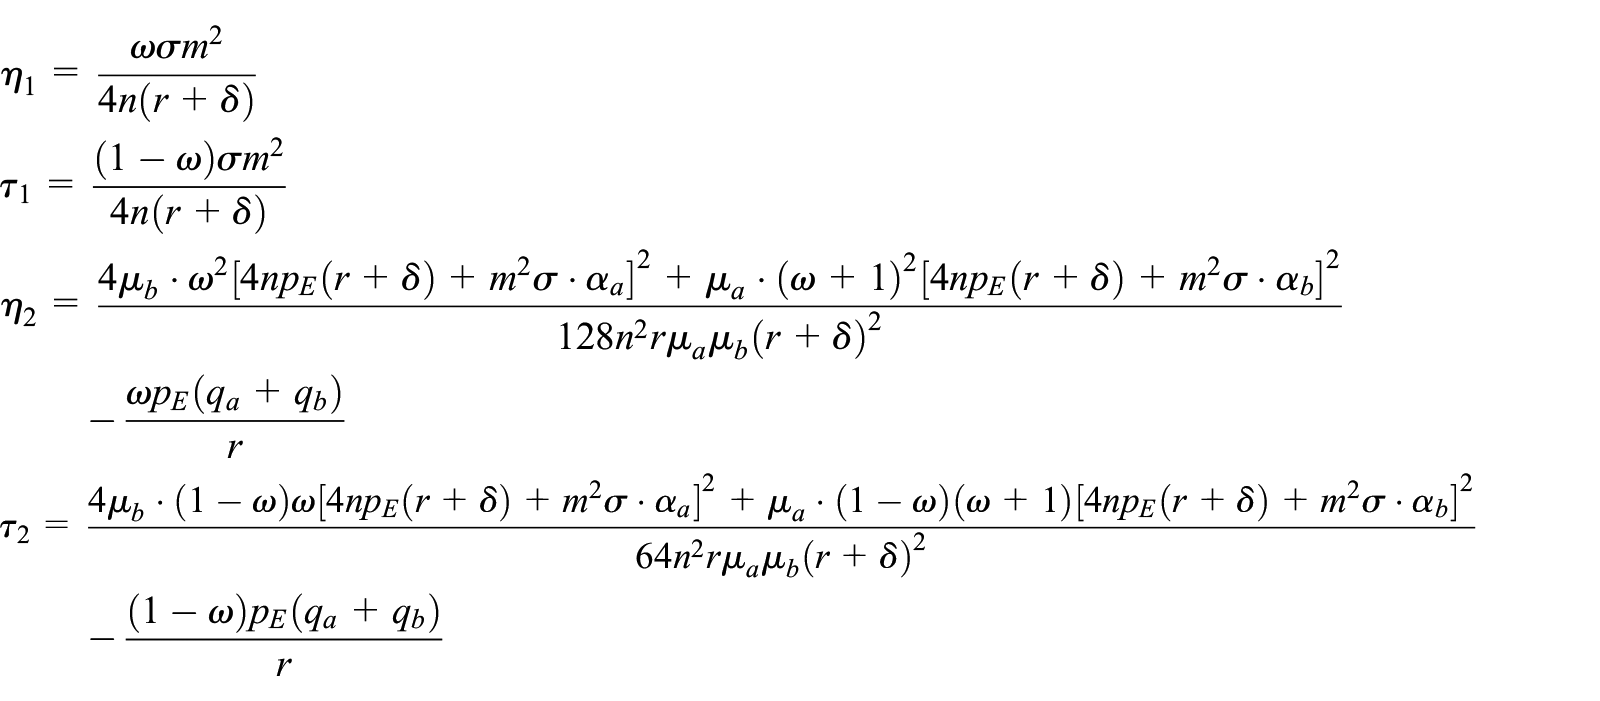
Proposition 1
In the Nash non-cooperative game, the optimal green technology innovation strategies of manufacturer (a) and supplier (b) in the supply chain can be expressed as follows

Proof
In the green supply chain, it is assumed that the optimal revenue functions of manufacturer (a) and supplier (b), referring to


In order to maximize the right sides of equations (7) and (8), the first partial derivatives of

The simplification can be obtained by substituting equation (9) into equations (7) and (8)

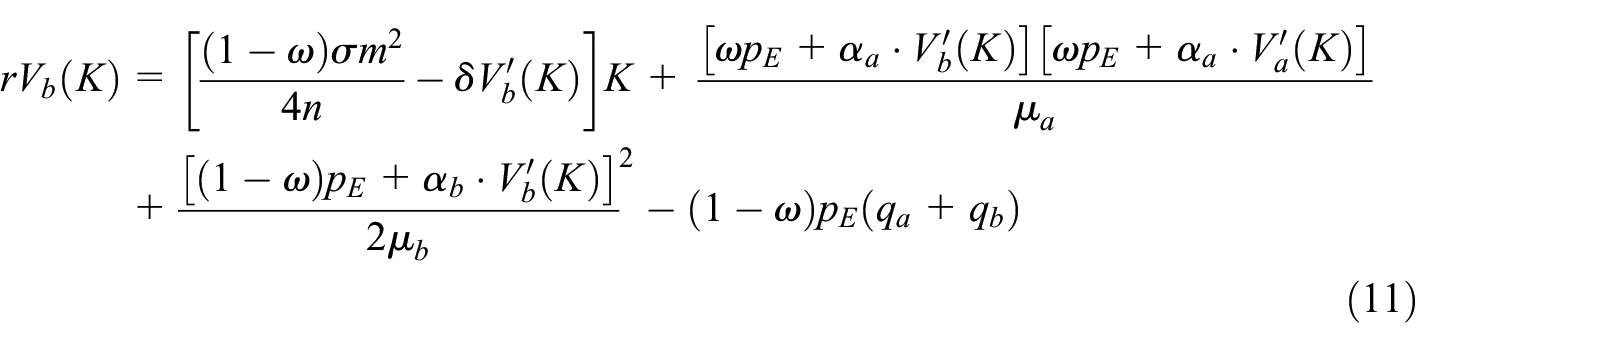
On the basis of the structural characteristics of equations (10) and (11), it is known that the linear function of the independent variable

where

Substituting equations (12) and (13) into equations (10) and (11) yields the following equations

It can be seen from the previous hypotheses that equations (14) and (15) are valid for all


After substituting


Hence

where
Stackelberg master–slave game
In this case, manufacturer (a) will actively bear part of the green innovation cost in order to motivate supplier (b) to make more efforts in green technology innovation as the core enterprise in the green supply chain. Therefore, the cooperative green innovation strategies of the manufacturer (a) and the following supplier (b) constitute the Stackelberg differential game. At this time, the manufacturer initially determines the effort level of green technology innovation
Proposition 2
In the Stackelberg master–slave game, the optimal green technology innovation strategies of manufacturer (a) and supplier (b) in the supply chain can be expressed as follows

Proof
For the sake of the Stackelberg equilibrium, it is assumed that the optimal revenue functions of manufacturer (a) and supplier (b), referring to

To maximize the right side of equation (21), the first-order derivate of

A rational manufacturer is capable of predicting the green technology innovation strategy of supplier
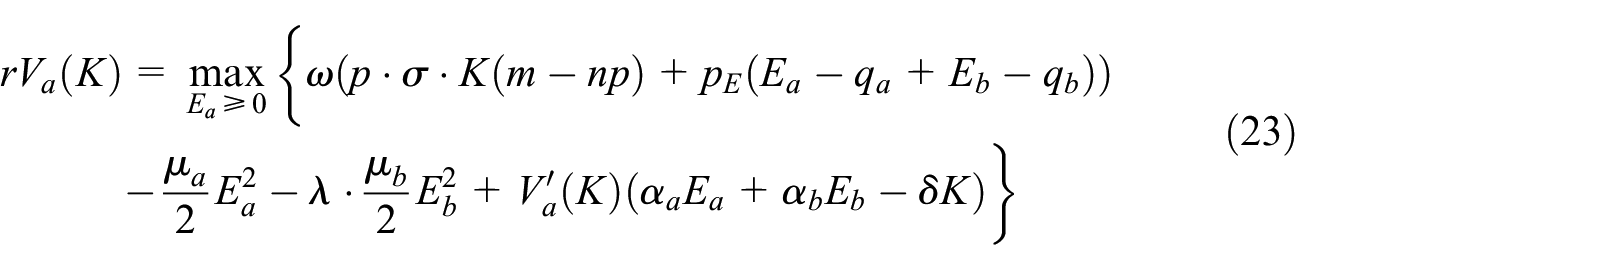
The following equation is acquired by substituting equation (22) into equation (23)
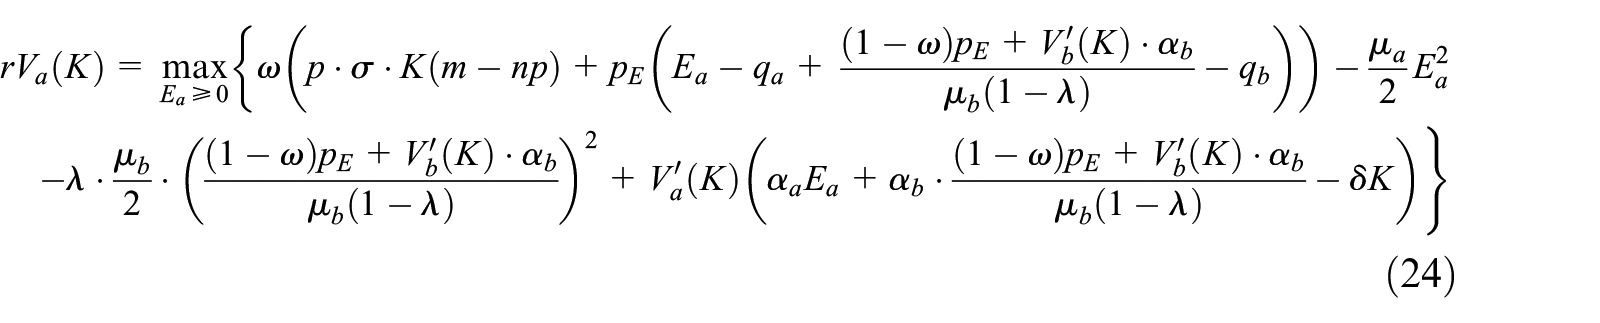
To maximize the right side of equation (24), the first-order derivates of


Substituting equation (26) into equation (22),

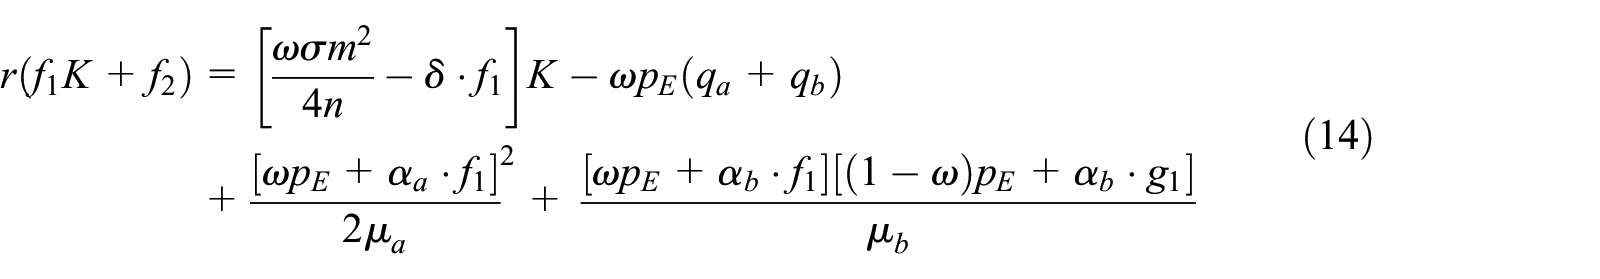
The following equations are obtained by substituting equations (25)–(28) into equations (21) and (23)
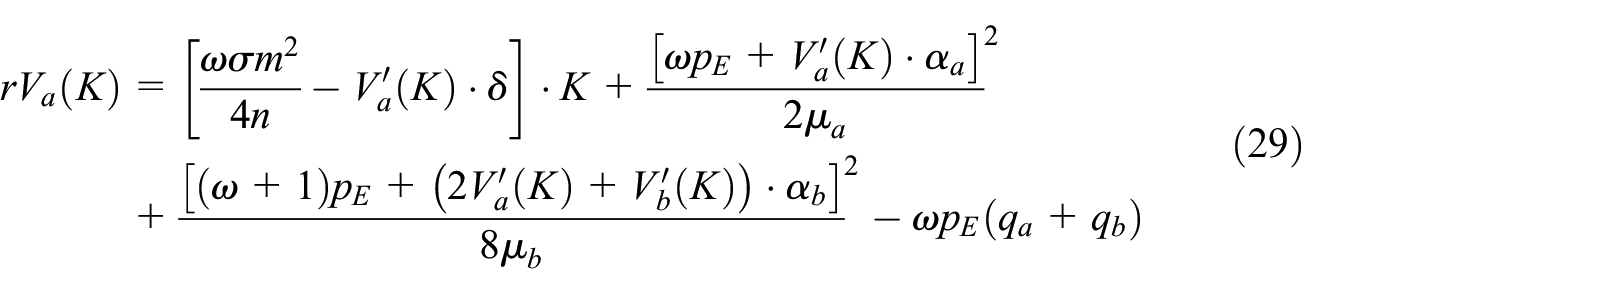

It is known from the structural characteristics of equations (29) and (30) that the linear function of the independent variable (

where

The results of substituting equations (31) and (32) into equations (29) and (30) are shown below


In order to guarantee that equations (14) and (15) are valid for all
The substitution of


Given that
The following equations are obtained by substituting


where
Cooperative game
Under the green collaborative innovation mode, both manufacturer (a) and supplier (b), as an organic whole, aim at maximizing the overall revenue of the green supply chain, and jointly determining their respective optimal green technology innovation effort level and the optimal revenue level of the green supply chain. In this condition, the objective function of the green supply chain is

Proposition 3
In the cooperative game, the optimal green technology innovation strategies of manufacturer (a) and supplier (b) in the supply chain can be expressed as follows

Proof
Assuming that the optimal revenue function of the green supply chain, that is,
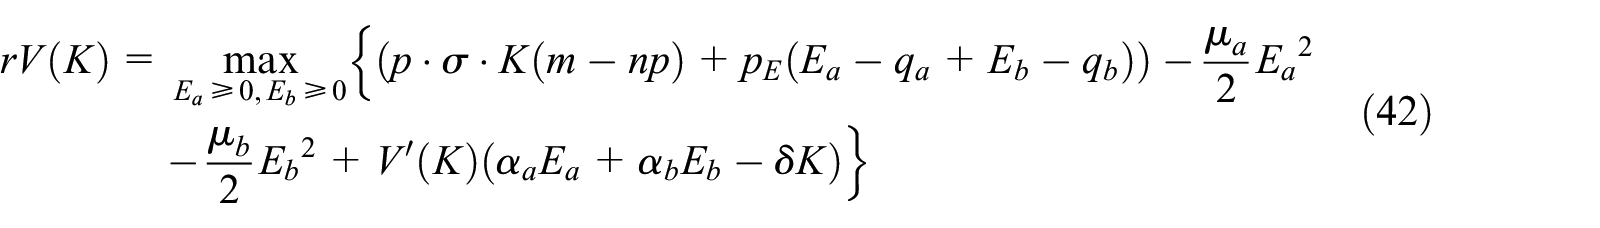
To maximize the right side of equation (42), the first-order derivates of


The result of substituting equations (31) and (32) into equations (29) and (30) is expressed below

According to the structural characteristics of equation (40), it is inferred that the optimal revenue function should be a linear function of the independent variable

where

Substituting equations (47) and (48) into equation (42), the following equation is obtained

In order to guarantee that equation (49) is valid for all

The substitution of


After substituting
where
Comparative analysis of equilibrium results
Through the previous propositions and proof, the optimal green technology innovation effort level and the revenue level of both manufacturer and supplier as well as the optimal revenue level of the green supply chain under three game scenarios are obtained. In this condition, a comparison of equilibrium results in three game scenarios is demonstrated in Table 1.
Comparison of equilibrium results under three game scenarios.

Propositions 4 and 5 are obtained by comparing the optimal green technology innovation strategies and optimal revenues of manufacturer (a) and supplier (b) as well as the total revenue of the green supply chain under the three game scenarios.
Proposition 4
Compared with the Nash non-cooperative game, the manufacturer’s green technology innovation effort level in the Stackelberg master–slave game remains unchanged. However, the supplier’s green technology innovation effort level in the Stackelberg master–slave game is significantly improved. Specifically, the increase equals to the optimal proportion of the supplier’s green innovation cost undertaken by manufacturer, which indicates that manufacturers are responsible for a part of the green innovation cost for suppliers, which is an incentive mechanism for suppliers to make more efforts for green technology innovation. In the case of cooperative game, the manufacturer’s and supplier’s green technology innovation effort levels are better than those of the non-cooperative game regarding the green collaborative innovation, reaching the maximum.
The comparative analysis of the optimal green technology innovation strategies of manufacturer (a) and supplier (b) under three game scenarios is demonstrated as follows

Proof
According to equations (16), (17), (34), (35), (37), (49), and (50), the following equations can be obtained, where

Proposition 5
In the case of the Stackelberg master–slave game, the optimal revenues of manufacturer (a) and supplier (b) and the total revenue of the green supply chain are higher than the corresponding values in the Nash non-cooperative game, which is the Pareto effective value. In addition, when the green collaborative innovation is carried out by manufacturer (a) and supplier (b), the total revenue of the green supply chain in the cooperative game is the highest compared to that of the Nash non-cooperative game and the Stackelberg master–slave game, reaching the systematic Pareto optimality.
The comparative analysis of the optimal revenues of manufacturer (a) and supplier (b) as well as the total revenue of the green supply chain under three game scenarios are further illustrated as follows

Proof
According to equations (18), (19), (20), (38)–(40), and (52), the following equations can be acquired, where

where
Analysis on the coordination mechanism of green cooperative innovation
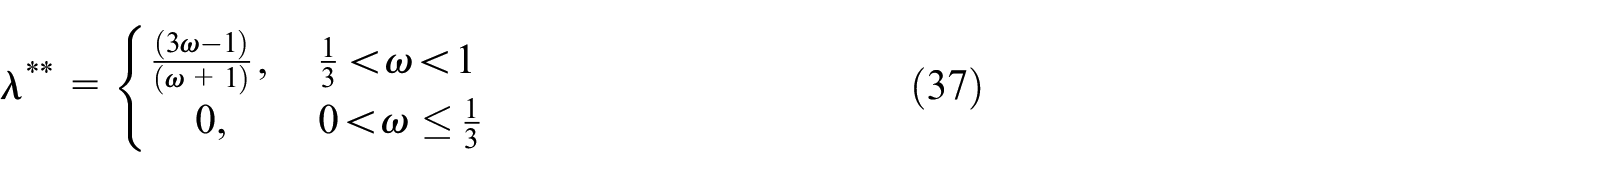
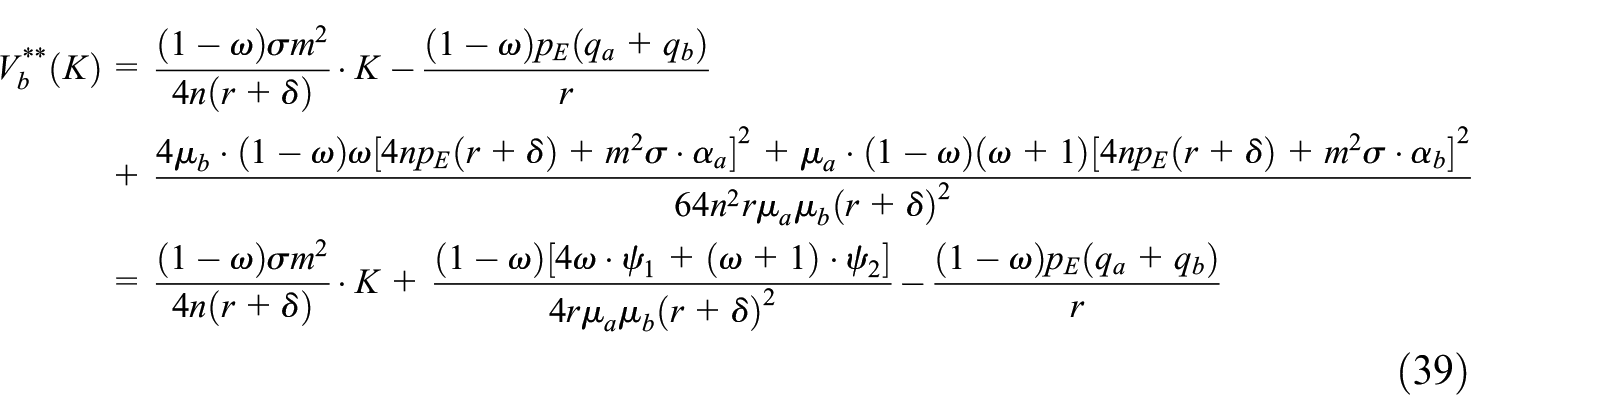
It can be known from Proposition 5 that the total revenue of the green supply chain under the cooperative game reaches its maximum, but the optimal revenues of manufacturer (a) and supplier (b) do not necessarily exceed those of the non-cooperative game. In this condition, when the revenue distribution is feasible and reasonable, which means that the optimal revenues of manufacturer (a) and supplier (b) can exceed those of the non-cooperative game, their green collaborative innovation behaviors can be coordinated to achieve the Pareto optimality. Therefore


In accordance with Proposition 5,
According to the hypotheses of the model, the total revenue of the green supply chain is distributed between manufacturer (a) and supplier (b); hence, their optimal revenue functions are expressed, respectively, as follows

where
The following equations can be obtained based on equation (53)


Equation (59) is acquired by the collation of equations (57) and (58)

Meanwhile,
When
When
In order to coordinate the green collaborative innovation behaviors of manufacturer (a) and supplier (b), that is, when the total revenue of the green supply chain reaches the optimality (cooperative game), both manufacturer (a) and supplier (b) reach their respective Pareto optimality. The revenue distribution coefficient
When
Numerical analysis
On the basis of above research works, the optimal green technology innovation strategies and the optimal revenues of manufacturer (a) and supplier (b) as well as the total revenue of the green supply chain in different game scenarios depend on the setting of model parameters. It is assumed that the values of each parameter are
Substituting the above parameters into the model, we can obtain:
Let

Comparative analysis of manufacturer’s optimal revenue level in three game scenarios.

Comparative analysis of supplier’s optimal revenue level in three game scenarios.
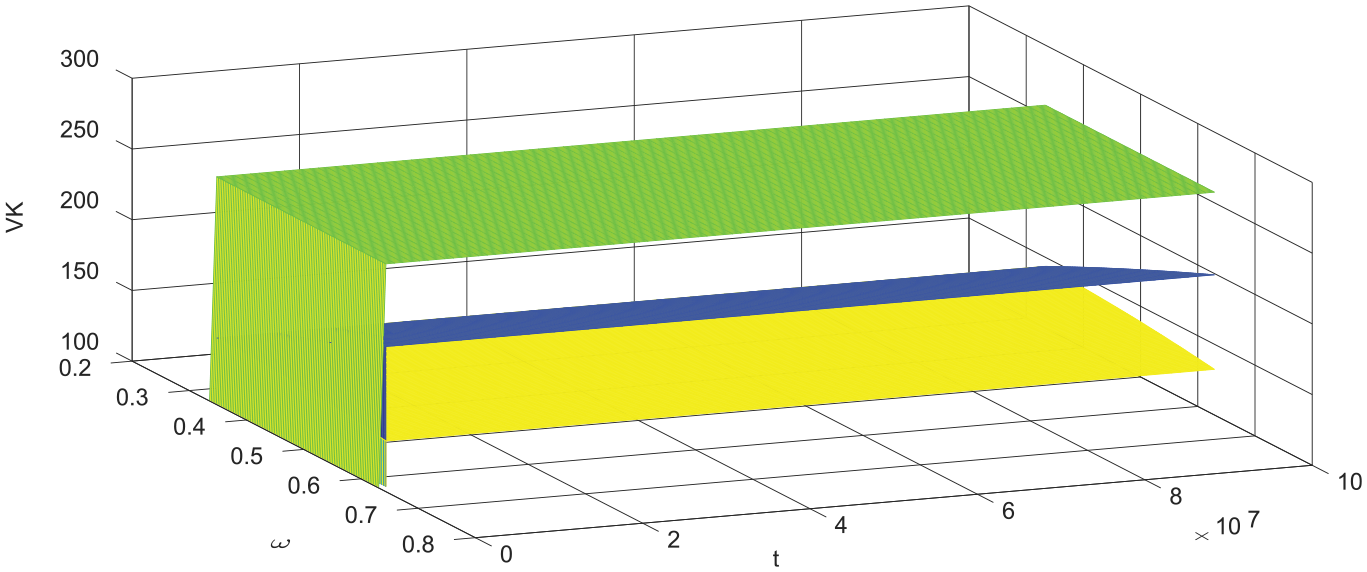
Comparative analysis of optimal revenue level of the green supply chain in three game scenarios.
According to Figures 1–3, in the case of a certain revenue distribution coefficient, the optimal revenue level of manufacturer (a) and supplier (b) and the total revenue level of the green supply chain go upward over time, which initially rise dramatically and then gradually stabilize. Besides, in terms of a certain time, the optimal revenue of manufacturer (a) increases with the increase in the revenue distribution coefficient, while the optimal revenue of supplier (b) decreases with the increase in the revenue distribution coefficient. As can be seen from the figures, the collaborative innovation strategy among green supply chain enterprises based on carbon emission trading can achieve the Pareto optimality, so as to realize the green supply chain coordination.
Conclusion and implications
Considering the impact of product greenness and carbon emission trading on the green supply chain, a differential game model of collaborative innovation among green supply chain enterprises consisting of a single manufacturer and a single supplier is constructed. The comparative analysis of equilibrium results concludes as follows. (1) The optimal strategies of suppliers and manufacturers as well as the total revenue of the green supply chain in the Stackelberg master–slave game and cooperative game surpass those in the non-cooperative game. (2) In the Stackelberg master–slave game, the optimal revenue of both manufacturers and suppliers as well as the optimal revenue of the green supply chain surpass the corresponding values in the Nash non-cooperative game. Hence, the green innovation cost share is the optimized Pareto mechanism for increasing the total revenue of the green supply chain and the revenue of both participants. (3) Compared with the Nash non-cooperative game, the manufacturers’ green technology innovation effort level remains the same, but the suppliers’ green technology innovation effort level is improved in the Stackelberg master–slave game. Its improved degree equals to the optimal ratio of the green innovation cost ratio. (4) In the cooperative game, the total revenue of the green supply chain achieves the systematic Pareto optimality. Meanwhile, a reasonable revenue distribution is a dynamic coordination mechanism for realizing individual Pareto optimality of manufacturers and suppliers as well. In addition, the above conclusions are verified by a numerical analysis.
The main contributions of this article are as follows:
The enterprises in the green supply chain choose the reasonable green technology strategies with the assistance of the research results. It can also promote the green collaborative innovation among enterprises in the green supply chain and contribute to reducing carbon emissions.
In general, carbon emission constraints and carbon trading mechanisms are regarded as external environmental regulations, while the relationship between green technology innovation and carbon emission reduction is ignored. This study utilizes the carbon emission reduction to represent the green technology innovation effort level, and also comprehensively considers the effect of the product greenness and retail price on the market demand, which possess practical significance for the study of collaborative innovation among green supply chain enterprises.
The research results of this article also provide theoretical support for green supply chain enterprises to formulate incentive mechanisms for scientific strategy-making and reasonable revenue distribution.
However, some limitations in this study are needed to be further discussed. We merely consider the green supply chain composed of a single manufacturer and a single supplier. In reality, the green supply chain involves more entities, so more complex collaborative innovation among green supply chain enterprises needs to be further studied. Meanwhile, the parameters of the model are simplified to facilitate the calculation, and the method of solving the non-degenerate differential equation can be further explored. In addition, since the green technology innovation level in the green supply chain varies with time, we can study the expectation and stability of green technology innovation level, considering more random interference factors in the future.
Footnotes
Appendix 1
Declaration of conflicting interests
The author(s) declared no potential conflicts of interest with respect to the research, authorship, and/or publication of this article.
Funding
The author(s) received no financial support for the research, authorship, and/or publication of this article.