
Abstract
Rolling element bearings are used in all rotating machinery, and the degradation performance of rolling element bearings directly affects the performance of the machine. Therefore, high reliability prediction of the performance degradation trend of rolling element bearings has become an urgent research problem. However, the degradation characteristics of the rolling element bearings vibration time series are difficult to extract, and the mechanism of performance degradation is very complicated. The accurate physical model is difficult to establish. In view of the above reasons, based on the vibration performance data of rolling element bearings, a model of bearing performance degradation trend parameter based on wavelet denoising and Weibull distribution is established. Then, the phase space reconstruction of the series of bearing performance degradation trend parameter is carried out, and the prognosis is obtained by the improved adding weighted first-order local prediction method. The experimental results show that the bearing vibration performance degradation parameter can accurately depict the degradation trend of the bearing, and the reliability level is 91.55%; and the prediction of bearing performance degradation trend parameter is satisfactory: the mean relative error is only 0.0053% and the maximum relative error is less than 0.03%.
Keywords
Introduction
Rolling element bearings (REB) are one of the widespread components in mechanical equipment. Although they are not expensive, accidental failure of REB can cause unplanned downtime of machine, catastrophic accidents, or casualties of personnel. Therefore, it is critical to explore the degradation mechanism of REB performance for fault diagnosis and reliability analysis of REB.
In recent years, the performance data of REB, such as vibration, noise, friction torque, and remaining useful life (RUL), have been regularly investigated for fault diagnosis and prediction. Among these, vibration performance is the most widely studied, and the reason is that the vibration data contain abundant useful information and can be classified into three major categories:
Temporal domain
Frequency domain
Time–frequency domain
The temporal domain information of REB vibration data was used by Li et al., 1 and long-range dependence (LRD) prediction method was proposed based on the chaotic characteristics and typical fractional order features of REB vibration intensity time series. The frequency domain information of REB vibration data was used by Zengqiang et al., 2 and a method of fault feature extraction was proposed based on variational mode decomposition and singular value decomposition (VMD-SVD) joint de-noising and frequency slice wavelet transform (FSWT). The method can effectively eliminates the influence of noise and clearly extracts the frequency domain feature of the fault signal. The time–frequency domain information of REB vibration data was used by Soualhi et al.: 3 health indicators were extracted by Hilbert–Huang transform to track degradation information, and the degradation states were detected by support vector machine, and then, the fault diagnostic was given by analyzing the extracted health indicators.
Usually, the degradation process over the whole lifetime of the bearings can be classified into three periods:
The natural run-in period.
The optimal operation period.
The deterioration period.
In period 1, the bearing vibration signal exhibits a slight fluctuation and has very small amplitudes. In period 2, the bearing vibration signal has very small amplitudes as well and stays at a stable level: the vibration data are nearly constant, which reflects that a bearing is in an optimal condition. In period 3, the bearing vibration signal exhibits a sharp rise in amplitude.
In this article, recent studies of prediction approaches can be classified into two categories: physics-based methods and data-driven methods.
For physics-based methods, there are three drawbacks which are needed to be addressed:
The physical model of rolling bearings vibration which requires extensive historical defect data collected by sensors is too complicated to establish.
A variety of factors, for example, ferrule raceway waviness, rolling element size difference, roughness, surface quality, bearing structure type, assembly clearance, lubrication condition, installation condition, and working conditions, 4 influence the mechanism of rolling bearing vibration. Therefore, it is very difficult to establish an accurate physical model of REB vibration.
Once a physical model is established, the relevant model parameters cannot be adjusted, which means that the actual degeneration in running states as reflected in the measured signals will not be utilized in real time. 5
Data-driven methods have become a very popular research field in recent years without requirement of the knowledge of the failure mechanism of REB. The data-driven method generally includes the following three steps: (1) data acquisition, (2) extraction of characteristic parameters, and (3) prognostics. Among these steps, feature extraction is the most critical step, because the performance of characteristic parameters has a crucial effect on prediction accuracy.
This article attempts to use the shape parameter in Weibull distribution (WD) to characterize the degradation information of REB during operation. WD 6 is an important mathematical model in the analysis of RUL and the reliability analysis of REB, including two-parameter WD and three-parameter WD. The shape parameter (β) is a very important parameter of the WD which can determine the shape of the distribution curve. The physical meaning of the β can be classified into three major categories:
When the β value is constant, it indicates that the product failure mechanism is unchanged and the degree of failure changes.
When the β value changes continuously, it indicates that the cause of failure of the bearing is the interaction of multiple reasons.
When the β value changes discontinuously, it indicates that there is a mutation in the bearing failure, that is, the cause of failure is mutative and discontinuous.
The shape of the distribution curve changes as the shape parameter (β) changes as shown in Figure 1. When β = 1, WD is close to the exponential distribution. When β = 2.5, WD is close to the log-normal distribution. When β = 3.6, WD approximates the normal distribution. 7 It can be seen from the above analysis that the value of the shape parameter largely depicts the characteristics of the model.

Different shape parameters of WD probability density curves.
Data-driven prediction methods can be classified into three major categories:
Statistical time series modeling approaches.
Computational intelligence approaches.
Chaotic time series prediction methods.
With the development of chaos theory, many chaotic time series prediction methods such as global method, weighted zero-order local method, weighted first-order local method, the improved adding weighted first-order local prediction method (IAWFOLPM), 8 and the based on the largest Lyapunov exponent (LLE) prediction method are used to handle the nonlinear signal which may not be effectively predicted by using other existing methods. All of the chaotic prediction methods are based on the phase space reconstruction (PSR). 9 PSR is used to extend the one-dimensional time series to the high-dimensional, so that the rich information contained in the time series is fully revealed. The key technology of PSR is the selection of delay time (DT) and embedding dimension (ED). Nowadays, there are two main viewpoints among researchers: One of them holds a view that the two are irrelevant; DT and ED are calculated by applying the mutual information method 10 and the Cao method, 11 respectively. On the contrary, there are some researchers hold their opinion that the two are related, and the time window method or C-C method 12 is used to find DT and ED, simultaneously. However, different methods of calculating DT and ED will give different results. Which method is more reasonable? There is no unified answer so far.
At present, many scholars have studied the chaotic characteristics and chaotic prediction of rolling bearings. Chen et al. 13 proposed a mathematical model to study the nonlinear dynamic behavior of high-speed cylindrical bearing cages. Sehgal et al. 14 and Li et al. 15 considered the interaction relationship between bearing assemblies and proposed a reliability prediction method based on state-space model to monitor the evolution of probability density distribution of degradation parameters and the reliability of the future state. Wang et al. 16 proposed a deep feature extraction method for rolling bearing fault diagnosis based on empirical mode decomposition and kernel function. Zhang et al. 17 studied a new metric of chaotic spatial structure: chaotic singular spectrum and proposed an early fault recognition algorithm for rolling bearings based on chaotic singular spectral features. Based on Grey relation, weighted first-order local method, Grey self-help method, and chaos theory, Xintao et al. 18 established a Grey chaotic prediction model for rolling bearings. Cao et al. 19 proposed a new rolling element bearing fault diagnosis approach based on improved generalized fractal box-counting dimension and adaptive Grey relation algorithm.
Although the above-mentioned method has made a prominent contribution to the analysis and prediction of chaotic characteristics of REB, the chaotic prediction of the characteristic parameters of REB performance degradation trend has not been studied.
In this article, the wavelet method is used to process the raw vibration signal (RVS) series, and the two-parameter WD is employed to establish model of REB by the filtered data, and the shape parameter (β) in the WD is extracted as the bearing performance degradation trend parameter (BPDTP). 20 After obtaining the BPDTP for representing the degradation trend of REB performance, the quantitative analysis and qualitative analysis are carried out between the RVS series and the BPDTP series. The Grey system theory 21 was introduced to fulfill the quantitative analysis. Finally, PSR of the BPDTP series is performed by mutual information method and Cao method, and the chaotic prediction is performed by IAWFOLPM.
The remainder of this article is organized as follows: in section “Analysis of BPDTP,” the model of BPDTP is established and the Grey relationship between BPDTP series and time series of performance is analyzed. In section “Chaotic characteristics analysis of BPDTP series,” the chaotic characteristics of BPDTP series are analyzed with PSR and LLE. In section “IAWFOLPM,” the improved adding weighted first-order local prediction method is analyzed. In section “Experimental verification: accelerated bearing life test,” the experiments and data sets are introduced, and the chaotic parameters and the forecasting results obtained by different parameters are given in detail. Section “Conclusion” presents the conclusions.
Analysis of BPDTP
Wavelet denoising
During the service of the rolling bearing, the vibration signal is periodically sampled. The time variable is defined as t and the data sampling time period is ω, which is a constant with a small value. The time series of rolling bearing vibration performance can be expressed as

where x0(t) is the tth data of the time series and N is the total number of vibration data.
The large amount of noise hidden in the time series of REB vibration signal will have a bad influence on the reliability of the model. In this article, the raw data are processed by wavelet denoising method.
Suppose we wish to recover x from REB vibration noisy data as proper as possible

where t = 0, 1, 2, …, N − 1, n(t) is the standard Gaussian white noise, independent and identically distributed, denoted by n(t) ∼ (i.i.d.) N(0,1), and σ is the noise level.
The denoising procedure involves three steps, which are given as follows:
Apply wavelet transform to the signal x0(t) and get the wavelet coefficients
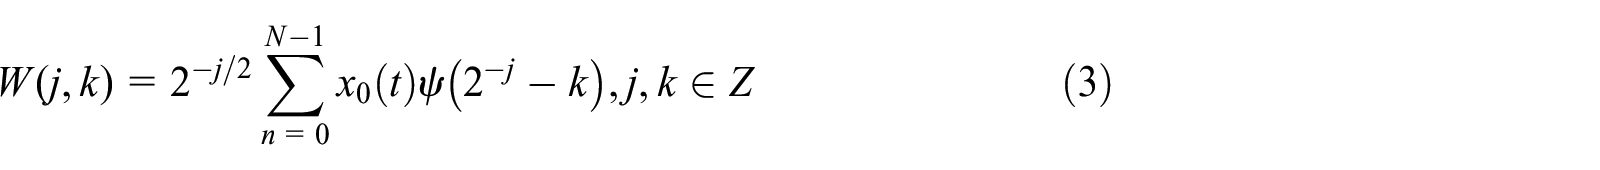
where W(j, k) are the wavelet coefficients.
Choose a threshold (use a heuristic variant of Stein’s unbiased risk) and apply soft thresholding to the wavelet coefficients.
Reconstruct the wavelet coefficients thresholded and get the denoised signal.
A new time series of vibration performance of REB can be expressed as

where x(i) is the ith data of the time series and N is the total number of vibration data.
Extraction technology of BPDTP
WD is the most widely used model in reliability analysis in recent years, including two-parameter WD and three-parameter WD. In this article, the two-parameter WD is used to model, and the distribution function is

The probability density function is
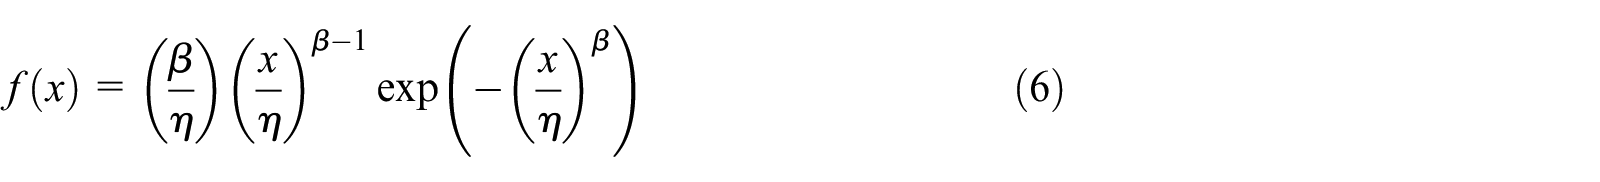
where β, η > 0; β is the shape parameter and η is the scale parameter.
The WPP diagram is used to determine whether the time series X = {x(1), x(2), …, x(i), …, x(N)} of REB vibration performance can be characterized by a two-parameter WD. Specific steps are as follows:
Sort the data in ascending order and record it as X1 = {x1(1), x1(2), …, x1(i), …, x1(N)}.
Calculate equation: t(i) = ln(x1(i)), y (i) = ln(ln (1 − F(x1(i)))−1).
Draw the graph of (t(i), y(i)) on the coordinate paper, and the obtained graph is the WPP diagram. If the graph is substantially a straight line, the time series can be modeled by the two-parameter WD.
In this article, the maximum likelihood method is used to estimate the parameters β and η. In order to eliminate the influence of error when using the maximum likelihood method for parameter estimation, the parameter β is corrected by the correction method. 22 The modified formula is as follows

where βU is the modified value and β is the maximum likelihood estimation value.
{x(1), x(2), …, x(q)} is selected from {x(1), x(2), …, x(i), …, x(N)} to perform two-parameter Weibull modeling, and β1 is obtained by using the maximum likelihood method, and then, {x(1), x(2), …, x(q), x(q + 1)} is selected from {x(1), x(2), …, x(i), …, x(N)} to perform modeling, and β2 is obtained. According to this method, the sequence of BPDTP can be obtained

where M = N − q.
The Grey relationship between BPDTP series and the RVS series
The Grey system theory was employed to fulfill the quantitative analysis of the relationship between BPDTP series and the RVS series.
The RVS series is expressed as

The BPDTP series of REB is expressed as

The RVS series and BPDTP series are normalized, and then, the Grey correlation degree is calculated. The specific steps are as follows.
The normalization formula is

where i ∈ (1,2), n = 1,2, …, M.
The normalized generation sequence Gi of Φ i is as follows

In the case of poor information, for any n = 1,2, …, M, if Gi is a normalized sorting sequence, the element of the reference sequence GΩ can be a constant 0, and the reference sequence can be expressed as

Grey correlation coefficient can be expressed as

where △Ωi (n) = |gi (n) − gΩ (n)| is Grey difference information.
Define the Grey correlation degree as

Define the Grey difference between the two sorting sequences Φ1 and Φ2 as

For a given Φ1 and Φ2, when ε ∈ (0,1], there is always a unique real number dmax = d1,2max, so that d1,2 = dmax, and dmax is the maximum Grey difference, and the corresponding ε is called the optimal resolution coefficient based on the maximum Grey difference.
Define the attribute weight based on the Grey relation between the two sorting sequences Φ1 and Φ2 as

where f1,2 ∈ [0,1], η ∈ [0,1].
According to the Grey system theory, under the given criteria, λ is the representative of the true element. For equation (17), take λ ∈ [0, 1]. If there is a map f1,2 ≥ λ, Φ1 and Φ2 can be considered to have the same property, that is, λ which is called the fuzzy number is the boundary of the research object transitioning from one extreme property to the other extreme. When λ = 0.5, the Fuzziness of the two subjects reaches the maximum, which means that the two subjects are difficult to distinguish; when λ > 0.5, the Grey relationship between Φ1 and Φ2 tends to be clear. When λ < 0.5, the relationship between the two things is small or the difference between the two is large, so take f1,2 = λ = 0.5 and consider that BPDTP and the time series of REB performance have the same attributes.
Let η ∈ [0,0.5], from equation (17), dmax = (1 − f1,2) η can be obtained. And then, the Grey confidence level (Grey theory probability) is obtained as follows

P 1,2 describes the credibility about the attributes of Φ1 and Φ2 is same; η values can be obtained by equation (18). The higher the value of the Grey confidence level, the closer the relationship between BPDTP and the RVS series. On the contrary, the lower the value of the Grey confidence level, the looser the relationship between the two. In the specific implementation, let f1,2 = 0.5, and the correlation degree between the two is evaluated by calculating the Grey confidence level. If the Grey confidence level is not less than 90%, it is considered that BPDTP is closely related to the RVS series; otherwise, it is not close.
Analysis of chaotic characteristics
PSR
A chaos attractor can assess whether a time series is chaotic or not; thus, the PSR is a key step in chaotic time series analyses. For a given time series {x(i), i = 1,2, …, N}, N is the length of the sequence, and selecting a DT τ and an ED m, the phase space can be expressed as follows
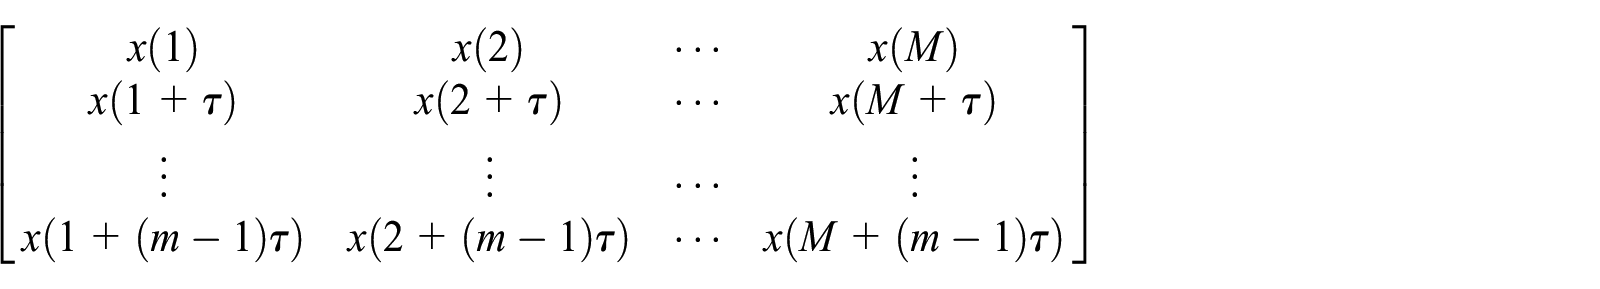
The phase point in the phase space can be expressed as

where i = 1, 2, …, M, M = N − (m − 1)τ.
Using mutual information method to determine DT
For the time series {si}, the Ps(si) indicates the probability of the occurrence of the variable si, and then, the average information amount of the system to the variable si is the information entropy of the system, referred to as entropy, and the calculation formula is as follows

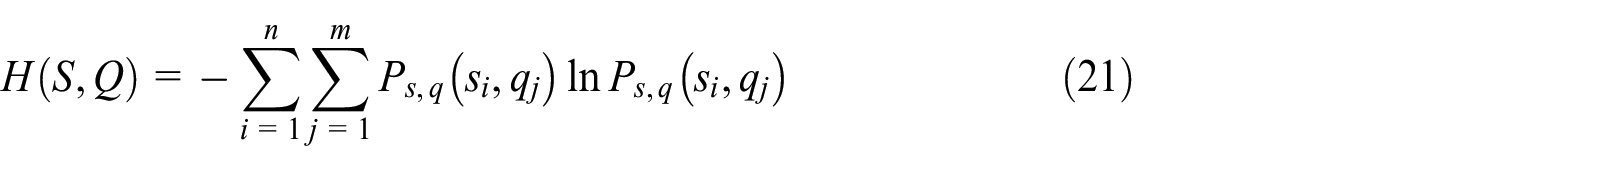
For two sets of signals {si, qj}, Ps(si, qj) is the joint probability distribution of the variable si, qj, and then, their joint entropy is
For a coupled system (S, Q), assuming S is known and the Q can be calculated by the formula as follows

So, mutual information of S, Q can be calculated by the formula as follows

Therefore, in order to obtain the DT, different DT τ can be taken to sequentially calculate mutual information

It can be seen from equation (24) that mutual information is a function of DT. The size of I(τ) represents the certainty size of system Q in the case of known system S. In general, the first minimum value of I (τ) is regarded as the DT τ.
Using Cao method to determine ED
The Cao method determines the ED by increasing the ED and observing the change in the distance between adjacent points. If the distance between two adjacent points does not change with the increase in the ED m, then the m is regarded as the optimal ED. When the ED is m, the phase points in the phase space are expressed as

There is a nearest point of Xj

The Euclidean distance between Xi and Xj is

We define


Observe the change in E1(m) value. When m is larger than a certain m0, the magnitude of E1(m) changes very little or no longer changes, and then, m = m0 + 1 is the minimum ED of the PSR.
LLE
In practical engineering applications, the LLE (λ) is estimated to determine whether the time series of the object under study has chaotic characteristics. If λ > 0, the system has chaotic characteristics; if λ = 0, the system has a periodic phenomenon; if λ < 0, the system has a stable fixed point.
For one-dimensional mapping

Let the neighbor value of the initial value x0 be x0 + δx0. After n iterations according to equation (28), the distance between the two points is

This shows that the two points are separated exponentially. In the above formula, λ is the Lyapunov exponent and expressed as

IAWFOLPM
After the PSR of the BPDTP series, the improved adding weighted first-order local prediction method (IAWFOLPM) is used to fulfill the chaotic prediction. Let the neighboring point of the center point Xk (the starting point of the prediction) be Xki, i = 1,2, …, q (q is an integer, which depends on the size of the specified proximity distance). The distance from Xk to Xki is di, and let dmin be the minimum value in di. Define the weight of point Xki as
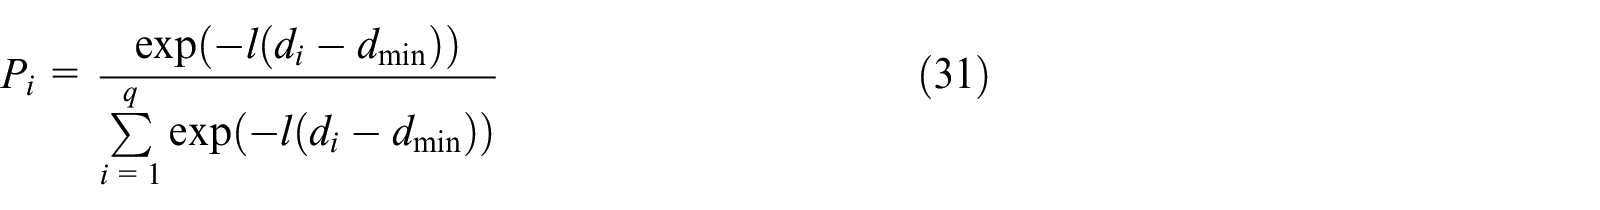
where l = 1.
With a first-order fit of the last component of the delay component, the first-order local linear fit is

where m is the ED, i = 1,2, …, q, and Xki(m) is the last value of the component Xki, e = (1, 1, …,1) T .
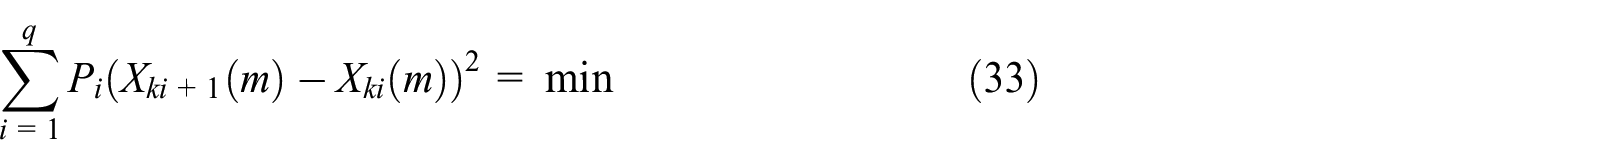
Using the weighted least squares method (equation (33)), the values of a and b can be obtained, and then, one-step predictive value can be obtained from equation (32)
Experimental verification: accelerated bearing life test
Experimental setup
In order to verify the effectiveness of the proposed method, an experimental verification is performed with ABLT-3-accelerated bearing life tester. The basic layout of the test rig is shown in Figure 2. It consists of monitoring system, transmission system, loading system, lubrication system, computer control system, and so on. The test condition is shown in Table 1. For the vibration signals, the recording frequency was set to 300 Hz, which means that vibration data were recorded every 5 min. And 1340 vibration data were recorded in total. The accelerated life test was carried out successively until the crest factor of vibration signal over-passed the set value. The RVS series is shown in Figure 3.

The experimental setup of the REB test system.
The test condition of the REB test system.

REB: rolling element bearings.

The raw vibration signal (RVS) series.
Feature extraction
It can be seen from Figure 3 that the root mean square (RMS) of the bearing vibration data slightly decreases and then slightly increases between 0 and 50 h, which corresponds to the natural run-in period of the bearing. RMS of the bearing vibration data between 50 and 100 h is nearly constant corresponding to the optimal operation of bearing; afterward, RMS of the bearing vibration data begins to increases until the failure of the bearing which corresponds to the deterioration of the bearing. The experimental data objectively reflect the running condition of the rolling bearing.
Since the vibration data collected by the sensor contain noise which can affect the accuracy of the model, Wavelet denoising is used as an effective tool for vibration signal processing. As can be seen from Figure 4, the denoising data are smoother than the raw data and maintain the trend of fluctuation. In addition, as can be seen from the second graph in Figure 4, the BPDTP (β) of the bearing vibration data slightly increases during the natural run-in period of the bearing and then is nearly constant during the optimal operation period of the bearing and afterward begins to increase until the failure during the deterioration period of the bearing. The trend of the BPDTP (β) is almost consistent with the trend of REB operational condition reflected by the experimental data.

The denoising data and the BPDTP(β).
In addition, as can be seen from Figure 5, the WPP diagram of the denoising data is basically a straight line, which indicates that the denoising data can be modeled by the two-parameter WD model.

The WPP diagram of the denoising data.
In order to quantitatively explain the correlation degree between the BPDTP and the time series of the performance, the Grey relationship analysis is carried out by using equations (9)–(18). The Grey confidence level between the BPDTP and the time series of the performance is 91.55% under the condition of f1,2 = 0.5, which indicates that the relationship is very close. It is very reasonable to use BPDTP (β) to evaluate the performance degradation trend of REB, because the level of confidence reaches 91.55%. From the above analysis, it can be known that the conclusions from qualitative analysis and quantitative analysis are consistent. The shape parameter (β) can be used to characterize the degradation information.
Chaotic characteristics analysis
The mutual information method is used to find the DT. We set τmax = 100, as can be seen from Figure 6, when the DT is 3, the mutual information function obtains the first minimum value, so τ = 3 is considered as the optimal DT. The Cao method is used to find the ED. The E1(m) curve of BPDTP(β) is shown in Figure 7, which pointed out that the value of E1(m) tends to be almost constant when m > 7. Therefore, m = 8 is the ED which will be used to reconstruct the phase space.

Mutual information function curve.

E 1(m) curve.
The LLE (λ) is obtained by the small data method as shown in Table 2. From Table 2, it can be found that the BPDTP series belongs to a chaotic sequence because the value of λ is positive; thus, the IAWFOLPM can be applied to BPDTP series to predict the future BPDTP points. We can also apply the above methods to the REB vibration signal, and the results of chaotic parameters of bearing vibration signal are shown in Table 3. It can be observed from Table 3 that λ = 0.0039 > 0, which means that the REB vibration signal is chaotic, as well.
Chaotic parameters of BPDTP (β).

BPDTP: bearing performance degradation trend parameter; DT: delay time; LLE: largest Lyapunov exponent.
Chaotic parameters of bearing vibration signal.

DT: delay time; LLE: largest Lyapunov exponent.
The BPDTP series has a total of 1240 points, and we use the 1140 points of the BPDTP series to build prediction model, and the last 100 points of the BPDTP series are used to verify the effectiveness of the IAWFOLPM.
Chaotic prediction analysis
The predicted values of the BPDTP series generated by the IAWFOLPM are illustrated in Figure 8, and the predicted values of the RVS series generated by the IAWFOLPM are illustrated in Figure 9. The forecasting relative error of the BPDTP series is shown in Figure 10, and the forecasting relative error of the RVS series is shown in Figure 11. It can be seen from Figure 10 that the maximum relative error is less than 0.03%, and the minimum of relative error is almost 0. From Figure 11, it can be observed that the maximum of relative error is more than 20%.

Results of forecasting for BPDTP series using the IAWFOLPM.

Results of forecasting for RVS series using the IAWFOLPM.

The forecasting relative error of BPDTP series.

The forecasting relative error of RVS series.
The quantitative evaluations of the predictive results are shown in Table 4, and it can be observed in all the cases that mean relative error and maximum of relative error of the BPDTP series are considerably lower than the RVS series, which clear shows that the IAWFOLPM for BPDTP series has high accuracy. According to the results, one can clearly notice that the chaotic prediction based on the BPDTP series has higher prediction accuracy than the RVS series–based method. These results further support the claims that the BPDTP series is useful for the chaotic prediction of REB.
The quantitative evaluations of the predictive results using different methods.

BPDTP: bearing performance degradation trend parameter; RVS: raw vibration signal.
Furthermore, in order to analyze the influence of DT (τ) and ED (m) on the prediction accuracy of IAWFOLPM, we additionally choose seven groups of parameter of DT and ED. The forecasting error distribution of BPDTP series is shown in Figures 12 and 13, and the mean relative error is shown in Figure 14. It can be observed in all cases, which are (τ = 3, m = 8), (τ = 5, m = 8), (τ = 7, m = 8), (τ = 1, m = 8), (τ = 3, m = 4), (τ = 3, m = 6), (τ = 3, m = 10), and (τ = 3, m = 12); the errors and the mean relative errors are almost same, respectively.

The forecasting errors distribution of BPDTP series.

The forecasting errors distribution of BPDTP series.

Mean relative error of BPDTP series.
Therefore, in the prediction of the BPDTP series using the IAWFOLPM, the value of DT (τ) and ED (m) has little effect on the prediction accuracy. That is to say, the prediction accuracy of the IAWFOLPM in the BPDTP series is hardly dependent on the value of DT and ED, and the robustness of the IAWFOLPM is very good.
Conclusion
In this article, a degradation feature extraction method based on WD is proposed. The feasibility of using the shape parameter of the two-parameter WD as the BPDTP is verified, and the shape parameter can accurately reflect the running state of the rolling element bearing. Experimental results reveal that the RVS and the BPDTP series are chaotic, so the improved adding weighted first-order local prediction methods were used for chaotic prediction of them. Results obtained from this research are follows:
The relation between the RVS series and the BPDTP series is very close because the Grey confidence level is 91.55%, and the value of the BPDTP (β) obtained from the WD can depict the running condition of rolling element bearing.
Compared with the RVS, the chaotic prediction of the BPDTP (β) series has high prediction accuracy.
In the prognostics of the BPDTP series, the value of DT (τ) and ED (m) has little effect on the prediction accuracy.
Footnotes
Declaration of conflicting interests
The author(s) declared no potential conflicts of interest with respect to the research, authorship, and/or publication of this article.
Funding
The author(s) disclosed receipt of the following financial support for the research, authorship, and/or publication of this article: This research is supported by the National Natural Science Foundation of China (Grant No. 51475144) and Natural Science Foundation of Henan Province of China (Grant No. 162300410065).