
Abstract
During the design of pavement structures, determining a reasonable thickness for pavement layers is critical. When an expressway is to be built in an area with a poor soil foundation, a reasonable subgrade treatment will make the pavement more durable. However, determining the optimal thickness of subgrade treatment is a difficult task for designers. A thicker treatment means a huge cost increase for the project, whereas a thinner treatment cannot achieve significant improvement in the mechanical behavior of pavement structures. This study used the finite-element method to analyze the mechanical response of real field pavement with subgrade treatments at certain depths. The study used an orthogonal design and gray relational theory to analyze the design indicators and make a better design for the pavement structure of a field expressway. The numerical calculation index and theoretical analysis results show that the treatment depth of subgrade soil has a significant influence on the stresses in an asphalt pavement structure and the bottom tensile strains of the asphalt layers. Therefore, designing a pavement structure with equal structural strength, using a reasonable depth for the cement-treated subgrade, instead of increasing the asphalt layer’s thickness, is a more cost-effective solution.
Keywords
Introduction
At present, in the construction process of highway subgrades, builders often encounter the phenomenon of stress concentration caused by an insufficient subgrade soil layer, which causes early damage to the pavement structure. In engineering, a common technique is the use of lime to treat bad subgrade sections to improve the soil-based elastic modulus. The effect of the treatment has been recognized by designers in the industry.1–3 However, factors such as lime treatment, roadbed depth, and reasonable thickness of each layer of pavement structure have great influence on the pavement stress and strain design index.4–6 So far, little research has been conducted on the relationship between the depth of lime-treated soft soil subgrades and the internal stress of asphalt pavement structures. The lime-treated soft soil subgrade in the actual project is blind and random. For example, during the design and construction, regardless of the thickness of the pavement structure layer of the asphalt, a treatment depth is selected according to the designer’s experience to improve the subgrade soil. As a result, the rebound modulus of the top of the road is too small, and the pavement structure is easily damaged. If the processing depth is too great, it increases costs. Therefore, this study investigated the relationship between subgrade depth treated with lime and pavement structure according to the characteristics of the pavement structure. It is particularly important to determine the reasonable depth of lime-treated soil to guide design and construction.7–9 Therefore, article takes the Changchun–Fuyu Expressway reconstruction and expansion project as an example. Through indoor and outdoor experiments and finite-element (FE) numerical simulation analysis, we studied the influence of the depth of lime treatment for the internal stress and strain of the pavement structure and proposed a reasonable thickness of the pavement structure of each layer for analysis by using gray correlation theory.10–12 The results of this study hold great practical significance for improving design specifications, ensuring road engineering quality, and saving engineering construction costs.
FE model of pavement structure
The study used the FE software ANSYS17.0 for numerical simulation calculation. The FE analysis was carried out for a given flexible base asphalt pavement structure. The orthogonal test design method was used to analyze the factors affecting the mechanical response of the pavement structure.
Loads and forms of action
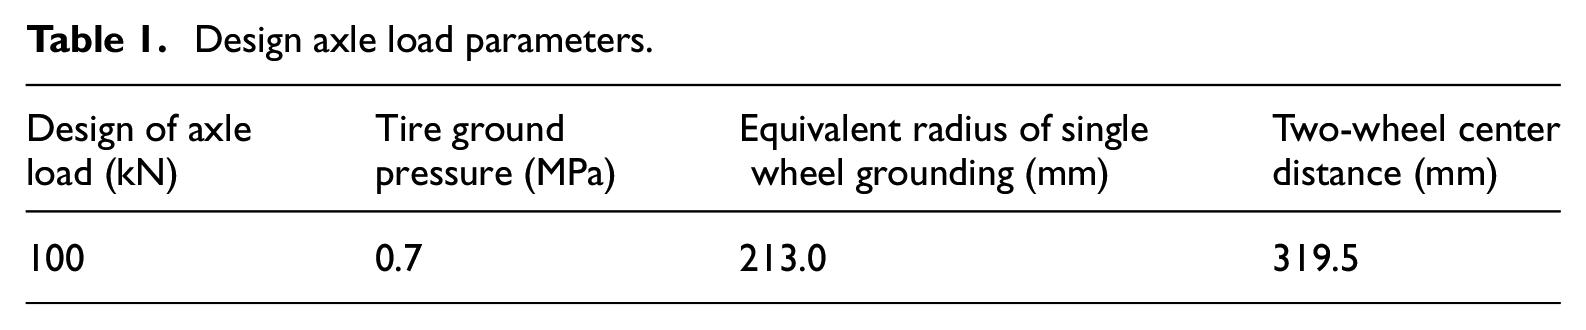
The pavement model uses a 100 kN single-axis double wheel as the design axle load, and the calculated axle load parameters are determined according to Table 1.
Design axle load parameters.
Pavement geometry model and boundary conditions
Figure 1 shows the pavement structure used for FE calculation. The dimensions of the 3D model are 10 × 7.5 × 4 m. In the typical structure of traditional pavement, a cold recycled asphalt ATB-25 flexible base layer is added to form a composite pavement structure.13–15 The material parameters and thickness parameters are shown in Table 2.

Asphalt pavement structure model and grid division diagram.
Pavement structure layer thickness and material composition.

For convenience of analysis, the pavement FE model is based on four boundary conditions: The surface of the pavement structure is used as a free surface without any constraints, the model has no displacement in the x-axis direction of the two sides along the advancing direction of the vehicle, there is no displacement in the y-axis direction on both sides in the width direction, and the bottom surface of the model has no displacement along the z-axis. The pavement structural material is defined as a nonlinear material, the viscoelastic material of the asphalt pavement is calculated by the Prony series, and the elastoplastic material of the subgrade soil is calculated by the Drucker–Prager model. Drucker–Prager model parameters are listed in Table 2, and Prony model parameters are listed in Table 3. 16
Prony model parameters.

Determination of control indicators and program
Determination of control indicators
According to the latest asphalt pavement design specifications in China, antideformation performance and antifatigue cracking performance of asphalt concrete are two important design indicators for asphalt pavement design. Therefore, the difference in depth of subgrade treatment will affect the performance of the road surfaces against rutting, and shear stress is the main factor causing rutting. Therefore, we take the shear stress of the asphalt layers and the asphalt stabilized base layer as indicators. In addition, the bottom tensile strain of the asphalt layer and asphalt stabilized base layer, as well as the bottom tensile stress of the cement-treated base layer, are important indicators reflecting the antifatigue cracking performance of the structural layer. For this reason, we also include these three indicators in the stress control index system.
Determination of orthogonal factors
Many factors affect the structural performance of asphalt pavement. We selected four factors as the influencing factors of the stress calculation: the improvement depth of subgrade soil, thickness of the asphalt layer, thickness of the asphalt-stabilized base layer, and thickness of cement-treated base layer. We measured each factor at three levels and from these data obtained a four-factor, three-level test form. To efficiently determine the influence of soil depth on the structural stress of pavement, this article uses the L9-(34) orthogonal test analysis method to analyze and calculate the influencing factors. Factor levels and orthogonal experimental schemes are shown in Tables 4 and 5.
Factors and levels.

Orthogonal scheme.

Gray relational calculation and analysis
This study uses the asphalt layers shear stress, asphalt stabilized base shear stress, asphalt layer tensile strain, asphalt stabilized base tensile strain, and inorganic binder stabilized base layer tensile stress as reference factors for the design of highway asphalt pavement structures. The orthogonal experimental model is used to determine the gray correlations degree between soil depth, shear stress, and tensile stress. The main control indicators for the depth of ground improvement are determined mathematically.
This article takes the typical design structure for an expressway in Northeast China as the basis of analysis. The shear stress of the asphalt surface layer, the layer bottom strain of the asphalt mixture, the tensile strain of the flexible base layer, and the tensile stress of the inorganic binder layer are taken as design parameters. Mathematical gray relational analysis is used to determine the main control indicators of subgrade processing depth.
Interval processing of raw data
According to the orthogonal scheme, nine test results are calculated for each control index, such as defining shear stress of asphalt upper layer, as follows

All the others are determined in the same way, and the calculation results are summarized in Table 6.
Stress calculation results and gray correlation calculation definition data column summary table.

The number of values after the interval value processing is calculated according to equation (1)

Difference sequence
The absolute difference between each index of the object to be evaluated (comparison sequence) and the corresponding element of the reference sequence is calculated one by one

Finding the maximum difference and the minimum difference between the two poles of each column
The range is calculated according to equations (3) and (4), min Δi(k) = 0, max Δi(k) = 1


Calculating the correlation coefficient
According to equation (5)

The correlation coefficients of the corresponding elements of the comparison sequence and the reference sequence are calculated, respectively, where ρ is the resolution coefficient and takes the value in (0-1). If ρ is smaller, the difference between the correlation coefficients is larger, and the discrimination ability is stronger. In this article, ρ is taken as 0.3, and the calculation results are summarized in Figure 2.

Relationship between resolution coefficient and correlation.
The correlation coefficient between the corresponding elements of the comparison sequence and the reference sequence is ranked according to the correlation coefficient of the soil depth improvement according to various factors: 0.6064 > 0.5668 > 0.4481 > 0.4355> 0.4171 > 0.4168, and γ1 > γ2 > γ6 > γ4> γ5 > γ3 can be obtained.
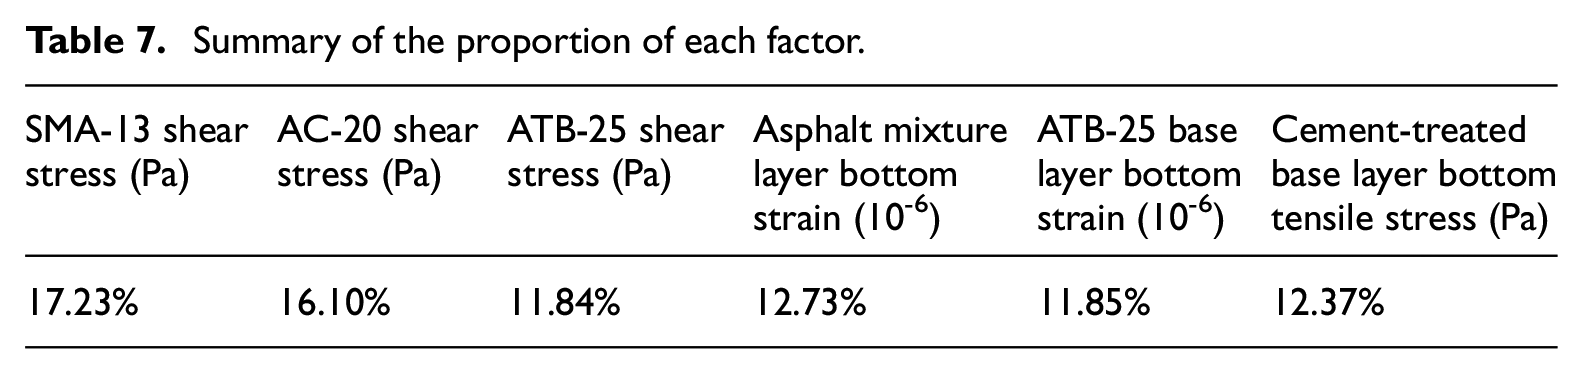
Calculate the proportion of the importance of each factor
After the calculation of the correlation coefficients, the proportion of the importance of each factor can be indicated in Table 7.
Summary of the proportion of each factor.
Analysis of orthogonal experimental results
In this article, we need to examine four test factors at the same time. If a comprehensive test is carried out, the scale of the test will be large, and it is often difficult to implement because of the limitations of the test conditions. Orthogonal test design is a high-efficiency test design method that arranges multifactor tests and seeks the optimal combination of levels.
According to the results of gray correlation analysis, the orthogonal test method is used to distinguish the primary and secondary order of the influence of various factors on the mechanical indicators and to determine the optimization plan (that is, what level of each factor is considered to meet the requirements of the test indicators), analyze the relationship between factors and indicators, and determine the rules and trends of indicators with factors.
The better the road performance, the lower the stress strain. To objectively evaluate the performance of each experimental model, and find the best experimental combination, this article proposes two calculation parameters, bki and Yk. The calculation process is as follows:
Determining the calculation coefficient bki
Calculate the variation range of each indicator, that is, the difference D between the maximum value and the minimum value, and calculate the correlation coefficient as bki = ratio/D. The results are summarized in Table 8.
Range of variation of various indicators and calculation of correlation coefficient table.

Comprehensive evaluation of pavement performance
According to Yk = ∑bki × Xki (K = 1, . . ., 9; i = 1, . . ., 6), 17 the performance index of each FE model is calculated and the results are given in Table 9.
Orthogonal test performance index summary table.

Because the degrees of freedom of ABCD are the same, both are r – 1 = 2, so the squared size can be used to represent the mean square size to judge the relative size of each factor (see Figure 3). 18

Comparison of the significance of each factor.
It can be seen in Figure 3 that the main order of the factors (main → sub) is as follows: DBAC, thickness of the inorganic binder stabilized base layer → thickness of the asphalt layer → depth of the subgrade soil improvement → thickness of the ATB base layer.
The relationship between various factors and the pavement performance index is shown in Figures 4 –7.
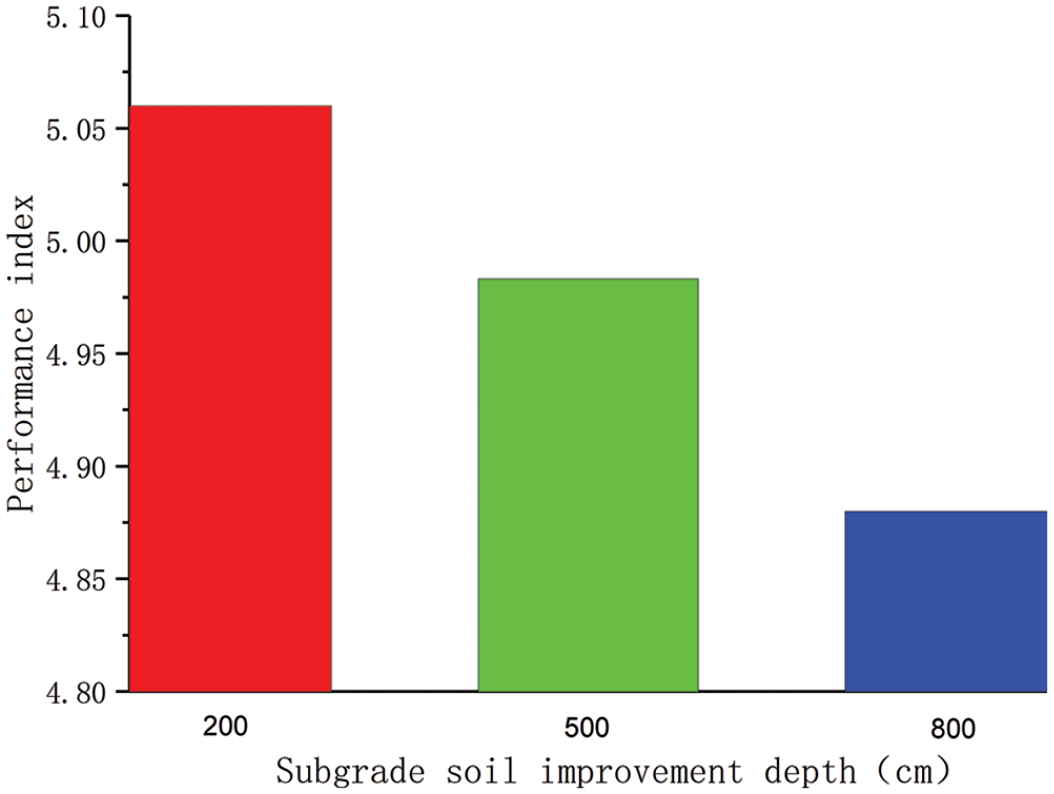
Effect of subgrade soil improvement depth on the pavement performance index.

Influence of asphalt layer thickness on the pavement performance index.

Effect of ATB-25 base thickness on the pavement performance index.

Effect of cement-treated base layer thickness on the pavement performance index.
The thickness of each structural layer of asphalt pavement is one of the most important indexes of pavement design. If pavement structure layer is too thin, the internal stress and strain of the structure are too great, and if the pavement structure layer is too thick, the pavement cost will be too high.
Therefore, given a certain modulus parameter for each structural layer, finding a reasonable thickness is an important part of pavement structure design.
According to the uniform and comparable properties of the orthogonal test design, two observations can be made from the above data and diagrams:
The thickness of the ATB-25 base layer has little effect on the stress and strain of the asphalt pavement structure, indicating that the effect of an increase in the asphalt pavement layers and thickness of the ATB-25 base layer on the overall performance of the pavement is not as high as the increase in cost. The design can be selected with reasonable thickness according to the relevant specifications. The subgrade improvement depth has a great influence on the stress and strain of asphalt pavement structure. When the subgrade improvement depth is 200 cm, the performance index is 5.06; when the subgrade improvement depth is 500 cm, the performance index is 4.9833; when the subgrade improvement depth is 800 cm, the performance index is 4.88. It shows that with the increase in subgrade improvement depth, the strength of the subgrade is improved, and the overall variation of stress and strain inside the pavement structure is gradually reduced. The thickness of the inorganic binder-stabilized base layer also affects the stress and strain of the asphalt pavement structure. As the thickness of the inorganic binder layer increases, the internal stress and strain of the pavement structure first decrease and then increase. When the thickness of the inorganic binder is 580 cm, the internal stress and strain values of the pavement structure are the lowest.
The lower the stress and tensile strain, the better the structure and material combination. Therefore, the lowest values of K1, K2, and K3 are selected, and the optimal combination is A3 B1 C1 D2. When the modified subgrade soil depth is 800 cm, the asphalt layer thickness is 10 cm, the ATB-25 base layer thickness is 80 cm, and the inorganic binder-stabilized base layer thickness is 580 cm; it is the optimal structure and material design combination. Compared with the conventional design method, the stress and layer tensile strain obtained by the gray correlation analysis method are lower, and the obtained structure and material combination are more reasonable. Considering that the asphalt layer thickness and the thickness of ATB-25 have little effect on the internal stress and strain of the pavement structure, from the perspective of cost performance, the final structural scheme of the Changchun-Fuyuyu Expressway Reconstruction Project includes 11 cm for the asphalt layer thickness and 120 cm for the ATB-25 base layer thickness.
Failure mechanism analysis
Cement-treated material base layer
The fatigue cracking life prediction of the cement-treated layer can be calculated according to equation (6), when obtained from the tensile stress of the cement-treated layer. The values of the parameters in equation (6) can be found in Table 10.

Fatigue life model parameters of cement-treated layer.

According to the design of the pavement structure, the fatigue cracking life (axial order) of the inorganic binder stable layer is greater than the design cumulative axis 183,838,500 times (prediction of traffic based on design report), meeting the specification design requirements.
Hot mix asphalt layer permanent deformation
Similarly, a permanent deformation prediction model for hot mix asphalt(HMA) layer can be expressed in equation (7). The model parameters' values can be found in Table 11

Permanent deformation prediction model parameters of HMA layer.

HMA: hot mix asphalt.
The permanent deformation of the HMA layer is calculated according to equations (7) and (8)

where Ra is permanent deformation of the HMA layer, Rai is the permanent deformation of each layer, and [Ra] is the permissible permanent deformation in design code (all in millimeters).
According to the research in this article, the optimal thickness combination of pavement structure is obtained, and the permanent deformation of HMA layer and the fatigue of cement-treated layer can meet the specification requirements.
Conclusions
The thickness of the cement-treated base layer has the greatest influence on the stress of asphalt pavement structures and the bottom strain of the asphalt layer. Second in order of significance is the thickness of the asphalt layer, followed by the depth of subgrade soil improvement. The influence of the thickness of the ATB-25 base layer is the lowest.
The optimum structure and material design combination of the asphalt pavement from the Changchun–Fuyu Expressway is selected when the depth of soil improvement is 800 cm, the thickness of the asphalt layer is 10 cm, the thickness of the ATB-25 base layer is 80 cm, and the thickness of the cement-treated base is 580 cm.
According to the previous design ideas, the stress and strain of asphalt pavement structures gradually decrease with the increase in depth of the structure layer. According to the results of the orthogonal test, increasing the thickness of the asphalt layer has little effect on the stress and strain of the pavement interior, and the reasonable thickness of cement-treated material must to be calculated.
Note that the conclusions obtained in this study are mostly suited to the specified loading, material, and pavement sections. However, the analysis scenario proposed in this article can be used to determine a reasonable treated subgrade thickness when treatment of the subgrade is necessary in pavement construction.
Footnotes
Acknowledgements
The authors thank Zhao Han from Ji Lin Traffic Planning and Design Institute (Changchun), and Dr. Chen Songqiang and Dr. Chen Zining from Harbin Institute of Technology (Harbin) for their contributions to this article in testing of subgrade modulus parameter.
Declaration of conflicting interests
The author(s) declared no potential conflicts of interest with respect to the research, authorship, and/or publication of this article.
Funding
The author(s) disclosed receipt of the following financial support for the research, authorship, and/or publication of this article: The author(s) thanks the financial support from National Nature Science Foundation of China (51878229).