
Abstract
Objectives:
Understanding the differential burden of pediatric SARS-CoV-2 infection by social factors is important to guide public health action. We evaluated the associations between county-level social vulnerability and infection-induced SARS-CoV-2 antibody seroprevalence and how associations changed over time.
Methods:
We analyzed pediatric national serosurvey data from 50 US states, the District of Columbia, and Puerto Rico from September 2021 through December 2022 (N = 216 273). Specifically, we estimated adjusted prevalence ratios (APRs) of SARS-CoV-2 antibody seropositivity across terciles of overall county Social Vulnerability Index (SVI) scores and vulnerability scores across the 4 SVI domains: socioeconomic status, household characteristics, racial and ethnic minority status, and housing and transportation. We conducted multilevel mixed-effects Poisson models with robust variance estimation of the association of seropositivity with scores for SVI and its domains over time, adjusting for age, sex, rural/urban status, US Census region, and county vaccination rates.
Results:
In September 2021, children residing in the highest (APR = 1.4) and medium (APR = 1.2) tercile counties by SVI score were more likely to have serologic evidence of past SARS-CoV-2 infection than those residing in the lowest tercile counties. This association attenuated over time; domain-specific vulnerability scores for socioeconomic status and household characteristics displayed similar associations and temporal patterns.
Conclusions:
Our findings demonstrate the dynamic nature of pediatric health during a public health emergency. The results reinforce the importance of data systems that allow public health agencies to be responsive through tailored strategies to support children experiencing the greatest health effects, thereby advancing opportunities for all people to attain their highest level of health.
SARS-CoV-2 outcomes have differed across US demographic groups.1-8 The causes of these findings are likely multidimensional. For example, the environments where people are born, live, learn, work, play, and age have been shown to affect a range of health, functioning, and quality-of-life outcomes and risks.9,10
The Social Vulnerability Index (SVI) quantifies the multidimensional nature of social vulnerability by incorporating data on various socioeconomic indicators. SVI is a county-level measure of a community’s vulnerability in disasters, designed to help emergency response and public health professionals identify communities most in need of support during emergencies.9,11 The 2020 SVI measures 16 indicators under 4 broad social vulnerability domains: socioeconomic status (SES), household characteristics, racial and ethnic minority status, and housing type and transportation. 11
While past analyses of COVID-19 outcomes found that children from racial and ethnic minority groups and those from socioeconomically disadvantaged backgrounds had higher case counts, hospitalization rates, and mortality rates than White children and children from better-resourced socioeconomic backgrounds,12-14 few studies have examined pediatric COVID-19 outcomes by SVI. Additionally, to our knowledge, no large-population US pediatric studies have used data on SARS-CoV-2 antibody seroprevalence to study associations with SVI. Previous analyses of seroprevalence by SVI have focused on adults.2,15
Many prior COVID-19 analyses by SVI have relied on case surveillance data,4-6,16,17 which would not capture unreported asymptomatic or mild cases. Asymptomatic or mild clinical presentations are more common among children than adults; these presentations became more prevalent after the emergence of the Omicron variant beginning in late 2021 than previously during the pandemic.18,19 Increased use of home COVID-19 tests during the Omicron period could have underestimated the number of infected people, which would further the limitations of case surveillance data.20-22 Seroprevalence data can provide a more comprehensive estimate of the proportion of a population that has been infected with SARS-CoV-2 than estimates based on reported case counts, because infected individuals produce infection-induced antibodies regardless of whether they receive a diagnosis or their case is reported. 23 Moreover, while a few studies have explored the temporal trends of differential burden of COVID-19 by SVI for all ages,4,17 little research has investigated these temporal trends in the pediatric population.2,24
To address these gaps, we analyzed the infection-induced SARS-CoV-2 antibody seroprevalence of residual clinical blood specimens drawn from children and adolescents (aged 0-17 y) in the United States for clinical testing from September 6, 2021, through December 11, 2022. Our study aimed to assess (1) the associations between county-level social vulnerability and infection-induced SARS-CoV-2 antibody seroprevalence and (2) the temporal change of these associations.
Methods
Specimen Data Collection
In the National Commercial Laboratories Seroprevalence (NCLS) study, 25 we collected residual patient sera from individuals who had blood samples processed for routine screening (eg, cholesterol) or clinical management by 3 commercial laboratories in 52 jurisdictions: the 50 US states, the District of Columbia, and Puerto Rico. Specimens were excluded if tests had been ordered to ascertain SARS-CoV-2 infection status. Commercial laboratories selected a convenience sample of residual sera for each jurisdiction during each data collection period, aiming for 325 specimens from children aged 0 to 11 years and 325 from adolescents aged 12 to 17 years.
From September 2021 through February 2022, each data collection period was 4 weeks, and the survey included adult and pediatric samples. Beginning in March 2022, each data collection period was 8 weeks, the survey included only pediatric specimens, and specimens from infants younger than 6 months of age were excluded because of the potential presence of maternal antibodies.
All pediatric specimens were tested for the presence of anti-nucleocapsid (anti-N) antibodies to SARS-CoV-2 via a pan-immunoglobulin immunoassay (Elecsys Anti-SARS-CoV-2; Roche). Anti-N antibodies are produced in response to past infection but not in response to vaccination with any COVID-19 vaccine approved or authorized in the United States. The sensitivity of the test is 100% (95% CI, 88.3%-100.0%) and specificity is 99.8% (95% CI, 99.7%-99.9%), 26 with an estimated mean time to seroreversion of 737 days after infection. 27 The data associated with each specimen included patient age, sex, state, zip code of patient residence, and specimen collection date. We linked the specimen data to county based on zip codes. If a zip code spanned multiple counties, we assigned the county with the largest population. Prior studies have documented additional methodological details.22,23
Social Vulnerability Index
We merged the specimen data with county-level 2020 SVI 11 data by using county Federal Information Processing Series codes. 28 County SVI scores and domain-specific vulnerability scores include 16 indicators based on data from the American Community Survey 2016-2020. 29 To classify counties in the sample by tercile, we referenced their percentile rankings among all counties nationwide for the overall social vulnerability score and the domain-specific vulnerability scores corresponding to the 4 constituent domains of the SVI. For example, a classification in the high vulnerability tercile for the racial and ethnic minority status domain indicates that a county is among the top third of counties nationwide in terms of the percentage of racial and ethnic minority populations (Table 1). 11
Social factors used to evaluate overall Social Vulnerability Index score and 4 domain-specific vulnerability scores in a study of the association between social vulnerability and infection-induced SARS-CoV-2 anti-N antibody seroprevalence among children, United States, September 2021–December 2022
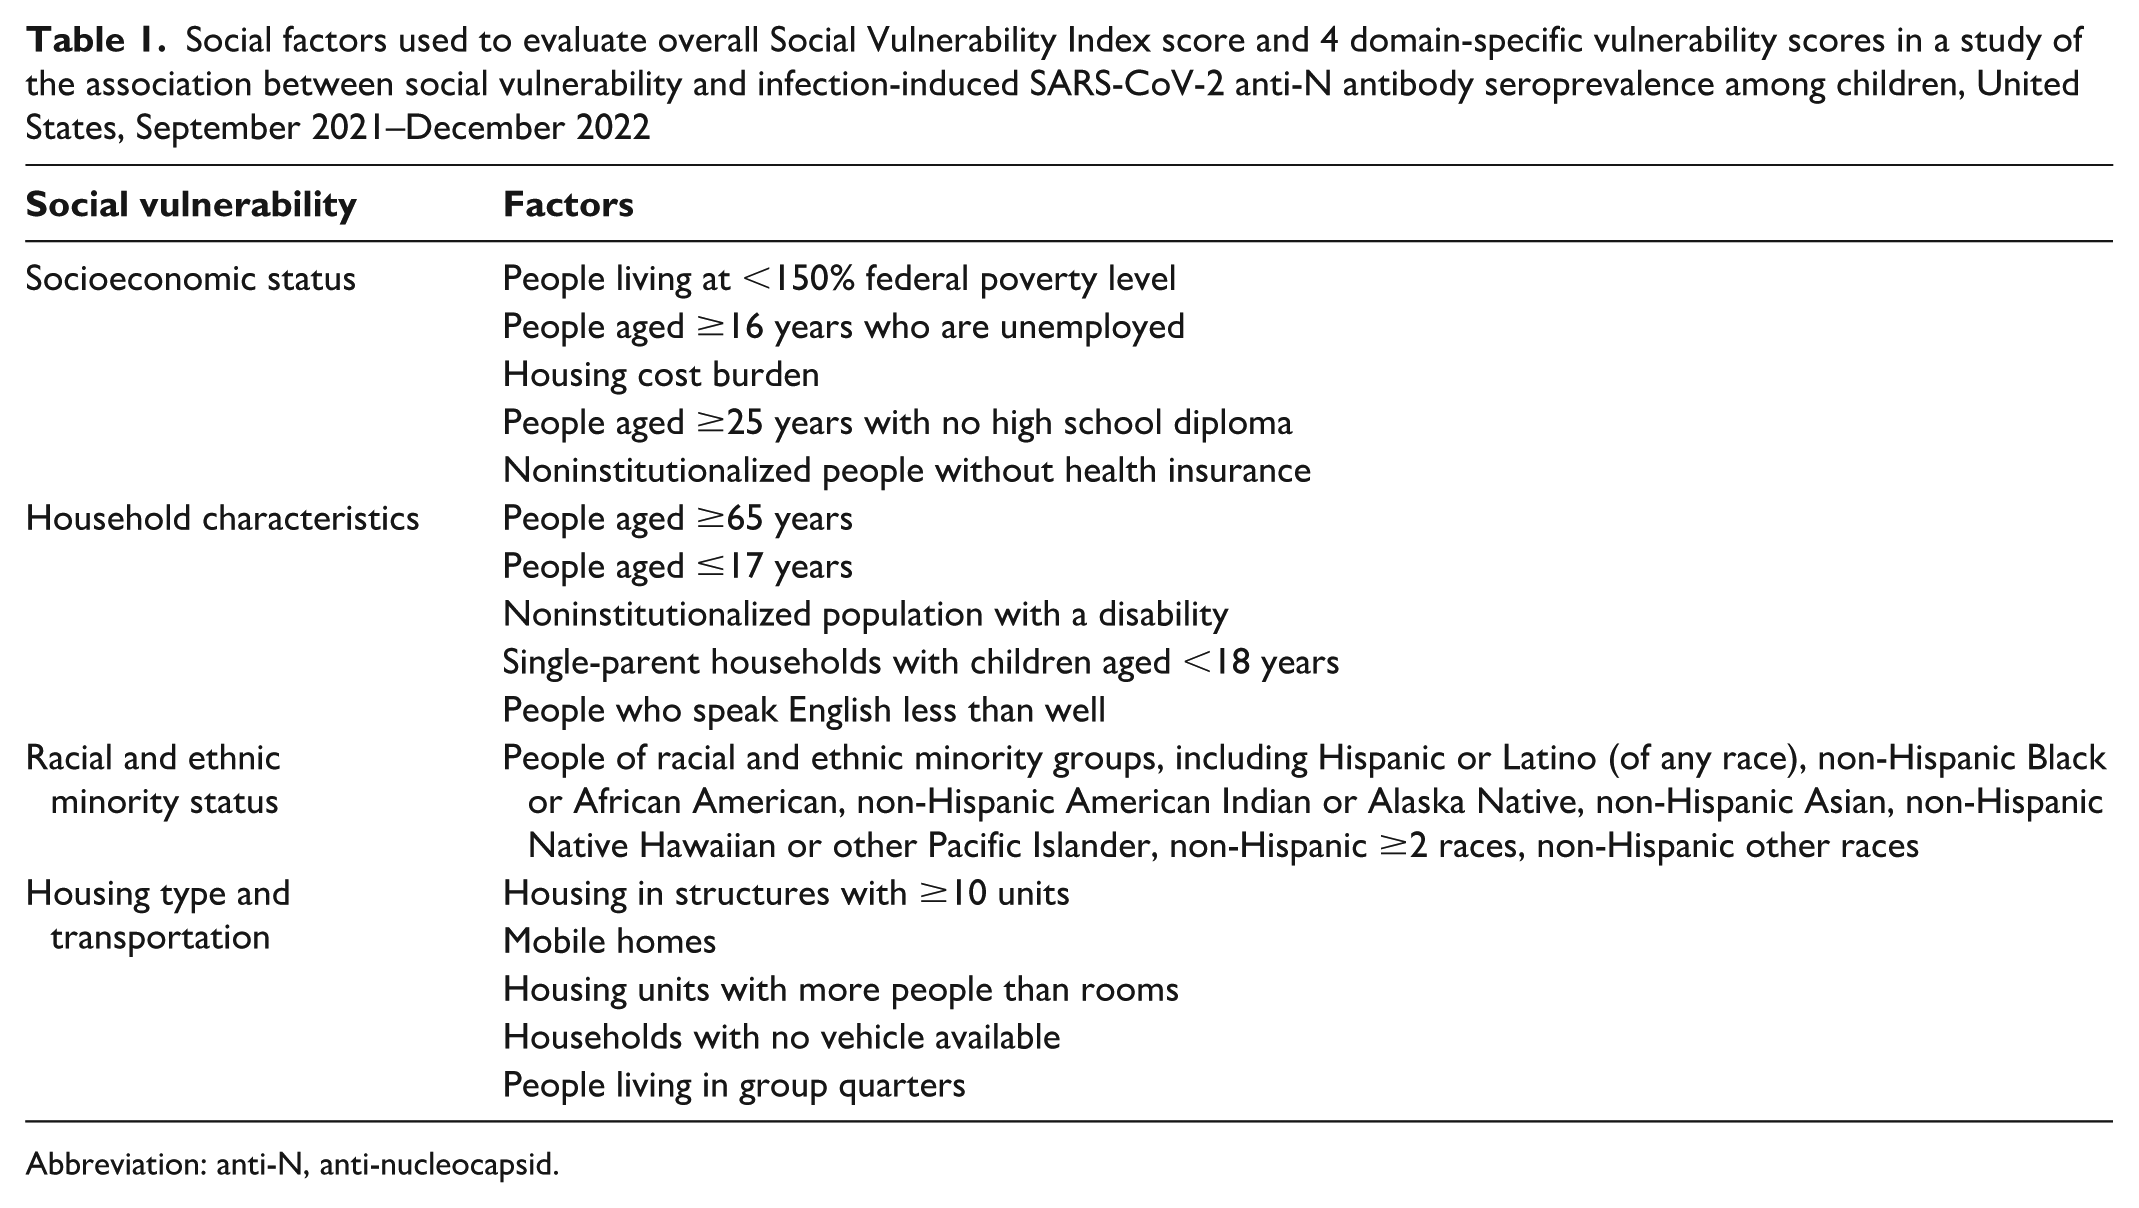
Abbreviation: anti-N, anti-nucleocapsid.
Statistical Analysis
We first compared the demographic characteristics of the population contributing specimens in our analytic sample with the demographic characteristics of the US pediatric population according to the 2020 US Census. 30 We performed bivariate analyses using the Pearson χ2 test across all data collection periods to estimate the unadjusted association of SARS-CoV-2 anti-N antibody seroprevalence with county-level social vulnerability, including analyses based on the overall SVI scores and analyses focused on the 4 domain-specific vulnerability scores. To contextualize these data, we also analyzed the age group–specific pediatric vaccination rates for COVID-19 by county-level vulnerability.
To assess the adjusted association between past infection, defined by SARS-CoV-2 anti-N antibody seropositivity, and the social vulnerability of the county of residence, we developed 2 mixed-effects Poisson models, using robust variance estimation to account for potential overdispersion and to provide more conservative estimates for significance testing. Each model included 3 independent variables: the first variable represented the date that the specimen was drawn, the second represented the social vulnerability of the county of residence, and the third was the interaction term between the first 2 independent variables. We computed the adjusted prevalence ratios (APRs) of the probability of specimen seropositivity for high and medium social vulnerability terciles as compared with the low social vulnerability tercile, with 95% CIs.
We used data collection month to examine temporal trends. Specimens collected during December 1-11, 2022, were combined with those collected in November 2022 because of the small sample size. We defined the Delta period as September 1–November 30, 2021; the early Omicron period as December 1, 2021–March 31, 2022; and the late Omicron period as April 1–December 31, 2022. 31 County social vulnerability was captured in 2 ways: model A included the overall SVI tercile, and model B included the terciles of all 4 social vulnerability domains to consider the independent effects of the domains
Additional fixed effects included US Census region and county-level vaccination rates by age group (<5, 5-11, and 12-17 y), as well as demographic characteristics such as age group, sex, and metropolitan status according to 2013 Rural–Urban Continuum Codes classification. 32 For county-level vaccination rates, we used the cumulative percentages of children in each age group who had received ≥1 dose of COVID-19 vaccine as of November 10, 2022. Vaccination data from this date were used for all applicable analyses because of limited availability of age-specific county-level vaccination data.
We included counties as random effects with random intercepts to account for the heterogeneity of seropositivity across US counties. Although the random intercept was not significant at the 95% CI level in the models, we retained the mixed-effects models to adjust for minimal county-level variability.
We conducted all data cleaning and analysis procedures in SAS version 9.4 (SAS Institute Inc). This activity was reviewed by the Centers for Disease Control and Prevention (CDC), was conducted consistent with applicable federal law and CDC policy (eg, 45 CFR part 46; 21 CFR part 56; 42 USC §241[d], 5 USC §552a, 44 USC §3501 et seq), and was considered not research. As such, it did not require review by the Human Research Protection Office. Because we used deidentified residual specimens, consent was not required.
Results
Our analytic sample comprised SARS-CoV-2 infection–induced antibody results from 216 273 specimens of residual sera drawn from children and adolescents aged <18 years in 2584 US counties from September 6, 2021, through December 11, 2022. The proportion of adolescents aged 12 to 17 years (56.4%) was higher in our analytic sample than in the 2020 US Census pediatric population (35.5%). The urban–rural distribution in the analytic sample (urban, 85.9%; rural, 14.1%) closely mirrored the US Census pediatric population (urban, 86.4%; rural, 13.6%) (Table 2).
Characteristics of children and adolescents aged ≤17 years with blood specimens in a study of the association between social vulnerability and infection-induced SARS-CoV-2 anti-N antibody seroprevalence among children and adolescents, United States, September 2021–December 2022 a
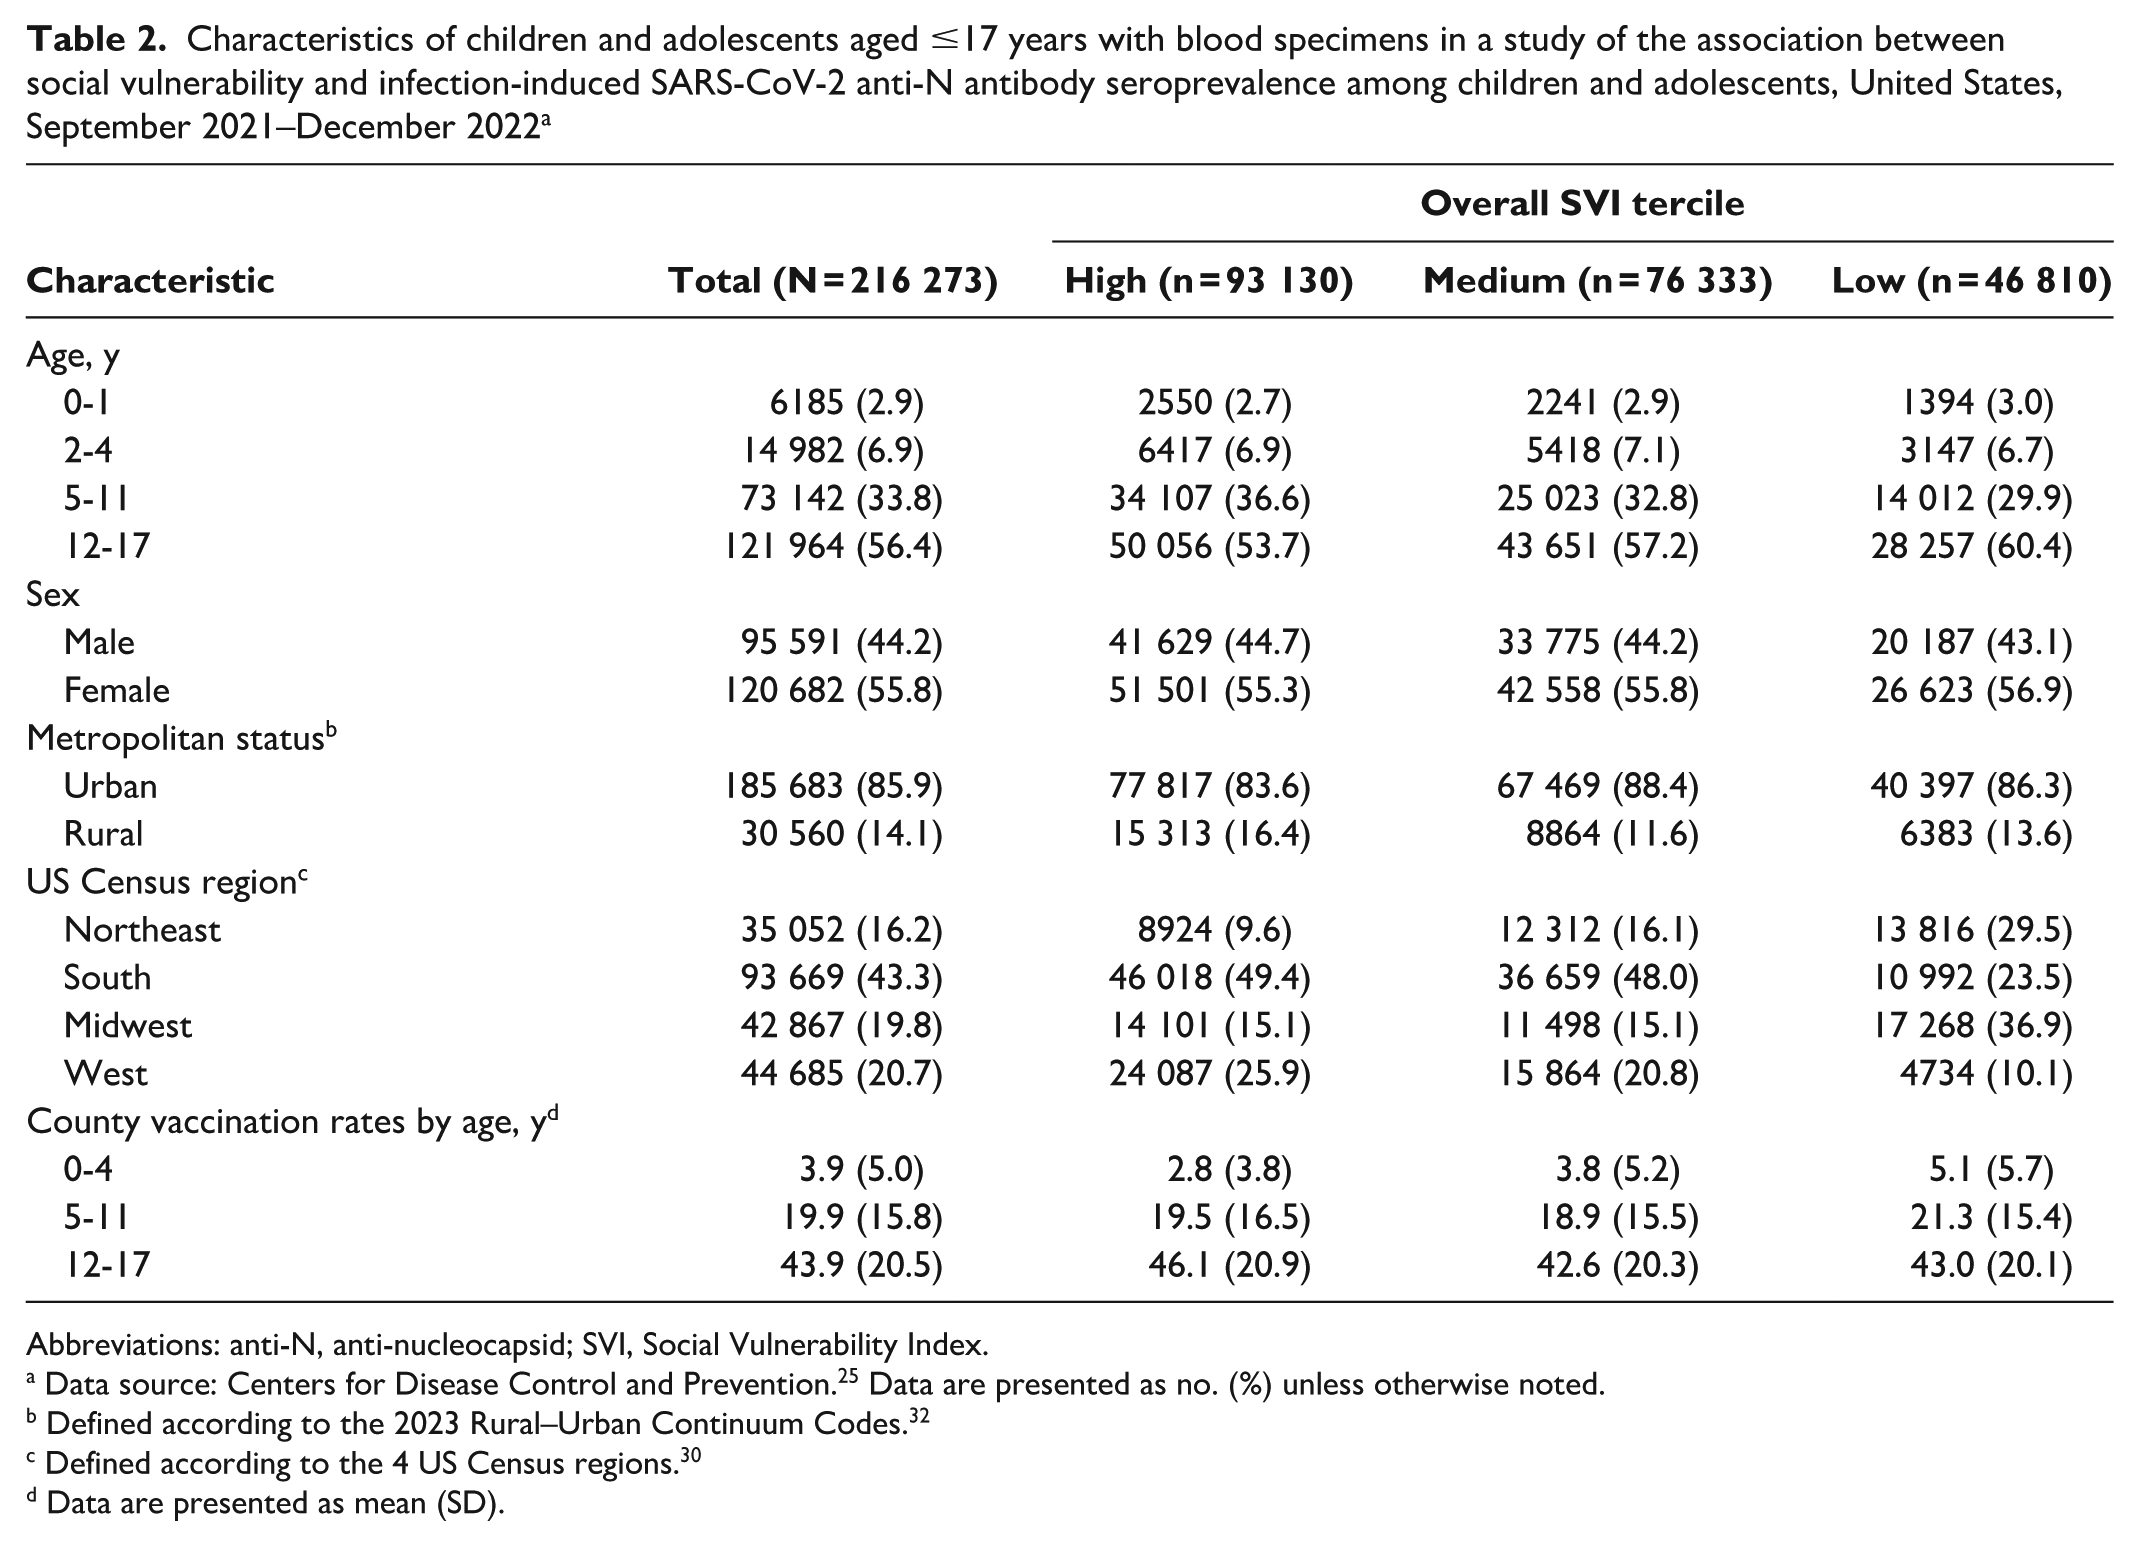
Abbreviations: anti-N, anti-nucleocapsid; SVI, Social Vulnerability Index.
Data source: Centers for Disease Control and Prevention. 25 Data are presented as no. (%) unless otherwise noted.
Defined according to the 2023 Rural–Urban Continuum Codes. 32
Defined according to the 4 US Census regions. 30
Data are presented as mean (SD).
Bivariate analysis of data aggregated throughout the study period showed that the unadjusted SARS-CoV-2 anti-N antibody seroprevalence was higher among children in counties in the highest tercile for overall SVI score than among children in counties with lower SVI scores (Figure 1). Higher domain-specific vulnerability score terciles were associated with increased seroprevalence for 2 domains: SES and household characteristics. In analyses of county-level COVID-19 pediatric vaccination rates, mean rates were highest in counties in the lowest tercile for the domain-specific vulnerability scores for SES and household characteristics.
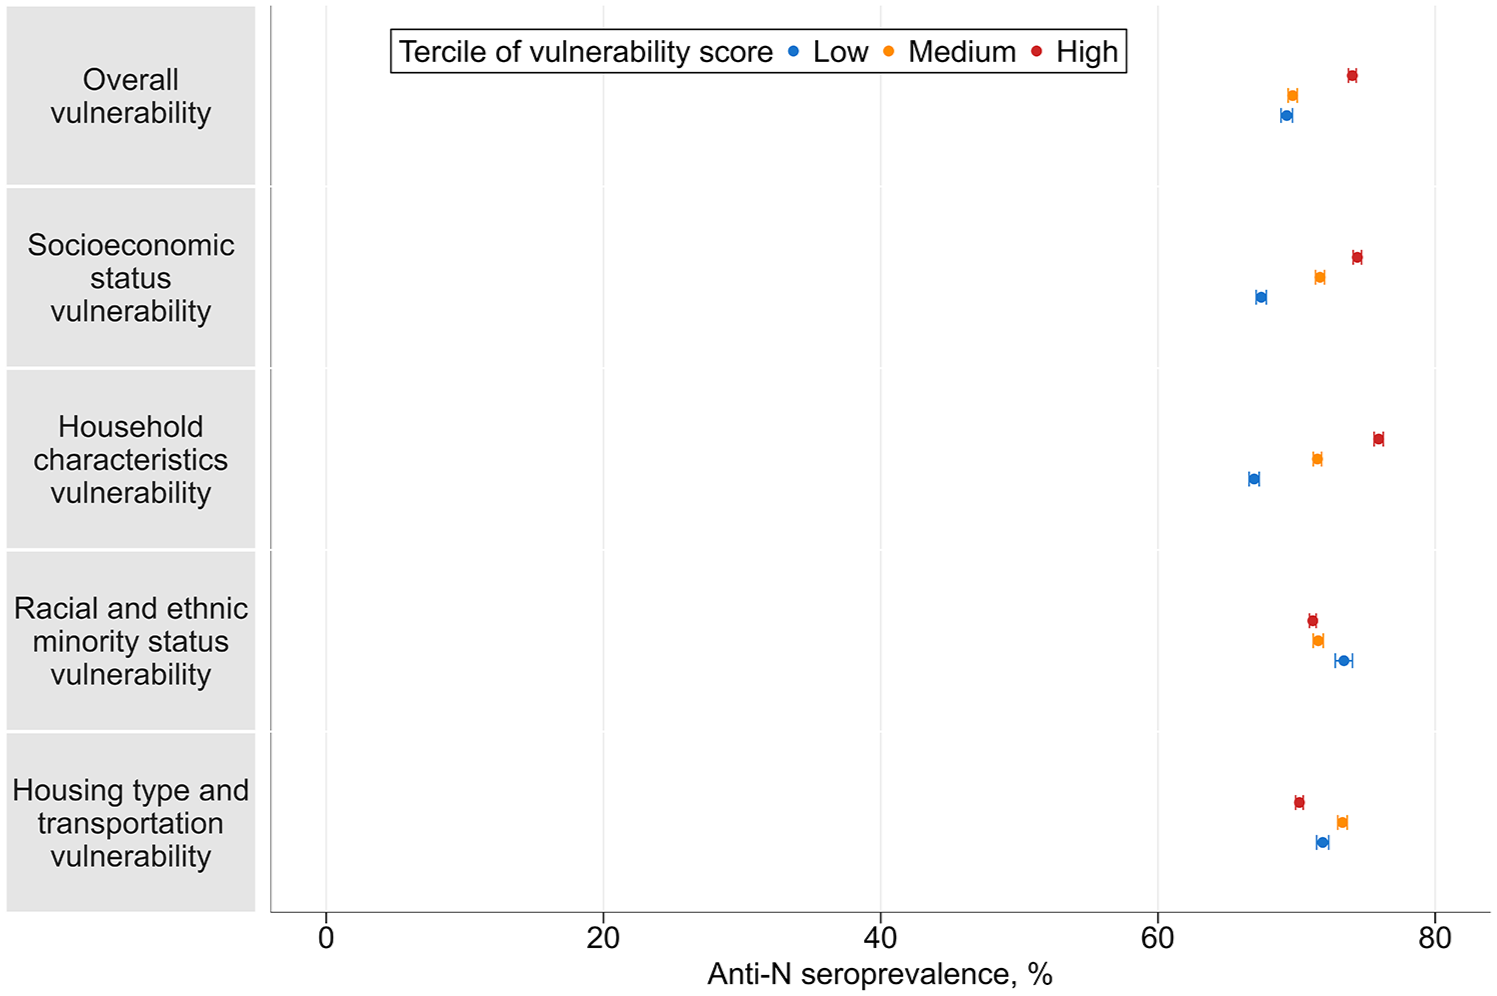
Unadjusted infection-induced SARS-CoV-2 anti-N antibody seroprevalence by tercile of overall SVI and social vulnerability domains in a study of the association between social vulnerability and infection-induced SARS-CoV-2 anti-N antibody seroprevalence among children and adolescents aged ≤17 years, United States, September 2021–December 2022. Error bars indicate 95% CIs. Tercile levels of vulnerability scores were based on counties’ percentile rankings among all counties nationwide. Abbreviations: anti-N, anti-nucleocapsid; SVI, Social Vulnerability Index. Data source: Centers for Disease Control and Prevention. 25
Results differed for the other 2 domains in the bivariate analysis. For the housing type and transportation domain, the estimated seroprevalence was lowest in counties in the highest tercile for domain-specific vulnerability scores. For the racial and ethnic minority status domain, seroprevalence was lower for counties in the highest and medium terciles for domain-specific vulnerability score as compared with counties in the lowest tercile. In the county-level pediatric COVID-19 vaccination rate analyses for these domains, the mean child vaccination rates were highest in counties that were in the highest tercile for the domain-specific vulnerability scores for racial and ethnic minority status and housing type and transportation (eFigure 1 in Supplement).
Model A, which included the overall SVI tercile (Figure 2A), showed the temporal changes of the APRs of high- and medium-SVI tercile counties in relation to low-SVI tercile counties. Overall, the positive association between a higher probability of specimen seropositivity and higher overall SVI score tercile was strongest in September 2021 (APR = 1.42; 95% CI, 1.29-1.57), and the association weakened over time. We observed no significant associations of overall county SVI score and infection-induced SARS-CoV-2 antibody seropositivity in October–November/December 2022.
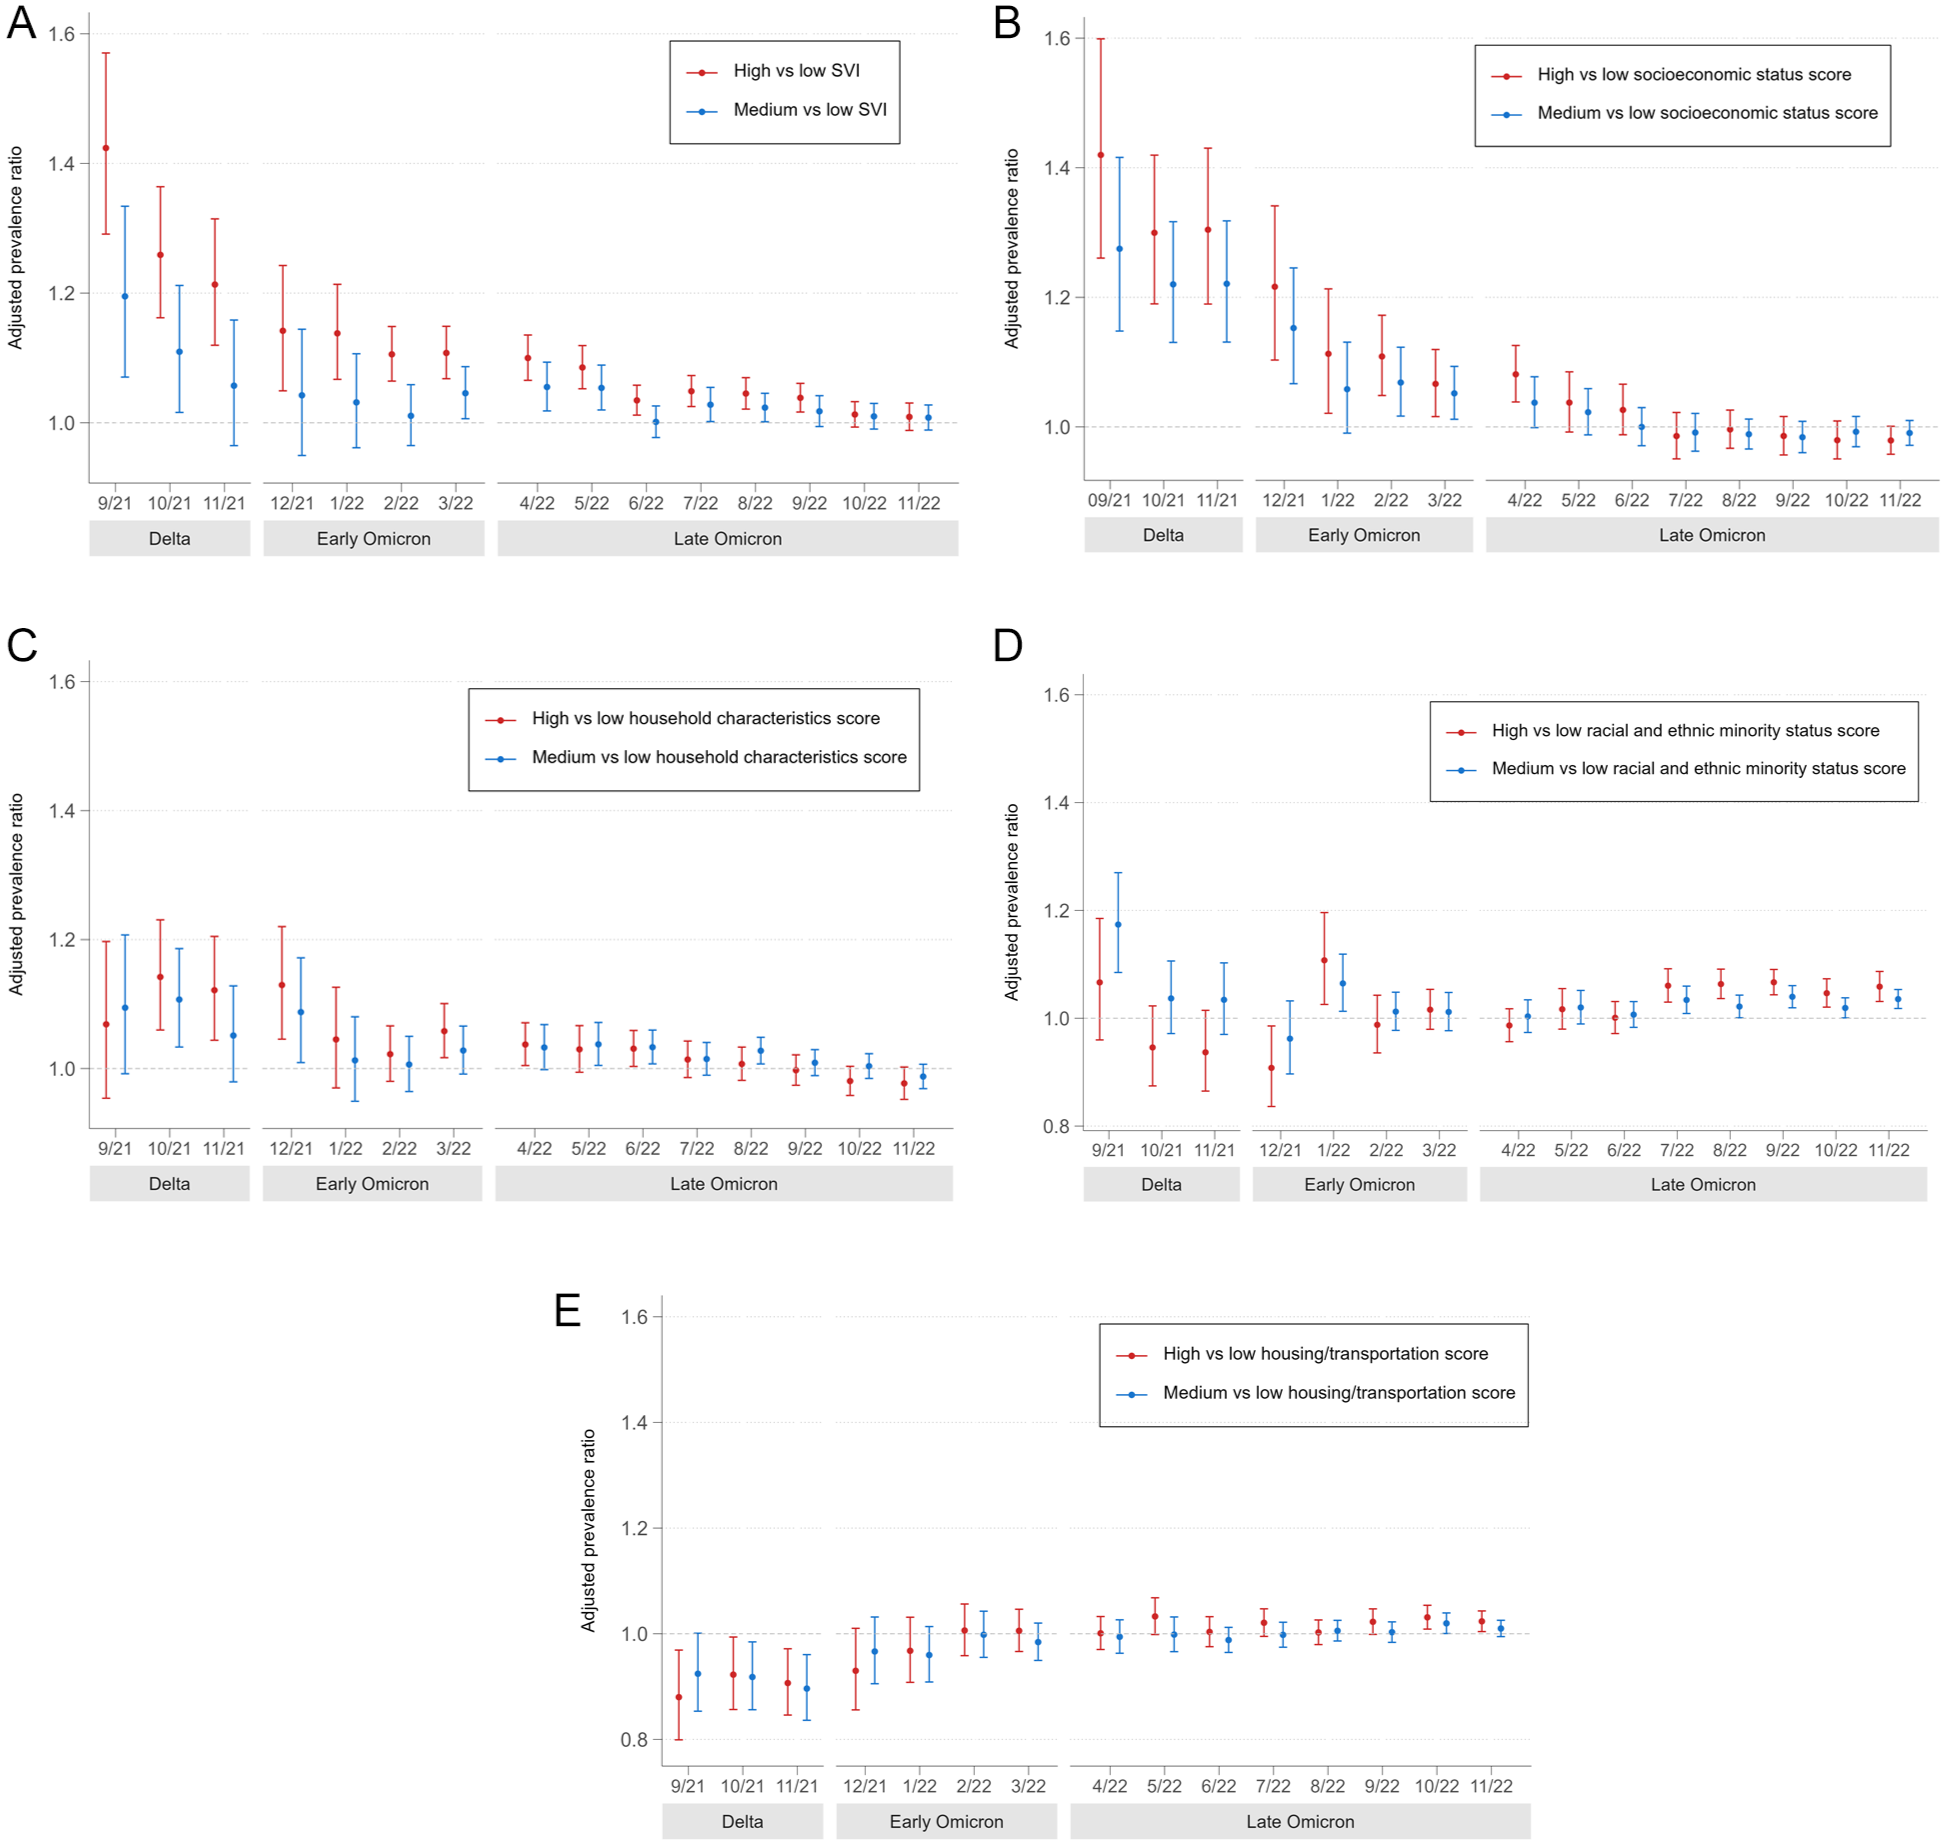
Adjusted prevalence ratios by data collection month for the association between tercile by county social vulnerability and SARS-CoV-2 anti-N antibody seropositivity in a study of the association between social vulnerability and infection-induced SARS-CoV-2 anti-N antibody seroprevalence among children and adolescents aged ≤17 years, United States, September 2021–December 2022. Error bars indicate 95% CIs. (A) Overall SVI: model A analysis. (B) Domain-specific vulnerability score for socioeconomic status: model B analysis. (C) Domain-specific vulnerability score for household characteristics: model B analysis. (D) Domain-specific vulnerability score for racial and ethnic minority status: model B analysis. (E) Domain-specific vulnerability score for housing type and transportation: model B analysis. Multilevel mixed-effects Poisson model with robust variance estimation was conducted to estimate the prevalence ratios by data collection month. Fixed effects included tercile by county-level overall SVI score or scores of 4 component vulnerability domains, data collection month, interaction terms of SVI tercile and data collection month, county-level age group–specific vaccination rates, and individual characteristics (eg, age, sex, metropolitan status of residence, and US Census region). Random effects included county in which specimen was collected. Abbreviations: anti-N, anti-nucleocapsid; SVI, Social Vulnerability Index. Data source: Centers for Disease Control and Prevention. 25
Model B included the 4 domain-specific vulnerability scores by tercile (Figures 2B-2E). During September 2021–April 2022 (Delta and early Omicron periods), a child residing in a county with a higher tercile score on the SES vulnerability domain had a higher probability of being seropositive than did a child residing in a county with a lower SES vulnerability score tercile; however, the association weakened over time. A high county tercile score on the vulnerability domain of household characteristics was associated with a greater probability of specimen seropositivity during October–December 2021; the association attenuated over time, with no significant associations for any comparison after August 2022. For the vulnerability domain of racial and ethnic minority status, the association changed over time without any consistent trend, although a medium or high domain-specific vulnerability score was associated with a higher probability of specimen seropositivity in comparison with a low vulnerability score from July through November/December 2022. In contrast with overall SVI and the SES vulnerability domain, for the domain of housing type and transportation, higher terciles for the domain-specific vulnerability scores were associated with a lower probability of specimen seropositivity from September through November 2021 (Delta period). While this association was reversed for counties in the high vulnerability score tercile in October–November 2022, the effect strength was low.
Discussion
We found a significant association between higher overall social vulnerability and a greater probability of seropositivity for infection-induced SARS-CoV-2 antibodies among US children during September 2021–September 2022, with the association attenuating over time. The vulnerability domain of SES appears to be the most influential in contributing to trends in overall SVI. The vulnerability domain of household characteristics also had similar associations with seropositivity during time periods when the Delta and early Omicron variants predominated. One reason for this association during these periods may be the lower child vaccination rates among counties with the highest vulnerability scores for the domains of SES and household characteristics, which are thought to be related to reduced access to health care services and increased parental vaccine hesitancy.33-35 Previous studies also reported lower vaccination coverage in high-SES vulnerability counties as compared with counties with lower-SES domain-specific vulnerability scores during April–November 2021.36,37 The association remained significant after controlling for vaccination rate. Several other factors may have contributed to the heightened SARS-CoV-2 anti-N antibody seroprevalence in communities with high SES vulnerability during earlier months of the pandemic: individuals with lower education levels were less likely than those with higher education levels to use preventive measures, such as wearing face masks, 38 or have jobs that offered remote work opportunities. 39
The positive association between social vulnerability and SARS-CoV-2 anti-N antibody seroprevalence in children adds to the limited evidence of differential rates of pediatric COVID-19 outcomes.2,14 Our finding that a higher SES and household characteristics vulnerability score was associated with greater infection-induced antibody seroprevalence in an exclusively pediatric sample until April 2022 reinforces and expands on findings from our previous study of earlier NCLS data. 2 In that study, we observed the positive association between social vulnerability and SARS-CoV-2 anti-N antibody seroprevalence consistently across children and adults.
The associations in our study are also consistent with prior studies on all-age or adult data.15,40,41 A study analyzing reported cases of all ages during June 2021–March 2022 across the 50 most populous US counties showed that the spread of COVID-19 was associated with household income and the proportion of residents aged ≥65 years, while socioeconomic factors played the largest role. 40 Another study that analyzed COVID-19 case data in Indiana found that a 1-percentile increase in SVI was significantly associated with a 6% increase in risk of SARS-CoV-2 infection. 41 A study that examined infection-induced SARS-CoV-2 seroprevalence early in the pandemic among blood donor adults found that increased seroprevalence was most strongly associated with the domains of SES and household characteristics. 15
Our findings indicate an attenuation over time in the associations of higher infection-induced SARS-CoV-2 anti-N antibody seroprevalence with greater social vulnerability, including socioeconomic factors and household composition factors. Several factors may explain this attenuation. First, federal and jurisdictional efforts to increase access to resources in more socially vulnerable areas might have contributed to narrowing of differential rates of SARS-CoV-2 infection among children. For example, a study in Missouri found a reduction in differential vaccination rates by overall SVI during December 2020–February 2022. 42 Efforts to increase vaccine availability in rural areas also aimed to reduce differential rates of SARS-CoV-2 infection by rural–urban status. 43 Additionally, the Omicron variant’s higher rate of transmissibility as compared with previous variants and the corresponding surge in infection rates may have increased population immunity, weakening the previously strong association. 6 Furthermore, the return of adults to in-person work and the reopening of schools across the United States during this period may have created more opportunities for infections to spread among a wider array of sociodemographic groups and wider geographic areas, blunting differences by county. 44
The bivariate analysis showed that for the racial and ethnic minority status domain, counties in the highest and medium terciles had lower seroprevalence than counties in the lowest tercile for the domain-specific vulnerability score; higher child vaccination rates in counties in the highest and medium terciles for the race and ethnicity domain–specific score versus counties in the lowest tercile were likely a contributing factor. 45 This association lost its significance in most analytic periods of the multivariable model, which adjusted for multiple factors, including vaccination rates. However, the association was significant for the 5 months closest to the date of the pediatric vaccination data included in the model. The lack of a consistent association for this domain in our study during periods in which the Delta and early Omicron variants predominated aligns with results from a previous study. In that work, COVID-19 incidence rates among Black people were 1.3 to 1.4 times higher than rates among White people during the Delta period but 2.9 to 3.7 times higher during the early Omicron period (December 2021 to early January 2022). 46 Another study observed that differential case rates by race narrowed when infections declined overall, widened again during the initial Omicron variant surge in January 2022, and then attenuated by April 2022. 47
Higher vulnerability scores for the housing type and transportation domains were initially associated with lower seroprevalence, but this association diminished and eventually reversed, although with a small effect size. Some subcomponents of this domain, such as multiunit housing and lack of a vehicle, may reflect urban residency; seroprevalence was lower in urban areas than in rural areas during October 2020–February 2022. 22 While our models adjusted for metropolitan status, the dichotomous measure used may not have fully captured the effects of metropolitan status, which spans a continuum.
Limitations
This study had at least 4 limitations. First, this study used nonprobability sampling. The analytic study sample may not be representative of the general pediatric population; for example, >40% of the sample consisted of specimens from children residing in high-SVI counties. Because assays tested residual clinical specimens, the sample could also be biased toward children with frequent medical visits, such as those with readily accessible health care services or chronic health conditions. Yet, a study using NCLS data showed that children presenting for well-child care and children presenting for sick visits and other types of care did not have clinically meaningful differences in infection-induced SARS-CoV-2 seroprevalence, suggesting that NCLS seroprevalence estimates are representative of the general population. 48 Second, cross-sectional seroprevalence studies estimate the proportion of people previously infected and cannot detect reinfections. Infection-induced antibodies, which provide some protection against reinfections, 49 may have contributed to attenuated associations over time. Third, the availability of county-specific pediatric vaccination data at a single time point limited the ability to adjust for county-level pediatric vaccination rates when examining temporal trends. Finally, commercial laboratory data do not include data on individual-level race, ethnicity, SES, or vaccination status. Because this study used county-level aggregate data on race and ethnicity, as well as vaccination rates, comparisons of these results with studies using individual-level data should be approached with caution.
Conclusions
Our study demonstrated that relationships between social vulnerability and pediatric SARS-CoV-2 anti-N antibody seroprevalence varied by social vulnerability domain and period. The multifaceted nature of social vulnerability and evolving patterns of SARS-CoV-2 infection rates among pediatric groups underscores the importance of data systems that can better detect differential patterns in health outcomes that exist and emerge over time, as these can be particularly dynamic during a public health emergency. Data analyzed by key demographic factors, as well as underlying nonmedical factors and indices such as SVI, would allow public health agencies to better tailor upstream interventions and policies to support opportunities for all people to attain their highest level of health across socioeconomic and demographic contexts. In addition, the findings provide evidence supporting positive effects at the federal and jurisdictional level during the COVID-19 response, including expanding tailored testing practices and advances in availability of COVID-19 vaccines and treatment opportunities in communities with previously limited access. 50
Supplemental Material
sj-png-1-phr-10.1177_00333549251362041 – Supplemental material for Association Between Social Vulnerability and Infection-Induced SARS-CoV-2 Antibody Seroprevalence Among Children: United States, 2021-2022
Supplemental material, sj-png-1-phr-10.1177_00333549251362041 for Association Between Social Vulnerability and Infection-Induced SARS-CoV-2 Antibody Seroprevalence Among Children: United States, 2021-2022 by Yun Kim, Ronaldo Iachan, Marjorie Biel, Jefferson M. Jones, Anna Bratcher and Kristie E.N. Clarke in Public Health Reports®
Supplemental Material
sj-png-2-phr-10.1177_00333549251362041 – Supplemental material for Association Between Social Vulnerability and Infection-Induced SARS-CoV-2 Antibody Seroprevalence Among Children: United States, 2021-2022
Supplemental material, sj-png-2-phr-10.1177_00333549251362041 for Association Between Social Vulnerability and Infection-Induced SARS-CoV-2 Antibody Seroprevalence Among Children: United States, 2021-2022 by Yun Kim, Ronaldo Iachan, Marjorie Biel, Jefferson M. Jones, Anna Bratcher and Kristie E.N. Clarke in Public Health Reports®
Supplemental Material
sj-png-3-phr-10.1177_00333549251362041 – Supplemental material for Association Between Social Vulnerability and Infection-Induced SARS-CoV-2 Antibody Seroprevalence Among Children: United States, 2021-2022
Supplemental material, sj-png-3-phr-10.1177_00333549251362041 for Association Between Social Vulnerability and Infection-Induced SARS-CoV-2 Antibody Seroprevalence Among Children: United States, 2021-2022 by Yun Kim, Ronaldo Iachan, Marjorie Biel, Jefferson M. Jones, Anna Bratcher and Kristie E.N. Clarke in Public Health Reports®
Footnotes
Declaration of Conflicting Interests
The authors declared no potential conflicts of interest with respect to the research, authorship, and/or publication of this article.
Funding
The authors received no financial support for the research, authorship, and/or publication of this article.
Disclaimer
The findings and conclusions in this article are those of the authors and do not necessarily reflect the official position of the Centers for Disease Control and Prevention.
Supplemental Material
Supplemental material for this article is available online. The authors have provided these supplemental materials to give readers additional information about their work. These materials have not been edited or formatted by Public Health Reports’s scientific editors and, thus, may not conform to the guidelines of the AMA Manual of Style, 11th Edition.
References
Supplementary Material
Please find the following supplemental material available below.
For Open Access articles published under a Creative Commons License, all supplemental material carries the same license as the article it is associated with.
For non-Open Access articles published, all supplemental material carries a non-exclusive license, and permission requests for re-use of supplemental material or any part of supplemental material shall be sent directly to the copyright owner as specified in the copyright notice associated with the article.