
Abstract
Objective:
We conducted a national US study of SARS-CoV-2 seroprevalence by Social Vulnerability Index (SVI) that included pediatric data and compared the Delta and Omicron periods during the COVID-19 pandemic. The objective of the current study was to assess the association between SVI and seroprevalence of infection-induced SARS-CoV-2 antibodies by period (Delta vs Omicron) and age group.
Methods:
We used results of infection-induced SARS-CoV-2 antibody assays of clinical sera specimens (N = 406 469) from 50 US states from September 2021 through February 2022 to estimate seroprevalence overall and by county SVI tercile. Bivariate analyses and multilevel logistic regression models assessed the association of seropositivity with SVI and its themes by age group (0-17, ≥18 y) and period (Delta: September–November 2021; Omicron: December 2021–February 2022).
Results:
Aggregate infection-induced SARS-CoV-2 antibody seroprevalence increased at all 3 SVI levels; it ranged from 25.8% to 33.5% in September 2021 and from 53.1% to 63.5% in February 2022. Of the 4 SVI themes, socioeconomic status had the strongest association with seroprevalence. During the Delta period, we found significantly more infections per reported case among people living in a county with high SVI (odds ratio [OR] = 2.76; 95% CI, 2.31-3.21) than in a county with low SVI (OR = 1.65; 95% CI, 1.33-1.97); we found no significant difference during the Omicron period. Otherwise, findings were consistent across subanalyses by age group and period.
Conclusions:
Among both children and adults, and during both the Delta and Omicron periods, counties with high SVI had significantly higher SARS-CoV-2 antibody seroprevalence than counties with low SVI did. These disparities reinforce SVI’s value in identifying communities that need tailored prevention efforts during public health emergencies and resources to recover from their effects.
One of the biggest challenges facing public health is the ability to proactively address and ameliorate health disparities. Multiple factors may contribute to health disparities, including cultural background, socioeconomic status (SES), access to care, structural inequities, and discrimination. 1 Reducing health disparities is essential to reaching health equity, a state in which all people are able to overcome social disadvantages to achieve their health potential. 2
Social vulnerability refers to the factors affecting a community’s ability to respond to disasters, including infectious disease outbreaks. The Social Vulnerability Index (SVI) is an indicator that helps emergency response and public health officials identify and plan for communities most likely in need of support before, during, and after a public health emergency. 3 The 2018 SVI measures county-level social vulnerability and includes 15 component indicators grouped into 4 themes 4 : SES, household composition and disability (hereinafter, household composition), racial and ethnic minority status and language (hereinafter, minority status), and housing type and transportation (hereinafter, housing/transportation). The higher the scores for SVI or component themes, the greater the level of vulnerability. SVI has been linked to disparities in COVID-19 outcomes, including case counts, 5 suicide rates, 6 teen pregnancy, 7 and maternal health metrics.8,9
While COVID-19 case surveillance data are vital, these data do not capture all infections; some infections are asymptomatic, undiagnosed, or not reported to public health systems. 10 Compared with case count data, serosurveys can be a more sensitive measure of the proportion of a population that has been infected with SARS-CoV-2, the virus that causes COVID-19. 11 The Centers for Disease Control and Prevention (CDC) conducted 2 national cross-sectional seroprevalence surveys using specimens collected from blood donors and commercial laboratories. While a recent study of the blood donor survey found that a higher overall SVI score (indicating greater social vulnerability) was associated with higher infection-induced seroprevalence, 12 the blood donor population may have had limited generalizability because donor populations tend to be younger and have overall better health than the general US population. 13
The National Commercial Laboratories Seroprevalence (NCLS) survey 10 includes specimens of residual sera from clinical testing of both adults and children. This analysis examined NCLS data from September 2021 through February 2022 to assess associations between SVI and the 4 SVI themes with (1) overall SARS-CoV-2 seroprevalence, (2) seroprevalence by age group (0-17, ≥18 y), and (3) seroprevalence during the Delta and Omicron periods.
Methods
The NCLS survey includes deidentified residual serum specimens collected from people in 50 US states; Washington, DC; and Puerto Rico who visited laboratories for testing unrelated to assessment for COVID-19 infection status (eg, routine clinical care). 10 Three commercial laboratory networks collected specimens during 4-week data collection periods. All laboratories used the Elecsys Anti-SARS-CoV-2 pan-immunoglobulin immunoassay (Roche Diagnostics) to test specimens for the presence of antinucleocapsid (anti-N) antibodies to SARS-CoV-2, an antibody type produced in response to prior infection but not in response to vaccination with vaccines authorized in the United States during data collection. The assay has a sensitivity of 100% (95% CI, 88.3%-100.0%), a specificity of 99.8% (95% CI, 99.7%-99.9%), and high stability in antibody responses over time. 14 Specimen data included patient age, sex, state, and zip code of patient residence; for <5% of specimens, we used zip codes of health care providers because of missing data. When values for ≥1 demographic variable were missing (<0.02% of the dataset), we imputed values probabilistically by using the nonmissing data distribution within the same jurisdiction. 15
This activity was reviewed by CDC and was conducted consistent with applicable federal law and CDC policy (45 CFR part 46, 21 CFR part 56; 42 USC Sect 241[d]; 5 USC Sect 552a; 44 USC Sect 3501 et seq).
A total of 415 698 specimens collected during September 6, 2021, through February 26, 2022, were tested for SARS-CoV-2 antibodies. Although quality controls ensured deduplication of deidentified specimens within a data collection period, specimens from the same person may have been included in >1 data collection period. We calculated seroprevalence for each county by dividing the number of specimens testing positive for anti-N antibodies by the total number of tested specimens in the 6-month combined data collection period. To ensure participants’ confidentiality and a robust model fit, we excluded counties with <7 specimens, resulting in a sample size of 406 469 specimens in 2081 counties; 89.8% of the US population resides in these counties. Lastly, we stratified the dataset by period (Delta vs Omicron). We defined the Delta period as the 3 data collection periods during September 6–November 28, 2021, and the Omicron period as the 3 data collection periods during November 29, 2021–February 26, 2022. We used geocoded data to link patients’ residential zip code to a state/county Federal Information Processing Standard (FIPS) 16 code. Metropolitan and nonmetropolitan designations were based on the US Department of Agriculture’s Rural–Urban Continuum Codes (metropolitan 1-3, nonmetropolitan 4-9). 17 We assigned county-level 2018 SVI scores on the basis of the patients’ FIPS codes.
Statistical Analysis
We used bivariate analyses and the Pearson χ2 test to compare seroprevalence by SVI level. We computed the unadjusted odds ratios (ORs) by using simple logistic models to assess the bivariate associations between seroprevalence with the overall SVI and the 4 SVI themes. We categorized counties into high, medium, and low vulnerability terciles based on the terciles for overall SVI and each theme across all US counties.
For the analysis of trends by SVI, we estimated monthly seroprevalence rates from a generalized linear mixed-effects model 18 that associated the individual-level serologic test result with multiple covariates at the individual and county levels. Fixed effects included terciles of overall county SVI score and the following individual-level covariates: testing round (4-week data collection period corresponding to the specimen collection date), age category, sex, metropolitan status, and US Census region. Terciles of SVI allowed for distinguishing areas of low, medium, and high SES levels while adjusting for all other covariates. We included counties as random effects to account for the heterogeneity of seropositivity across US counties. We interpreted nonoverlapping 95% CIs as significant differences between groups. We standardized the model-based estimated seroprevalence by adjusting to the parameters of the Roche Elecsys N-target assay, which is less affected than other assays by antibody waning. We calculated the ratios of infection to reported cases as the model-based estimated seroprevalence divided by the population-based percentage of cases reported by CDC’s COVID Tracker 19 ; methodological details are published elsewhere. 20
Finally, we further examined the adjusted association between individual-level seropositivity and county scores on the 4 SVI themes by using a generalized linear mixed-effects logistic model. 18 The analysis used the 4 SVI themes as independent variables. The models were stratified by the variant periods (Delta and Omicron) and by age groups (children and adolescents aged 0-17 y, adults aged ≥18 y). Fixed effects included tercile levels of the 4 county-level SVI themes and individual-level categorical covariates previously reported to be associated with seroprevalence (age, sex, metropolitan status of residence, data collection period, and US Census region).21 -24
Although we weighted all results at the jurisdictional and national levels by sex, age, and metropolitan status, our analyses used unweighted data but adjusted for those covariates. We used an α of .05 as the cutoff for significance in all analyses. We conducted all analyses in SAS version 9.4 (SAS Institute Inc) and R version 4.0.3 (The Comprehensive R Archive Network) with the lme4 package. 25
Results
Bivariate Analysis of County-Level Seroprevalence and SVI
Across the entire study period, the seroprevalence was higher in counties with higher SVI; counties in the low, medium, and high terciles by SVI had seroprevalences of 29%, 33%, and 40%, respectively (P < .001). Compared with residents of low-SVI counties, residents of medium-SVI counties had 23% (OR = 1.23; 95% CI, 1.21-1.25) higher odds of seropositivity, and residents of high-SVI counties had 64% (OR = 1.64; 95% CI, 1.21-1.25) higher odds. We observed significantly higher seroprevalence among medium-SVI and high-SVI counties, compared with low-SVI counties, for the SES theme (medium vs low, OR = 1.48; 95% CI, 1.44-1.48; high vs low, OR = 1.73; 95% CI, 1.70-1.76), the household composition theme (medium vs low, OR = 1.44; 95% CI, 1.42-1.46; high vs low, OR = 1.44; 95% CI, 1.42-1.47), and the minority status theme (medium vs low, OR = 1.19; 95% CI, 1.17-1.22; high vs low, OR = 1.20; 95% CI, 1.18-1.23). Higher seroprevalence was associated with higher SVI for most components of these 3 themes; the proportion of households with a member aged ≥65 years had an inverse association (medium vs low, OR = 0.78; 95% CI, 0.77-0.80; high vs low, OR = 0.82; 95% CI, 0.80-0.84).
The housing/transportation theme was also significantly associated with higher seroprevalence (OR = 1.07; 95% CI, 1.05-1.09 for both high and medium vs low SVI). However, some components of this theme had inverse associations. A higher percentage of multiunit structures was associated with lower seroprevalence (medium vs low, OR = 0.79; 95% CI, 0.77-0.81; high vs low, OR = 0.74; 95% CI, 0.72-0.76) as was, to a lesser magnitude, a higher proportion of households without a vehicle (medium vs low, OR = 0.98; 95% CI, 0.96-0.99; high vs low, OR = 0.96; 95% CI, 0.94-0.97) (Figure 1).
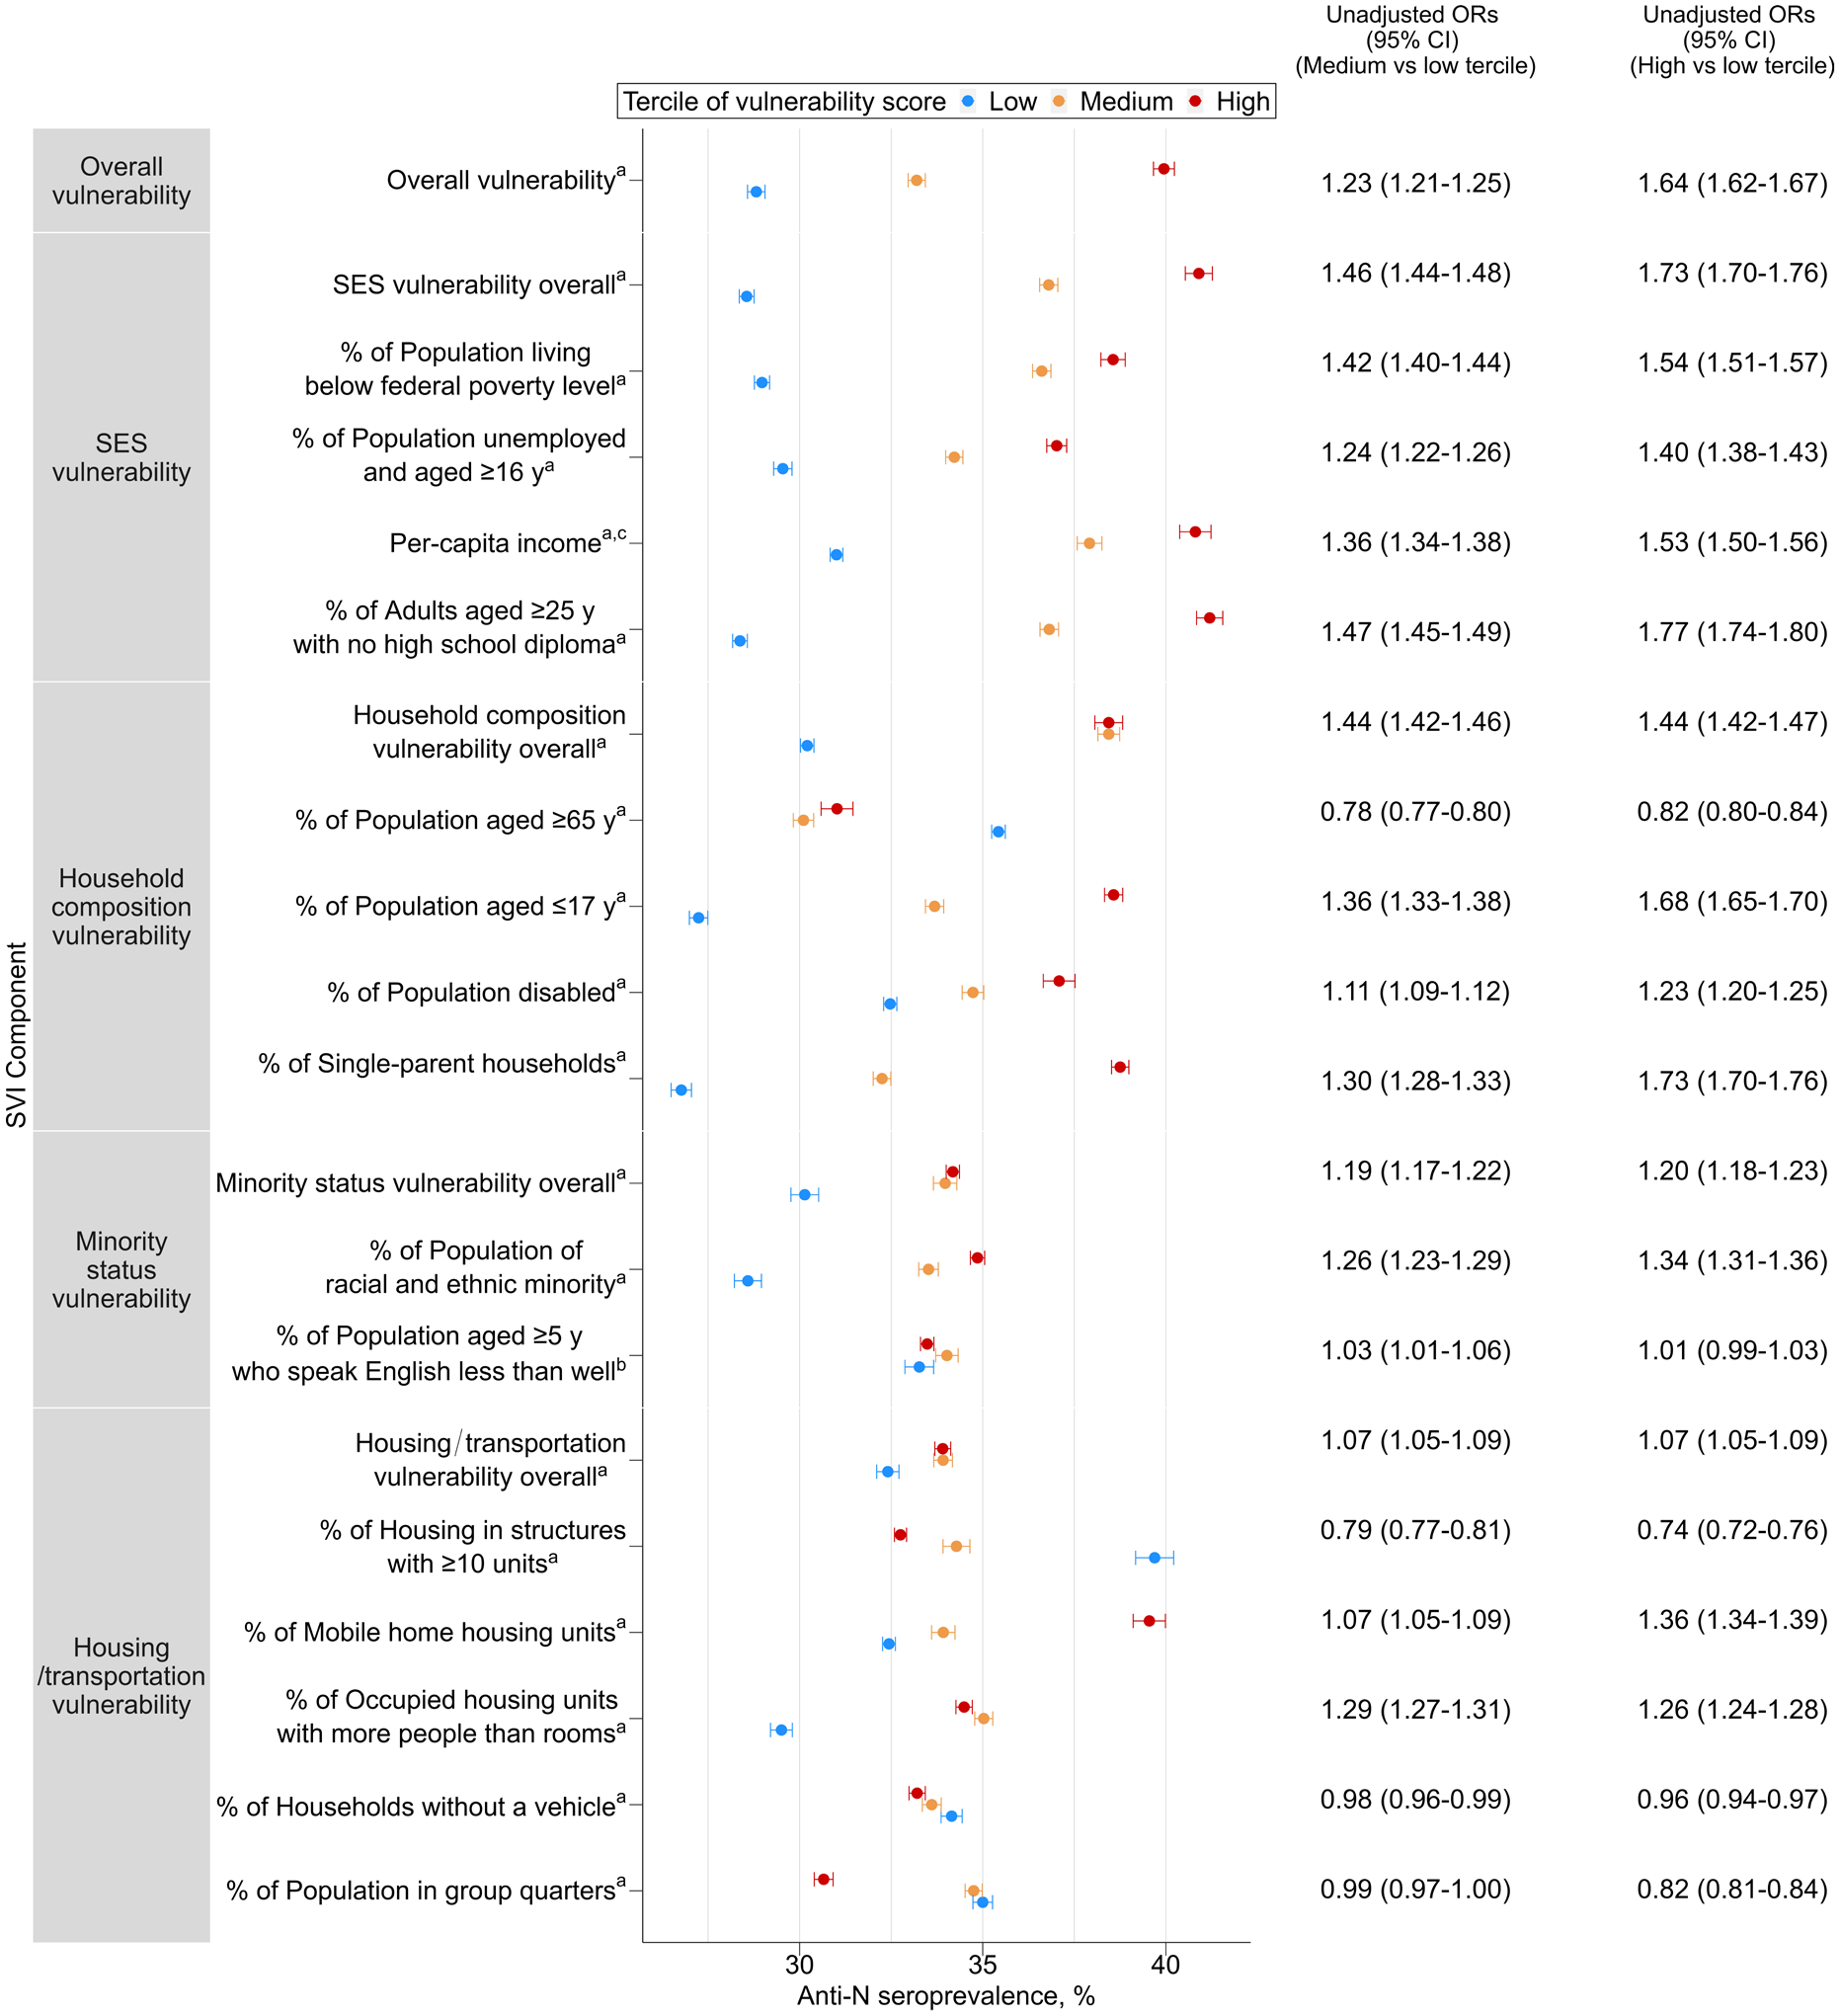
Infection-induced SARS-CoV-2 seropositivity by tercile of Social Vulnerability Index (SVI), theme, and components, United States, September 2021–February 2022. Abbreviations: anti-N, antinucleocapsid; OR, odds ratio; SES, socioeconomic status.
Trends in Seroprevalence by SVI
An analysis of the monthly estimated SARS-CoV-2 antibody seroprevalence by SVI for the entire study period revealed that seroprevalence increased for all 3 SVI levels, ranging from 25.8% to 33.5% in September 2021 and ranging from 53.1% to 63.5% in February 2022 (Figure 2). Seroprevalence trends across time were similar for residents of high-SVI, medium-SVI, and low-SVI counties; trends for each group increased sharply from December 2021 to February 2022. For each 4-week data collection period, a higher tercile of SVI corresponded to significantly higher seroprevalence.
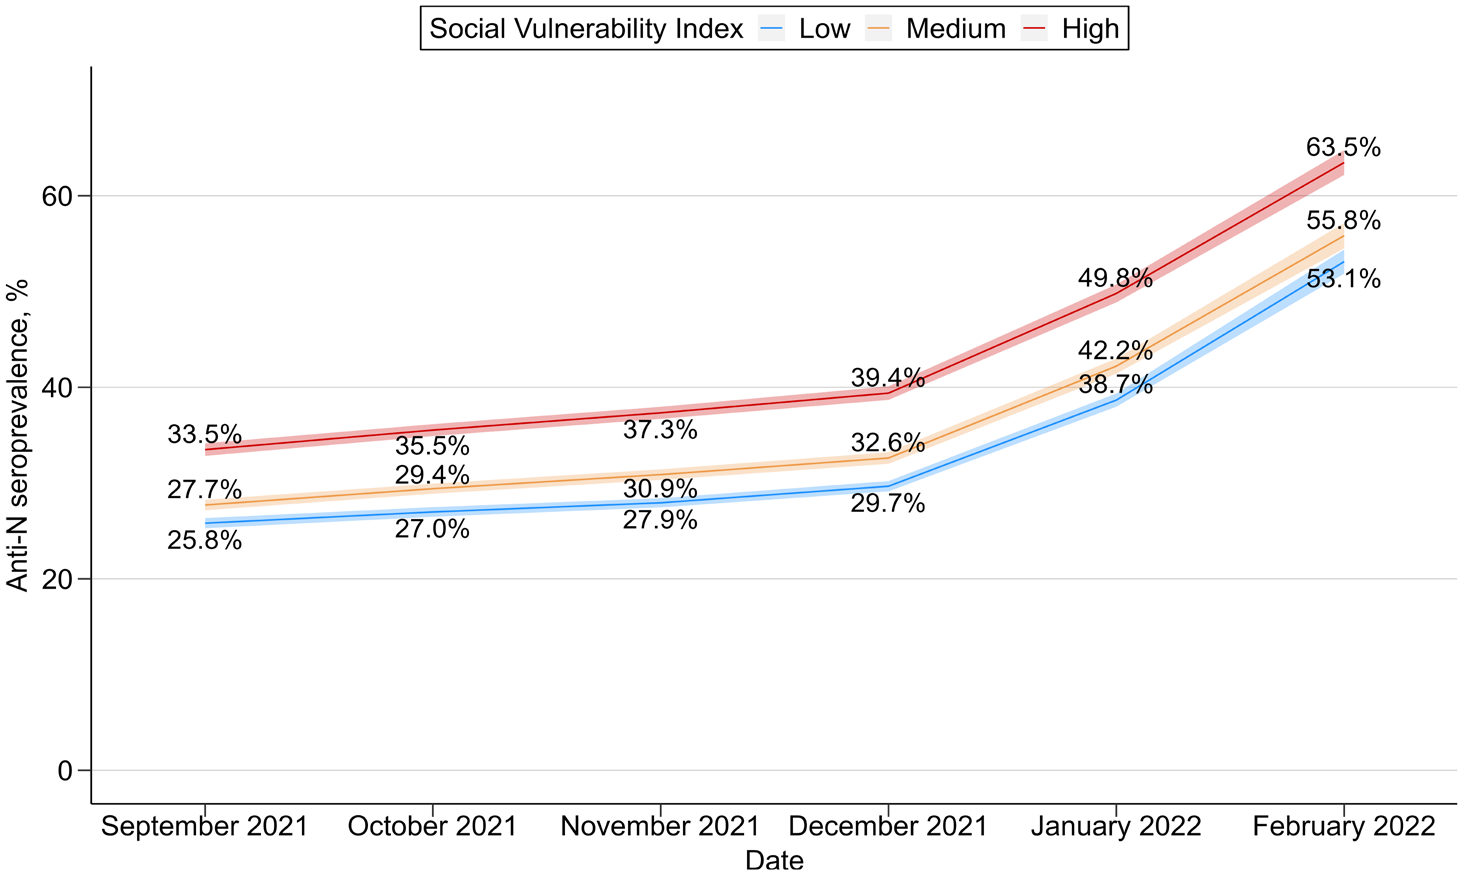
Estimated monthly SARS-CoV-2 antibody seroprevalence by Social Vulnerability Index (SVI), United States, September 2021–February 2022. Shading indicates 95% CIs. Abbreviation: anti-N, antinucleocapsid.
Infection-to-Case Ratio by SVI Analysis
During the Delta period, we found significantly more infections per reported case among residents of high-SVI counties (infection-to-case ratio = 2.76; 95% CI, 2.31-3.21) compared with residents of low-SVI counties (infection-to-case ratio = 1.65; 95% CI, 1.33-1.97). During the Omicron period, the infection-to-case ratio did not significantly differ by SVI, with slightly more than 3 estimated infections per reported case for all terciles (Figure 3).
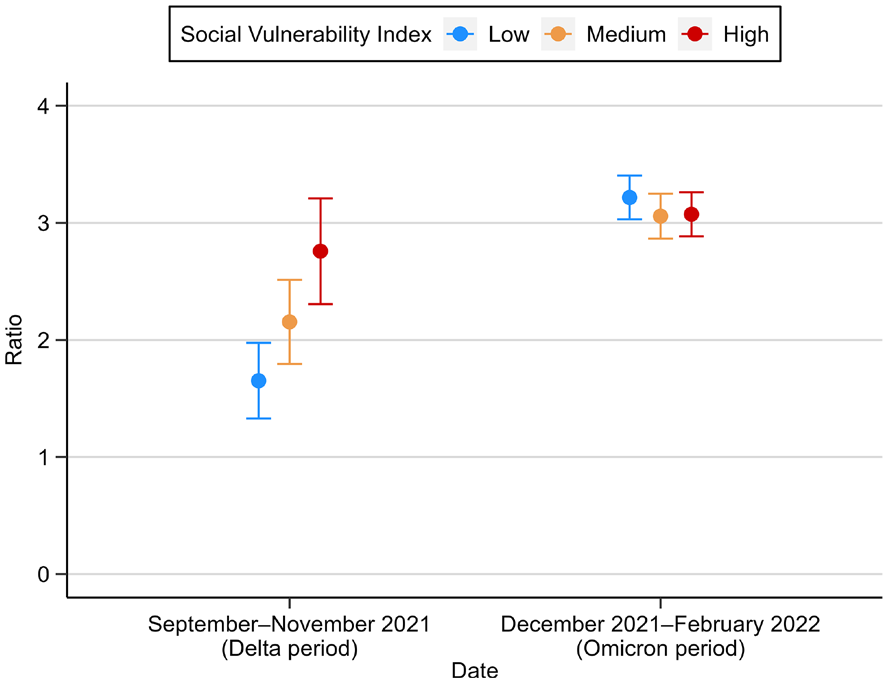
SARS-CoV-2 infection-to-case ratios, by Social Vulnerability Index (SVI), United States, September 2021–February 2022. Data on specimen collection and demographic characteristics were collected from the 50 US states and the District of Columbia and tested for SARS-CoV-2 antibodies by using commercially available COVID-19 test kits. Error bars indicate 95% CIs.
Generalized Linear Mixed-Effects Model of Person-Level Seropositivity
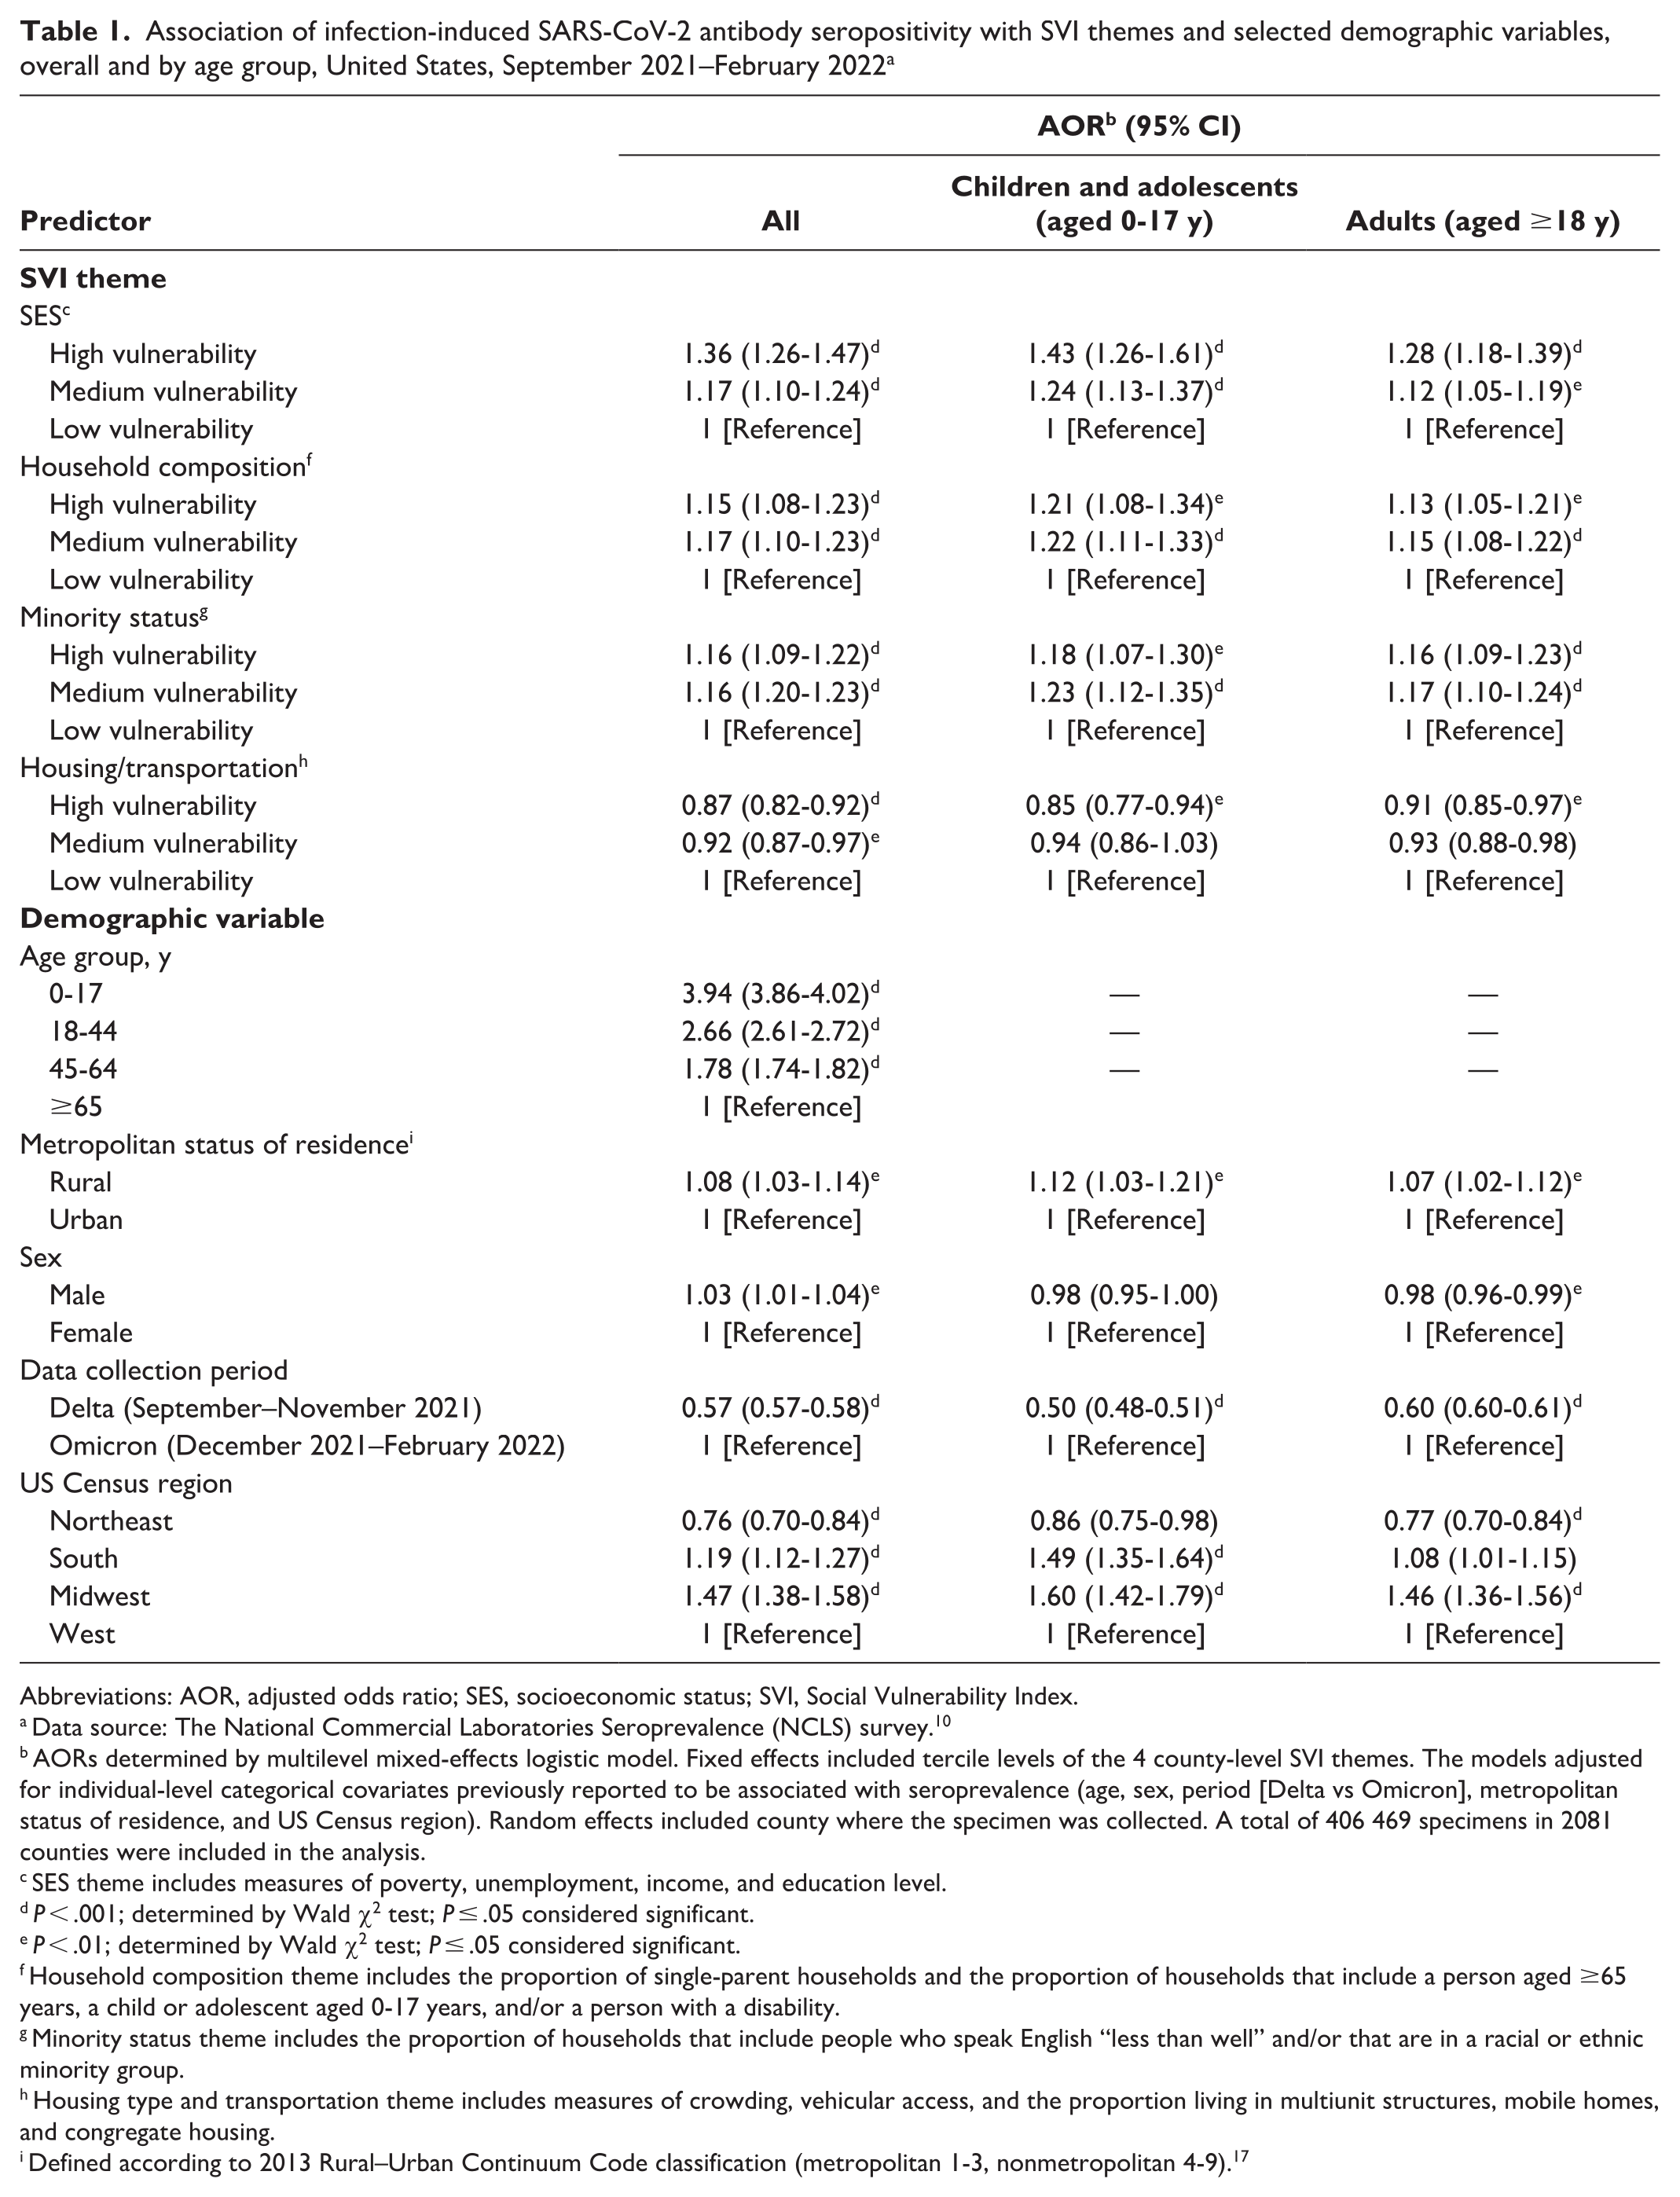
Overall, a person residing in a county in the high or medium tercile of scores for the SVI themes of SES, household composition, and minority status had significantly higher adjusted odds of seropositivity compared with a resident of a county in the low tercile (Table 1). The SES theme had the strongest associations: odds of seropositivity for residents of high-vulnerability counties were 36% (adjusted odds ratio [AOR] = 1.36; 95% CI, 1.26-1.47) higher, and odds of seropositivity for residents of medium-vulnerability counties were 17% (AOR = 1.17; 95% CI, 1.10-1.24) higher than among residents of low-vulnerability counties. For the household composition and minority themes, odds of seropositivity were 15% to 17% higher for residents of counties with high-tercile and medium-tercile scores than for residents of counties with low-tercile scores. However, for the housing/transportation theme, residents of high-vulnerability (AOR = 0.87; 95% CI, 0.82-0.92) and medium-vulnerability (AOR = 0.92; 95% CI, 0.87-0.97) counties had lower odds of seropositivity than residents of low-vulnerability counties (Table 1).
Association of infection-induced SARS-CoV-2 antibody seropositivity with SVI themes and selected demographic variables, overall and by age group, United States, September 2021–February 2022 a
Abbreviations: AOR, adjusted odds ratio; SES, socioeconomic status; SVI, Social Vulnerability Index.
Data source: The National Commercial Laboratories Seroprevalence (NCLS) survey. 10
AORs determined by multilevel mixed-effects logistic model. Fixed effects included tercile levels of the 4 county-level SVI themes. The models adjusted for individual-level categorical covariates previously reported to be associated with seroprevalence (age, sex, period [Delta vs Omicron], metropolitan status of residence, and US Census region). Random effects included county where the specimen was collected. A total of 406 469 specimens in 2081 counties were included in the analysis.
SES theme includes measures of poverty, unemployment, income, and education level.
P < .001; determined by Wald χ2 test; P ≤ .05 considered significant.
P < .01; determined by Wald χ2 test; P ≤ .05 considered significant.
Household composition theme includes the proportion of single-parent households and the proportion of households that include a person aged ≥65 years, a child or adolescent aged 0-17 years, and/or a person with a disability.
Minority status theme includes the proportion of households that include people who speak English “less than well” and/or that are in a racial or ethnic minority group.
Housing type and transportation theme includes measures of crowding, vehicular access, and the proportion living in multiunit structures, mobile homes, and congregate housing.
Defined according to 2013 Rural–Urban Continuum Code classification (metropolitan 1-3, nonmetropolitan 4-9). 17
We found similar results when stratifying by age group; both adult and pediatric residents of high-SVI and medium-SVI counties had higher adjusted odds of seropositivity than residents of low-SVI counties. For each age group, the odds of seropositivity were significantly higher in counties with high-tercile and medium-tercile (vs low-tercile) vulnerability scores for the SES, household composition, and minority status themes. In each group, the strongest association was for the SES theme; children and adolescents in high-vulnerability counties had 43% higher adjusted odds (AOR = 1.43; 95% CI, 1.26-1.61) of seropositivity, and adults had 28% higher odds (AOR = 1.28; 95% CI, 1.18-1.39) of seropositivity than those in low-vulnerability counties. In both age groups, we found an inverse relationship between seropositivity and terciles of housing/transportation vulnerability (Table 1).
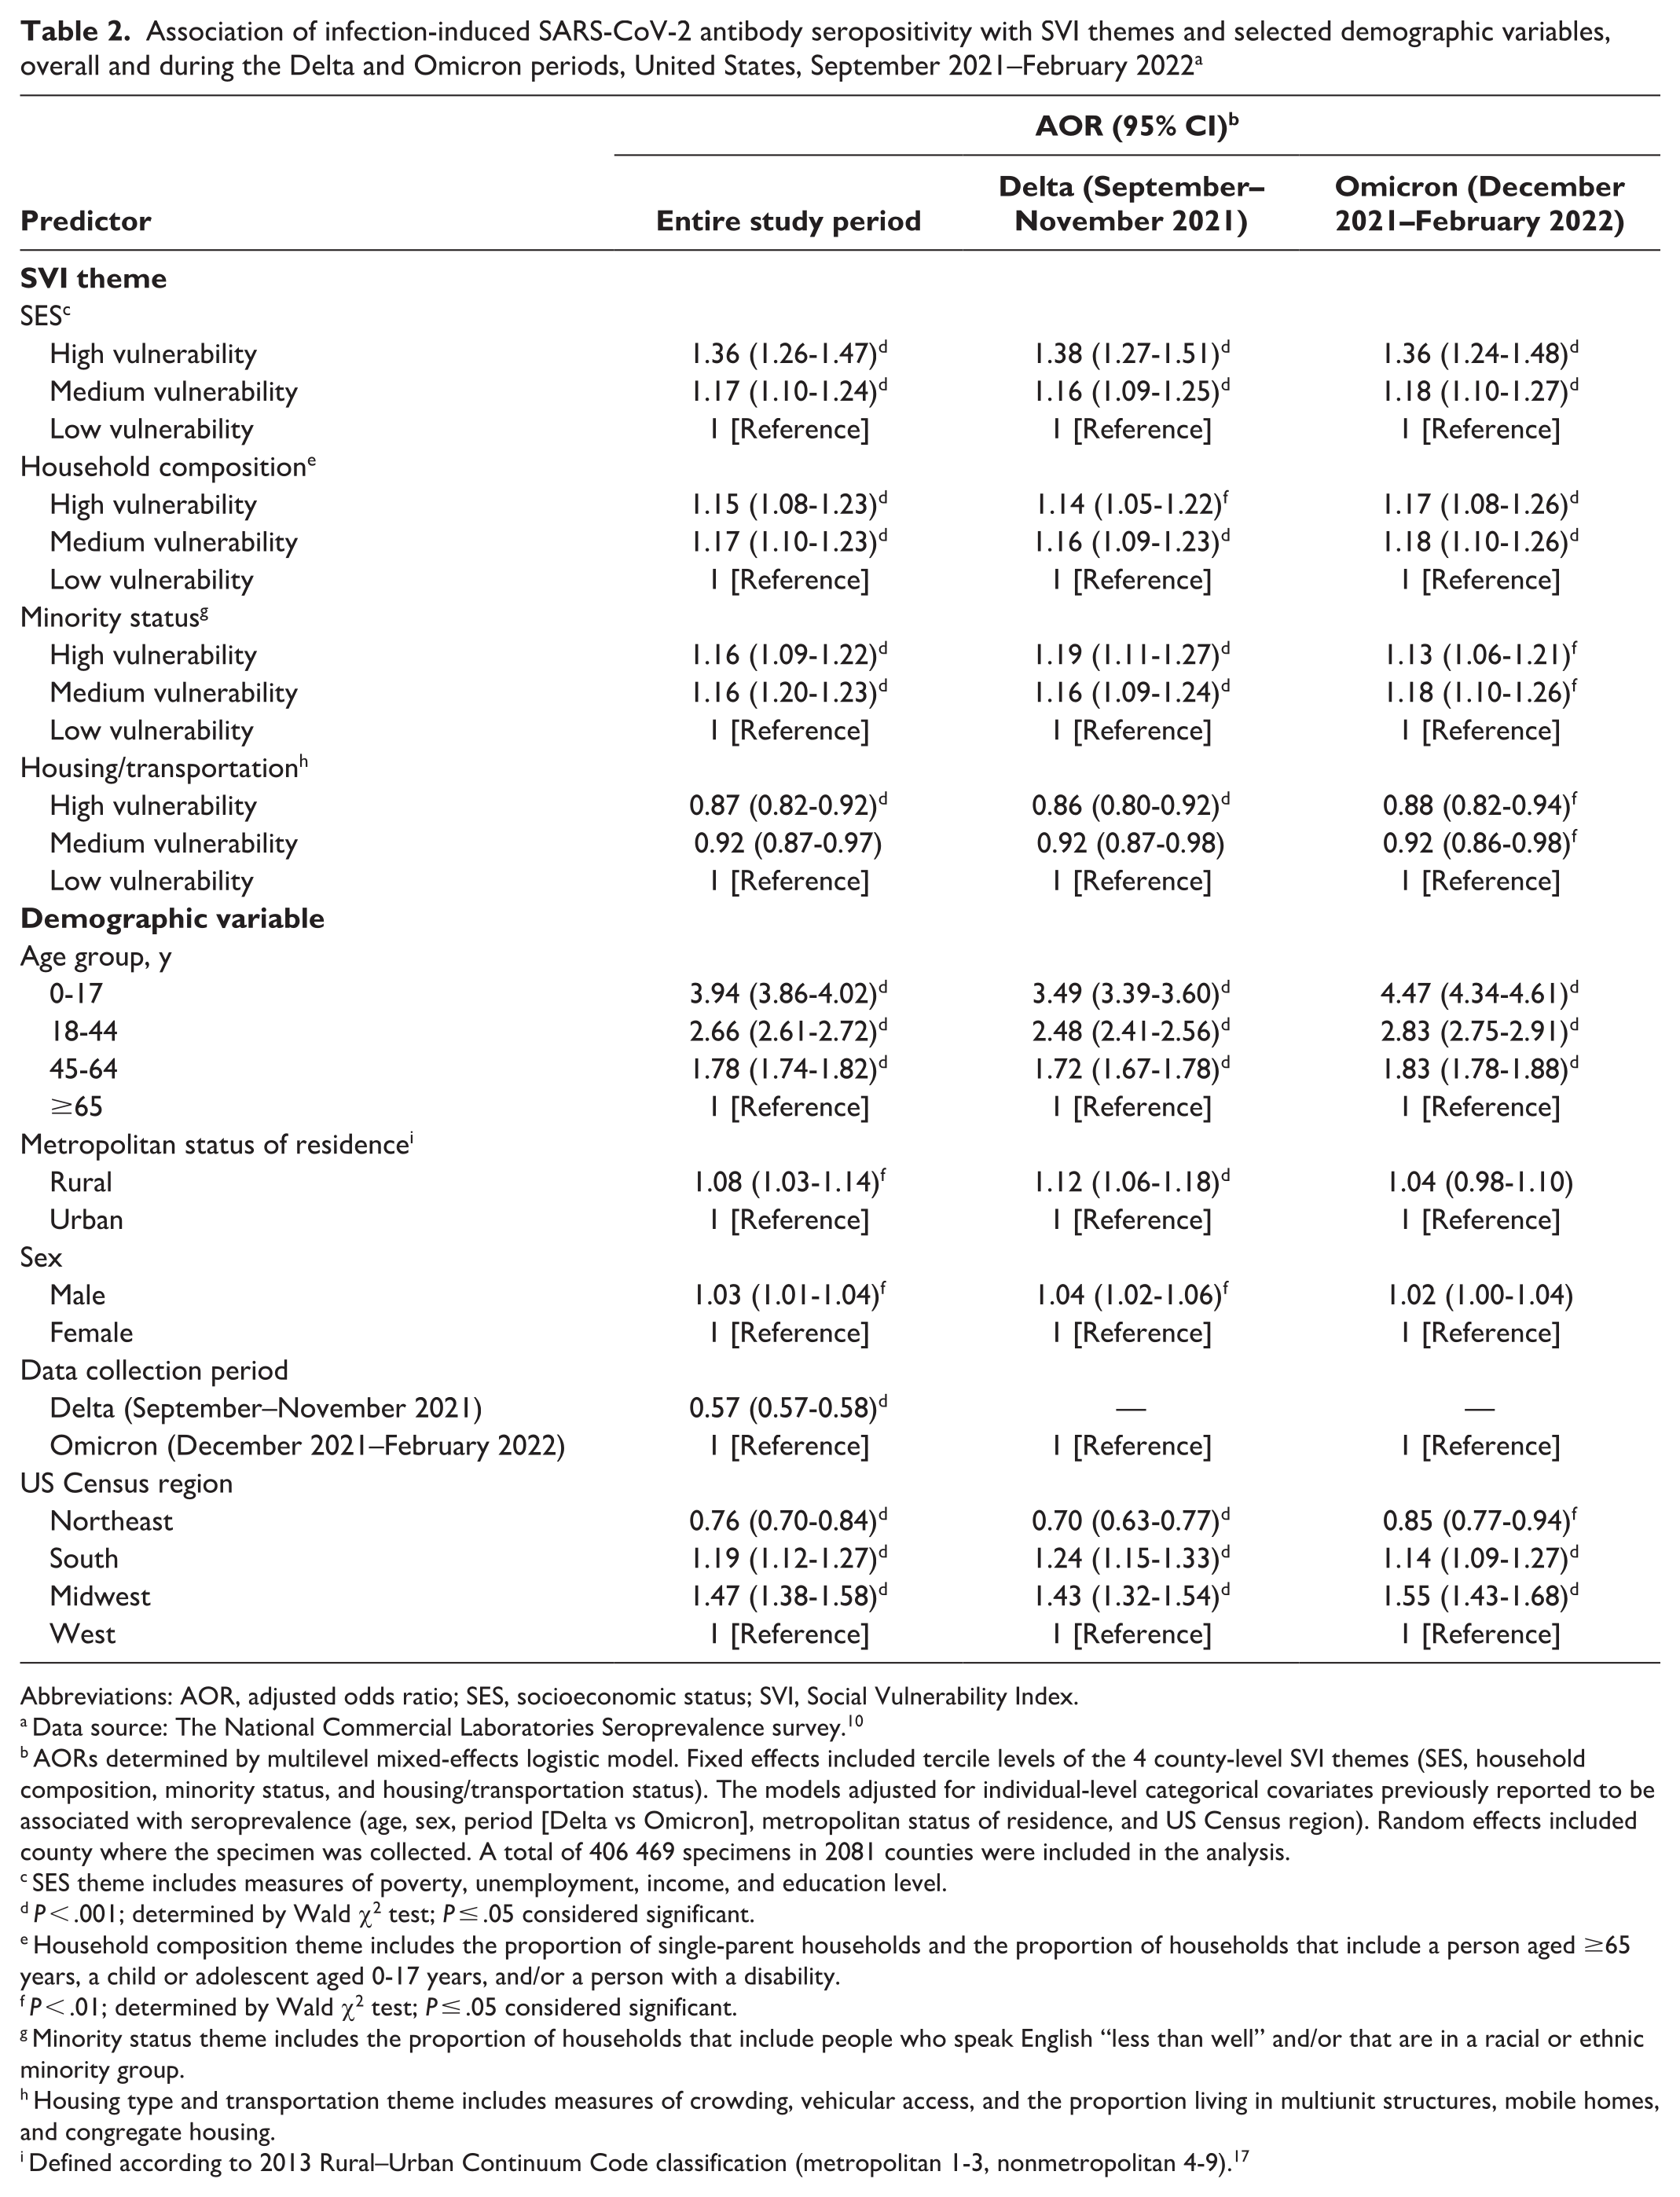
Most results were also similar when stratifying by period (Table 2). During both the Delta and Omicron periods, residents of high-SVI or medium-SVI counties had higher adjusted odds of seropositivity than residents of low-SVI counties. We observed the highest AORs by SVI theme during both periods for SES: residents of high-vulnerability counties had 38% higher odds (AOR = 1.38; 95% CI, 1.27-1.51) of seropositivity during the Delta period and 36% higher odds (AOR = 1.36; 95% CI, 1.24-1.48) of seropositivity during the Omicron period than residents of low-vulnerability counties. Across both periods, people aged 0-17 years had higher odds of seropositivity than people aged ≥65 years (Delta period, AOR = 3.49; 95% CI, 3.39-3.60; Omicron period, AOR = 4.47; 95% CI, 4.34-4.61). One difference was that, adjusting for scores on SVI themes, rurality was significantly associated with seropositivity in the Delta period model (AOR = 1.12; 95% CI, 1.06-1.18; P < .001) but not the Omicron period model (AOR = 1.04; 95% CI, 0.98-1.10; P = .16).
Association of infection-induced SARS-CoV-2 antibody seropositivity with SVI themes and selected demographic variables, overall and during the Delta and Omicron periods, United States, September 2021–February 2022 a
Abbreviations: AOR, adjusted odds ratio; SES, socioeconomic status; SVI, Social Vulnerability Index.
Data source: The National Commercial Laboratories Seroprevalence survey. 10
AORs determined by multilevel mixed-effects logistic model. Fixed effects included tercile levels of the 4 county-level SVI themes (SES, household composition, minority status, and housing/transportation status). The models adjusted for individual-level categorical covariates previously reported to be associated with seroprevalence (age, sex, period [Delta vs Omicron], metropolitan status of residence, and US Census region). Random effects included county where the specimen was collected. A total of 406 469 specimens in 2081 counties were included in the analysis.
SES theme includes measures of poverty, unemployment, income, and education level.
P < .001; determined by Wald χ2 test; P ≤ .05 considered significant.
Household composition theme includes the proportion of single-parent households and the proportion of households that include a person aged ≥65 years, a child or adolescent aged 0-17 years, and/or a person with a disability.
P < .01; determined by Wald χ2 test; P ≤ .05 considered significant.
Minority status theme includes the proportion of households that include people who speak English “less than well” and/or that are in a racial or ethnic minority group.
Housing type and transportation theme includes measures of crowding, vehicular access, and the proportion living in multiunit structures, mobile homes, and congregate housing.
Defined according to 2013 Rural–Urban Continuum Code classification (metropolitan 1-3, nonmetropolitan 4-9). 17
Discussion
Social determinants of health related to SVI have meaningful and significant associations with anti-N SARS-CoV-2 antibody seropositivity. While the shape of the seroprevalence curve of each SVI group followed the overall national trend, 10 seroprevalence was consistently higher among populations residing in medium-SVI and high-SVI counties than in low-SVI counties.
The SVI themes of SES, household composition, and minority status, in addition to higher overall SVI, were significantly associated with higher odds of seropositivity. These associations remained after stratification by age group and period. Of the 4 themes, increased seropositivity was most strongly associated with SES in all analyses. SES plays a major role in the overall health of a population and has long been associated with higher incidence and prevalence of diseases.26,27 Potential reasons for this strong association of county-level SES and seroprevalence may include lower levels of education or income. Low SES also exposes people to discrimination and high levels of life stress, preventing effective self-protection from infection through the limitation of resources, such as the ability to telework. 28 A previous analysis showed that vaccination coverage was lower among adults living in counties with higher overall SVI and higher scores on the SES and household composition themes than among adults living in counties with lower scores. 29 Low vaccination rates can be an important driver of community seroprevalence; compared with fully vaccinated people, unvaccinated people are both at greater risk of infection and more likely to shed the virus when infected, thereby spreading the infection to others.30,31
Studies have shown an association between high SVI scores and several health outcomes, including high COVID-19 case rates,5,32 -34 teen birth rates, 7 mortality among SARS-CoV-2–positive pregnant women, 8 and maternal comorbidity among patients with pregestational diabetes. 9 Although our methods preclude direct comparison of the magnitude of the disparities by overall SVI, our findings are largely consistent with previous studies using case data. However, during periods when a lower proportion of infections was ultimately reported as cases in higher-SVI areas, as demonstrated by the infection-to-case ratios during the Delta period, analyses based on case counts could have underestimated disparities by SVI. It is important to consider differential testing or reporting rates when interpreting the analyses of disparities based on case data. This finding highlights the added value of serology data, when feasible, to study inequities that may not be fully represented by case surveillance data.
In our analysis by SVI theme, we found that the SES theme was more strongly associated with seroprevalence than the minority status theme; this finding differed from findings in studies that used case data during an earlier phase of the pandemic. A study of case data from January–May 2020 found that minority status was the only theme that predicted higher case counts. 5 Another study from January–July 2020 found a higher adjusted incidence rate ratio (aIRR) for a 0.01-unit increase in the minority status theme score (aIRR = 1.22) compared with the SES theme score (aIRR = 1.11). 32 A possible explanation for this difference is the dynamic pattern of trends in cases by race and ethnicity over time, with wide disparities in early 2020 that narrowed or reversed over time before widening again in January 2022. 35 Some differences could have also been attributed to the use of seroprevalence data rather than case data; seroprevalence data are less likely to be influenced by differences in testing and reporting patterns.
Conversely, higher vulnerability for the housing/transportation theme was significantly associated with lower odds of seropositivity when controlling for the other SVI themes and demographic covariates. These findings may be driven by thematic components that had opposite effects on SARS-CoV-2 infections. For example, counties with a higher proportion of mobile homes and more crowding were associated with higher seroprevalence. However, other thematic components that may be more prevalent in urban areas, such as multiunit housing structures and lack of vehicular access, were associated with lower seroprevalence. Collectively, the different associations among various components may have resulted in the inverse associations seen for this SVI theme in stratified analyses.
While most findings were consistent in subanalyses, we found 2 differences by period. During the Delta period, the higher the SVI, the higher the infection-to-case ratio, indicating more undiagnosed and unreported infections in more socially vulnerable areas than in less socially vulnerable areas. During the Omicron period, the overall infection-to-case ratio was significantly higher than in the Delta period, but we found no significant difference in the infection-to-case ratio by SVI. Possible explanations for this shift could include efforts to increase access to testing in low-resourced areas and increased availability and use of home testing kits that do not generate reports to public health authorities. We also found a significant association between rurality and seropositivity, controlling for SVI themes, during the overall study period and the Delta period but not during the Omicron period. A possible explanation for this finding could be that when the Delta variant surged as the predominant US variant during June–July 2021, rural areas were especially affected, 36 likely due in part to lower vaccination rates in rural areas as compared with urban areas.37,38
Limitations
This study had several limitations. First, there are several possible limitations to the generalizability of the results. Results from a convenience sample of blood specimens drawn for clinical care may not be representative of the general US population. These specimens may represent a sample of people with greater access to medical care or greater likelihood to receive frequent blood draws than the general population. In addition, information on participants’ race and ethnicity was not available from commercial laboratories, so we could not make individual-level adjustments for these variables in the results. Second, while more sensitive than case report data, seroprevalence data have some limitations in estimating the proportion of the population that has experienced a new infection with SARS-CoV-2. Data on reinfections could not be captured because most people will receive a positive test result for anti-N antibodies for 18-24 months after a primary infection; also, not all people who are infected seroconvert, particularly people who are infected within 2 months after vaccination 39 or people with immunocompromising conditions. Finally, county-level vaccination rates were not included in the models because of likely collinearity with SVI8,29 and changes in vaccination rates and age groups eligible for vaccination during the 6-month study period, so it is unknown how much of these differences are attributable to differences in vaccination rates by county SVI level.
Conclusions
Our analyses identified significant disparities in the prevalence of SARS-CoV-2 infection by social vulnerability and provide an in-depth examination of the disparities in the estimated proportion of the population that had experienced SARS-CoV-2 infection in socially vulnerable communities. For each of the 4-week data collection periods in the study period, residents of high-SVI counties had significantly higher estimated seroprevalence than residents of medium-SVI counties; likewise, estimated seroprevalence was significantly higher among people from medium-SVI counties than among people from low-SVI counties. These differences were consistent in both pediatric and adult age groups as well as during periods with different predominant variants. Higher SVI scores, and most robustly the SES theme, were associated with increased seroprevalence. Findings from this study reinforce the value of SVI by highlighting the importance of leveraging SVI scores in a public health emergency to identify the communities most likely to be disproportionately affected so that proactive support can be provided. Findings also demonstrate the utility of seroprevalence data to evaluate disparities when testing and reporting patterns differ. Such findings may be used to design intervention strategies, allocate resources to recover from the effects of the COVID-19 pandemic, prepare for future public health emergencies, and increase access to testing, treatment, and vaccination to reduce health disparities.
Footnotes
Acknowledgements
The authors acknowledge Marjorie Biel, MPH, and Adam Lee, MPH, ICF, Inc, and Anna Bratcher, PhD, Centers for Disease Control and Prevention, for their contributions to the research, conceptualization, and constructive review of this article.
Disclaimer
The findings and conclusions in this article are those of the authors and do not necessarily reflect the official position of the Centers for Disease Control and Prevention/Agency for Toxic Substances and Disease Registry or the US Department of Health and Human Services.
Declaration of Conflicting Interests
The authors declared no potential conflicts of interest with respect to the research, authorship, and/or publication of this article.
Funding
The authors received no financial support for the research, authorship, and/or publication of this article.