
Abstract
Objective:
An estimated 1 in 5 American Indian and Alaska Native (AI/AN) adults living with HIV are unaware of their status. We investigated HIV testing among AI/AN people receiving a Centers for Disease Control and Prevention (CDC)–funded test from 2014 through 2020.
Methods:
We analyzed data on CDC-funded HIV tests reported by health departments and community-based organizations in the United States. We described the number of CDC-funded HIV tests, the percentage of people with newly and previously diagnosed HIV, and linkage to HIV medical care within 90 days of diagnosis.
Results:
CDC-funded health departments and community-based organizations provided 99 227 HIV tests to AI/AN people during 2014-2020. Seven hundred thirty-five (0.7%) AI/AN people were diagnosed with HIV; 361 (0.4%) were newly diagnosed, 319 (0.3%) had a previous HIV diagnosis, and 55 (0.1%) had a previously unknown HIV status. Positivity for new diagnoses was highest among the following population groups tested in non–health care settings: men who had sex with men (MSM; n = 72, 1.2%), MSM who inject drugs (n = 12, 1.8%), and transgender people (n = 12, 1.5%). The percentage of linkage to HIV medical care was 80.6% for newly diagnosed people and 78.2% for previously diagnosed people.
Conclusions:
MSM AI/AN, including those who inject drugs, and transgender AI/AN may benefit from prioritized HIV testing. All AI/AN people with HIV, whether newly or previously diagnosed, should rapidly link to HIV medical care and receive support throughout the continuum of care. Our findings can inform which AI/AN population subgroups may benefit from enhanced HIV testing efforts and interventions.
An estimated 2.8 million people in the United States are American Indian and Alaska Native (AI/AN), representing 1.3% of the total population. 1 While the rate of HIV diagnoses in the United States decreased overall from 2015 to 2019, the rate of HIV diagnoses among AI/AN people increased from 10.0 to 11.7 per 100 000 population. 2 Fewer than half of AI/AN adults aged ≥18 years have ever been tested for HIV, 3 and an estimated 1 in 5 AI/AN people living with HIV are unaware of their status. 4 When compared with all people with diagnosed HIV, AI/AN people have lower retention in HIV medical care and lower viral suppression rates. 5
The Centers for Disease Control and Prevention (CDC) funds state and local health departments and community-based organizations (CBOs) to provide comprehensive HIV prevention services, including HIV testing. HIV testing is an essential HIV prevention activity, because knowledge of HIV-positive status can lead to treatment, viral suppression, and decreased transmission. 6 CDC uses HIV testing data from funded health departments and CBOs to monitor progress toward HIV prevention goals and improve HIV testing efforts.
There is little published research about the sociodemographic characteristics of AI/AN people at risk for and living with HIV.7,8 One possible reason is the potentially very small sample sizes that arise when calculating estimates specific to AI/AN people. To our knowledge, no peer-reviewed articles on CDC-funded HIV testing for this group have been published. CDC publishes data on its funded HIV testing program, which includes data for AI/AN people, in its annual HIV testing reports.9-14 We assembled data across a 7-year period to describe HIV testing, diagnoses of HIV infection, and linkage to HIV medical care among AI/AN people receiving a CDC-funded HIV test.
Methods
Data Source
We analyzed 2014-2020 data on CDC-funded HIV tests provided by 61 state and local health departments and CBOs (ranging from 100 to 154 CBOs depending on the funding year) in the United States, Puerto Rico, and the US Virgin Islands. Health departments and CBOs collected data locally and reported them through a CDC-supported monitoring and evaluation reporting system, EvaluationWeb. Data reported to CDC did not contain personally identifiable information. CDC determined that data collection was a routine program monitoring and evaluation activity and did not require institutional review board approval. The Office of Management and Budget approved this data collection.
HIV Tests and Testing Outcomes
In our analysis of CDC-funded HIV tests, an HIV test reflects the sequence of 1 or more tests conducted by the health department or CBO to determine HIV status. We analyzed only valid HIV tests (ie, tests with a positive or negative result). Outcome variables were the HIV test result and linkage to care within 90 days of diagnosis. We calculated positivity for new HIV diagnoses and the percentage of previous diagnoses as a percentage among all tests. We calculated the percentage of people linked to care when information on linkage to care (ie, confirmed access of service, confirmed but did not access service) was available and excluded those with missing information on linkage to care.
In the past several years, almost half of all people diagnosed with HIV infection by a CDC-funded test had a previously reported HIV diagnosis. 15 Therefore, we analyzed previous HIV testing and results, which allowed categorization into new and previous diagnoses. New diagnoses represent people who received a positive result for the current test who did not have a diagnosis previously reported in the health department’s HIV surveillance system. When health departments and CBOs could not check surveillance data, self-reported data for previous HIV-positive test results were used to determine previous HIV-positive status. Previous diagnoses represent people who received a positive result on the current test and had a previous positive HIV test result either in the health department’s HIV surveillance system or through client self-report. For previously diagnosed people, the linkage-to-care calculation excluded people who self-reported being in HIV medical care at the time of the test.
Demographic Characteristics, Region, Test Setting, and Population Groups
We classified AI/AN people by self-identified race and ethnicity. The dataset included those identifying as single-race, non-Hispanic AI/AN people.
We analyzed results overall and by sex at birth (male, female), age group (<13, 13-19, 20-29, 30-39, 40-49, 50-98 years), US Census region (Northeast: Connecticut, Maine, Massachusetts, New Hampshire, New Jersey, New York, Pennsylvania, Rhode Island, and Vermont; Midwest: Illinois, Indiana, Iowa, Kansas, Michigan, Minnesota, Missouri, Nebraska, North Dakota, Ohio, South Dakota, and Wisconsin; South: Alabama, Arkansas, Delaware, District of Columbia, Florida, Georgia, Kentucky, Louisiana, Maryland, Mississippi, North Carolina, Oklahoma, South Carolina, Tennessee, Texas, Virginia, and West Virginia; West: Alaska, Arizona, California, Colorado, Hawaii, Idaho, Montana, Nevada, New Mexico, Oregon, Utah, Washington, and Wyoming; or US-dependent areas: Puerto Rico and the US Virgin Islands), 16 test setting, and population groups. We categorized the HIV test setting as either health care settings (facilities that provided both medical diagnostic and treatment services, such as inpatient clinics) or non–health care settings (facilities that did not provide both medical diagnostic and treatment services, such as community HIV testing sites).
We followed the methodology in CDC’s annual HIV testing reports9-14 to categorize population groups using self-reported risk behaviors collected by CDC. From 2012 through 2017, CDC requested information about risk behaviors during the past year. Beginning in 2018, CDC revised the time referent from the past year to the past 5 years. However, some health departments and CBOs used the previous methodology, resulting in a mix of 1- or 5-year time referents. Population groups included gay, bisexual, and other men who have sex with men (collectively referred to as MSM); transgender people; people who inject drugs; transgender people who inject drugs; MSM who inject drugs; heterosexual males; and heterosexual females. We grouped transgender people into 2 categories: transgender women (ie, people who identified as male-to-female transgender or reported male as their assigned sex at birth and female as their current gender) and transgender men (ie, people who identified as female-to-male transgender or reported female as their assigned sex at birth and male as their current gender). Descriptive statistics by population group are presented only for tests conducted in non–health care settings, because CDC does not require collection of these data in health care settings.
Analysis
The authors summarized descriptive statistics for the number of CDC-funded HIV tests conducted, the number and percentage of newly and previously diagnosed HIV-positive people, and the number and percentage of people linked to HIV medical care within 90 days. We did not conduct tests of significance for differences between groups because of small sample sizes for several groups, particularly for linkage to HIV medical care. This descriptive approach supports the goal of describing CDC-funded HIV tests (as opposed to inferring results for a larger population of HIV tests). We performed all analyses in SAS version 9.4 (SAS Institute Inc).
Results
HIV Testing
During 2014-2020, AI/AN people accounted for 99 227 CDC-funded tests (Table). We observed some differences by sociodemographic characteristics. The percentage of HIV tests provided was higher among those reporting male sex at birth (52.9%; 47 066 of 88 959) than among those reporting female sex at birth (47.1%; 41 893 of 88 959) and among people aged 20-29 years (35.5%; 35 009 of 98 547) than among people in other age groups. AI/AN people received a higher percentage of tests in health care settings (55.4%; 54 293 of 97 955) than in non–health care settings (44.6%; 43 662 of 97 955). By region, we found a higher percentage of tests in the West (35.3%; 35 053 of 99 227) and the South (34.7%; 34 474 of 99 227) than in other regions. In non–health care settings only, the analysis showed a higher percentage of HIV tests among heterosexual males (29.7%; 10 858 of 36 579) and heterosexual females (29.6%; 10 832 of 36 579) than among other population groups. Of the 99 227 tests, 735 (0.7%) test results were positive, of which 361 (49.1%) were new diagnoses, 319 (43.4%) were previous diagnoses, and 55 (7.5%) did not have enough information to make a determination.
Newly and previously diagnosed HIV-positive people and linkage to HIV medical care among American Indian/Alaska Native people, by demographic characteristics, United States, 2014-2020 a
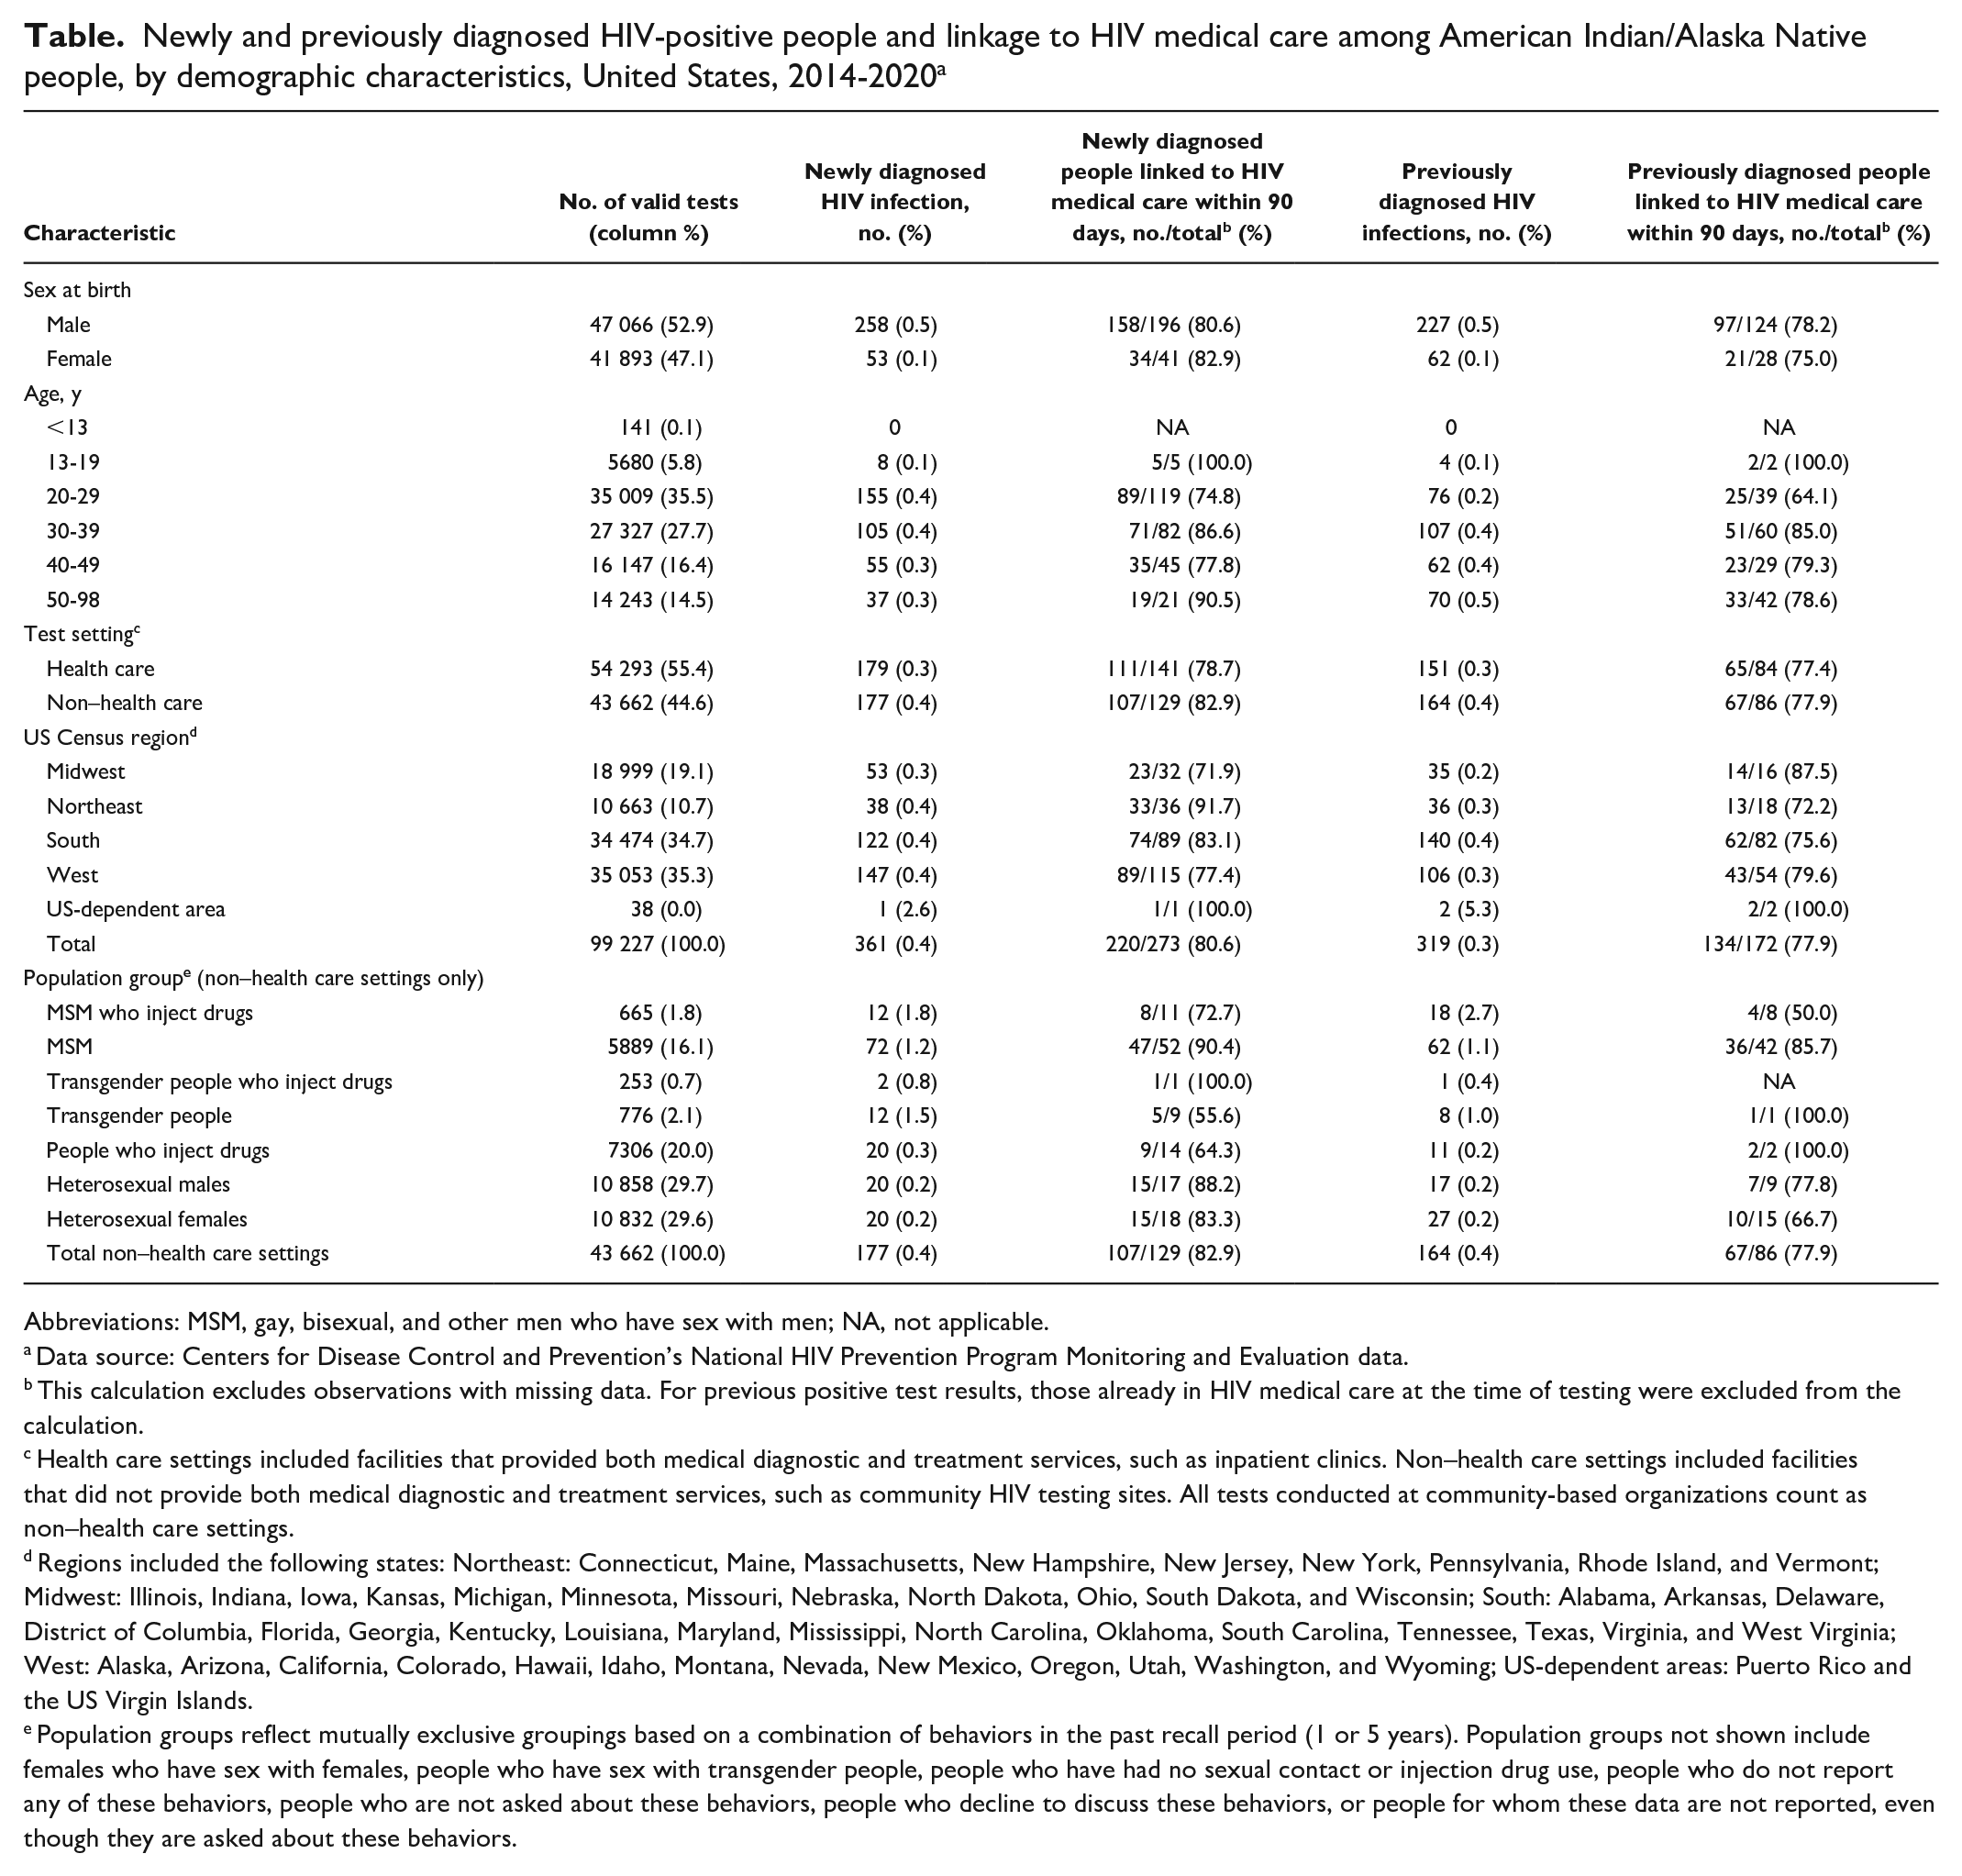
Abbreviations: MSM, gay, bisexual, and other men who have sex with men; NA, not applicable.
Data source: Centers for Disease Control and Prevention’s National HIV Prevention Program Monitoring and Evaluation data.
This calculation excludes observations with missing data. For previous positive test results, those already in HIV medical care at the time of testing were excluded from the calculation.
Health care settings included facilities that provided both medical diagnostic and treatment services, such as inpatient clinics. Non–health care settings included facilities that did not provide both medical diagnostic and treatment services, such as community HIV testing sites. All tests conducted at community-based organizations count as non–health care settings.
Regions included the following states: Northeast: Connecticut, Maine, Massachusetts, New Hampshire, New Jersey, New York, Pennsylvania, Rhode Island, and Vermont; Midwest: Illinois, Indiana, Iowa, Kansas, Michigan, Minnesota, Missouri, Nebraska, North Dakota, Ohio, South Dakota, and Wisconsin; South: Alabama, Arkansas, Delaware, District of Columbia, Florida, Georgia, Kentucky, Louisiana, Maryland, Mississippi, North Carolina, Oklahoma, South Carolina, Tennessee, Texas, Virginia, and West Virginia; West: Alaska, Arizona, California, Colorado, Hawaii, Idaho, Montana, Nevada, New Mexico, Oregon, Utah, Washington, and Wyoming; US-dependent areas: Puerto Rico and the US Virgin Islands.
Population groups reflect mutually exclusive groupings based on a combination of behaviors in the past recall period (1 or 5 years). Population groups not shown include females who have sex with females, people who have sex with transgender people, people who have had no sexual contact or injection drug use, people who do not report any of these behaviors, people who are not asked about these behaviors, people who decline to discuss these behaviors, or people for whom these data are not reported, even though they are asked about these behaviors.
Newly Diagnosed People
The overall HIV positivity rate was 0.4% (361 new diagnoses resulting from 99 227 tests; Table). By population group, the highest number of new diagnoses was among MSM (n = 72), and the highest positivity percentages were among MSM who inject drugs (1.8%), transgender people (1.5%), and MSM (1.2%). By region, the highest positivity percentages were in the West, South, and Northeast (0.4% each). The positivity percentage in US-dependent areas was 2.6% but represented only 1 person. By age, the positivity percentage was highest for people aged 20-29 and 30-39 years (0.4% each). The positivity percentage among males (0.5%) was higher than among females (0.1%). Among 273 people with newly diagnosed HIV, 220 (80.6%) people were linked to HIV medical care within 90 days. The percentage of linkage to care was lower among males (80.6%) than among females, among people aged 20-29 years (74.8%) than among those in other age groups, and among those in the Midwest (71.9%) than among those in other regions. By population group, the percentage of people linked to care was lowest among transgender people (55.6%) and people who inject drugs (64.3%).
Previously Diagnosed People
Among AI/AN people in our analysis, 46.9% (n = 319 of 680) of all positive test results were among people with a previous HIV diagnosis (Table). The overall percentage previously diagnosed was 0.3%. The highest percentage of previous diagnoses was among males (0.5%), those aged 50-98 years (0.5%), people tested in non–health care settings (0.4%), and people in the South (0.4%). By population group, the highest percentage of previous diagnoses was among MSM who inject drugs (2.7%). Of the 298 people who reported a previous positive HIV test result with known care status, 72 (24.2%) reported being in HIV medical care at the time of testing. Among those with information on linkage to care (n = 172), 134 (77.9%) people with a previous HIV diagnosis were linked to HIV medical care within 90 days, and the percentage of people linked to care was lowest among people aged 20-29 years (64.1%). By sex at birth, linkage was slightly lower among females (75.0%) than among males (78.2%). We found little difference between testing conducted in health care and non–health care settings (77.4% and 77.9%, respectively). By region, linkage was lowest in the Northeast (72.2%). By population group, linkage was lowest among MSM who inject drugs (50.0%).
Discussion
The HIV community has called for more complete data on HIV among AI/AN people and improved data dissemination.17,18 Our analysis aimed to address these gaps by providing data on the characteristics of AI/AN people receiving a CDC-funded HIV test. Our analysis describes HIV testing and related outcomes among AI/AN people using a level of detail not previously reported in CDC’s annual HIV testing reports9-14 and, to our knowledge, not previously reported in the literature.
Of CDC-funded tests conducted during 2014-2020,9-14 health departments and CBOs provided 99 227 (0.5%) to AI/AN people. When examining HIV testing by population groups, which were constructed by using self-reported risk behaviors and reported in non–health care settings only, our data indicated that heterosexual AI/AN people received about half of the tests. Of the 43 662 HIV tests conducted in non–health care settings among AI/AN people, 21 690 (50.0%) were among heterosexual males and females and 5889 (13%) HIV tests were conducted among MSM. Among AI/AN people tested during 2014-2020, positivity overall was highest among MSM, MSM who inject drugs, and transgender people. Higher positivity percentages among MSM, including MSM who inject drugs, and transgender people indicate a need for prioritized HIV testing for those population groups.
Overall, linkage to care within 90 days was higher than 78% for newly and previously diagnosed AI/AN people. While not assessed here, retention in HIV medical care and viral suppression tend to be lower in the AI/AN population than in the total population with HIV. 5 Investigation of why AI/AN people do not link to care or fall out of care, as well as adaptations of interventions that promote retention and medication adherence, may support AI/AN people as they move through the continuum of care.
This study focused on single-race non-Hispanic AI/AN people, a grouping used throughout the public health literature, including in other analyses of CDC-funded HIV testing studies.7,19-21 Future analyses could explore HIV testing and medical care among other AI/AN groups to provide a more comprehensive view of the population, especially given that the largest groups of multiracial adults in the United States identify as non-Hispanic White and American Indian, followed by non-Hispanic Black and American Indian. 22
National Health Interview Survey data indicate that more than half of all AI/AN people have never received an HIV test. 3 AI/AN people with diagnosed HIV have lower rates of retention in HIV medical care and viral suppression than the total population with HIV. 5 In addition, there are currently no CDC-supported behavioral interventions for HIV prevention for AI/AN people. When viewed with other data sources, our findings can inform the development of effective and culturally appropriate messaging, testing campaigns, and interventions for AI/AN people with HIV.
Limitations
Our results were subject to several limitations. First, data were restricted to CDC-funded HIV tests and associated monitoring and evaluation reporting requirements. Second, we did not have information about crucial HIV outcomes such as retention in care and viral suppression. Third, while CDC has standardized reporting requirements, how health departments and CBOs collected data varied. For example, some sites allowed people receiving an HIV test to complete an intake form, while other sites had staff solicit responses. Different data collection methods may have influenced responses to sensitive questions, including those about race and ethnicity, gender identity, and risk behaviors. Fourth, population group data were not routinely collected in health care settings, restricting a full description of HIV testing by AI/AN people in those settings. Fifth, we categorized population groups based on risk behaviors using a mix of 1- or 5-year recalls, because CDC revised the time referent from 1 year to 5 years, starting in 2018. Lastly, the authors urge caution when interpreting data in certain categories because of small sample sizes (eg, high positivity that represents a few tests).
Conclusions
AI/AN MSM, including those who inject drugs, and transgender AI/AN people may benefit from focused HIV testing efforts. Linkage rates to HIV medical care among AI/AN people in our analysis were 77.9% for those with newly diagnosed HIV and 80.6% for those with previously diagnosed HIV; these percentages are lower than the current goal in the HIV National Strategic plan 23 of 95%.
The HIV National Strategic Plan 23 identifies AI/AN MSM as a priority population for efforts to reduce health disparities and improve HIV outcomes. Our findings may indicate an additional need to prioritize AI/AN MSM who inject drugs and transgender AI/AN for HIV testing, linkage to care, and other prevention efforts. Furthermore, our findings may encourage an increase in HIV testing, linkage to care, and other HIV prevention efforts among AI/AN people.
Footnotes
Disclaimer
The findings and conclusions in this article are those of the authors and do not necessarily represent the official position of the Centers for Disease Control and Prevention.
Declaration of Conflicting Interests
The authors declared no potential conflicts of interest with respect to the research, authorship, and/or publication of this article.
Funding
The authors received no financial support for the research, authorship, and/or publication of this article.