
Abstract
Objectives:
The objectives of this study were to use Indian Health Service (IHS) data from electronic health records to analyze human immunodeficiency virus (HIV) diagnoses among American Indian/Alaska Natives (AI/ANs) and to identify current rates and trends that can support data-driven policy implementation and resource allocation for this population.
Methods:
We analyzed provider visit data from IHS to capture all AI/AN patients who met a definition of a new HIV diagnosis from 2005 through 2014 by using International Classification of Diseases, Ninth Revision, Clinical Modification codes. We calculated rates and trends of new HIV diagnoses by age, sex, region, and year per 100 000 AI/ANs in the IHS user population.
Results:
A total of 2273 AI/ANs met the definition of newly diagnosed with HIV from 2005 through 2014, an average annual rate of 15.1 per 100 000 AI/ANs. Most (356/391) IHS health facilities recorded at least 1 new HIV diagnosis. The rate of new HIV diagnoses among males (21.3 per 100 000 AI/ANs) was twice as high as that among females (9.5 per 100 000 AI/ANs; rate ratio = 2.2; 95% confidence interval, 2.1-2.4); by age, rates were highest among those aged 20-54 for males and females. By region, the Southwest region had the highest number (n = 1016) and rate (19.9 per 100 000 AI/ANs) of new HIV diagnoses. Overall annual rates of new HIV diagnoses were stable from 2010 through 2014, although diagnosis rates increased among males (P < .001) and those aged 15-19 (P < .001), 45-59 (P < .001), and 50-54 (P = .01).
Conclusions:
New HIV diagnoses, derived from provider visit data, among AI/ANs were stable from 2010 through 2014. AI/ANs aged 20-54, particularly men, may benefit from increased HIV prevention and screening efforts. Additional services may benefit patients in regions with higher rates of new diagnoses and in remote settings in which reported HIV numbers are low.
The number of new diagnoses of human immunodeficiency virus (HIV) infection among American Indian/Alaska Natives (AI/ANs) increased from 7.4 per 100 000 AI/ANs in 2010 to 8.8 per 100 000 AI/ANs in 2015 according to National Notifiable Diseases Surveillance System data published by the Centers for Disease Control and Prevention (CDC). At the same time, a decrease was seen in the number of new diagnoses of HIV infection in the general US population, from 14.2 per 100 000 population to 12.3 per 100 000 population. As of 2015, the rate of new diagnoses among AI/ANs was well above the rates of white people (5.3 per 100 000 population) and well below the rates of African Americans (44.3 per 100 000 population). 1
AI/ANs represented 5.3 million people, or about 1.7% of the US population, in 2015. 2 However, because of a lack of complete and accurate data on race/ethnicity in national surveillance and vital statistics systems, it is often difficult to accurately assess the health status for this population, as AI/ANs are more likely to be misclassified as another race than are people from other racial/ethnic minority groups, leading to an underestimation of the burden of disease. 3 -6 A large subset of the AI/AN population is served by the Indian Health Service (IHS), an integrated national health care delivery system of primarily rural clinics and hospitals. The IHS serves an estimated 2.2 million AI/ANs. Patients must document AI/AN status to be eligible for care in the IHS.
The objectives of this study were to examine the current rates, demographic characteristics, and annual trends of new HIV diagnoses among the AI/AN population using IHS data from electronic health records. To our knowledge, this is the first use of data from IHS electronic health records to generate estimated rates of new HIV diagnoses.
Methods
The IHS consists of 45 hospitals and more than 300 health centers in 34 US states, mainly primary care clinics in rural areas that are federally or tribally operated. In addition, the IHS provides contracted care at out-of-network health facilities when needed. Federal IHS and tribal facility electronic health records, as well as contract records, are aggregated at the national level and are maintained by the IHS National Patient Information Reporting System (NPIRS). 7 NPIRS includes all inpatient discharge and outpatient visit records for services to patients eligible for IHS health care. We obtained records from NPIRS to retrospectively analyze and estimate rates of new HIV diagnoses among AI/ANs during calendar years 2005 through 2014; this period allowed for comparison with the most recent national surveillance estimates. The NPIRS database contains information that allowed us to exclude people who had a previously recorded HIV diagnosis during calendar years 2001 through 2004 (n = 706), which precluded counting these people as a new diagnosis during the study period.
We used International Classification of Diseases, Ninth Revision, Clinical Modification (ICD-9-CM) codes for HIV (ie, 042-044, V08, 079.53, or 795.71), which includes an indeterminate HIV test result to ensure a sensitive case definition. 8 We defined a new HIV diagnosis as the first occurrence of an HIV diagnostic code in NPIRS in any of up to 15 diagnoses on any hospitalization or outpatient visit record for an individual during the study period.
We analyzed new HIV diagnoses for the study period by age group, sex, region, and year of HIV diagnosis of the patient. The IHS is divided into 7 regions for analysis: Alaska; East (Alabama, Connecticut, Florida, Louisiana, Maine, Maryland, Massachusetts, Mississippi, New York, North Carolina, Rhode Island, and South Carolina); Northern Plains East (Iowa, Michigan, Minnesota, and Wisconsin); Northern Plains West (Montana, Nebraska, North Dakota, South Dakota, and Wyoming); Southern Plains (Kansas, Oklahoma, and Texas); Southwest (Arizona, Colorado, Nevada, New Mexico, and Utah); and West (California, Idaho, Oregon, and Washington State). The West region is excluded from the inpatient discharge data because of the absence of IHS-operated or tribally operated hospitals and the incompleteness of data on contract health services. We included all regions for the analysis of outpatient visits.
The presence of an opportunistic infection (Table 1) can indicate late-stage disease (ie, HIV stage 3 [AIDS]). If an opportunistic infection was diagnosed in a person within 90 days of a new diagnosis of HIV, we considered it to be a new diagnosis that became known in an advanced stage. Late-stage diagnoses are of considerable public health impact because they indicate that people were infected for a long time without knowing their disease status and, thus, were likely to spread the disease at a higher rate than people who are aware of their disease. 9
ICD-9-CM codes for opportunistic infections
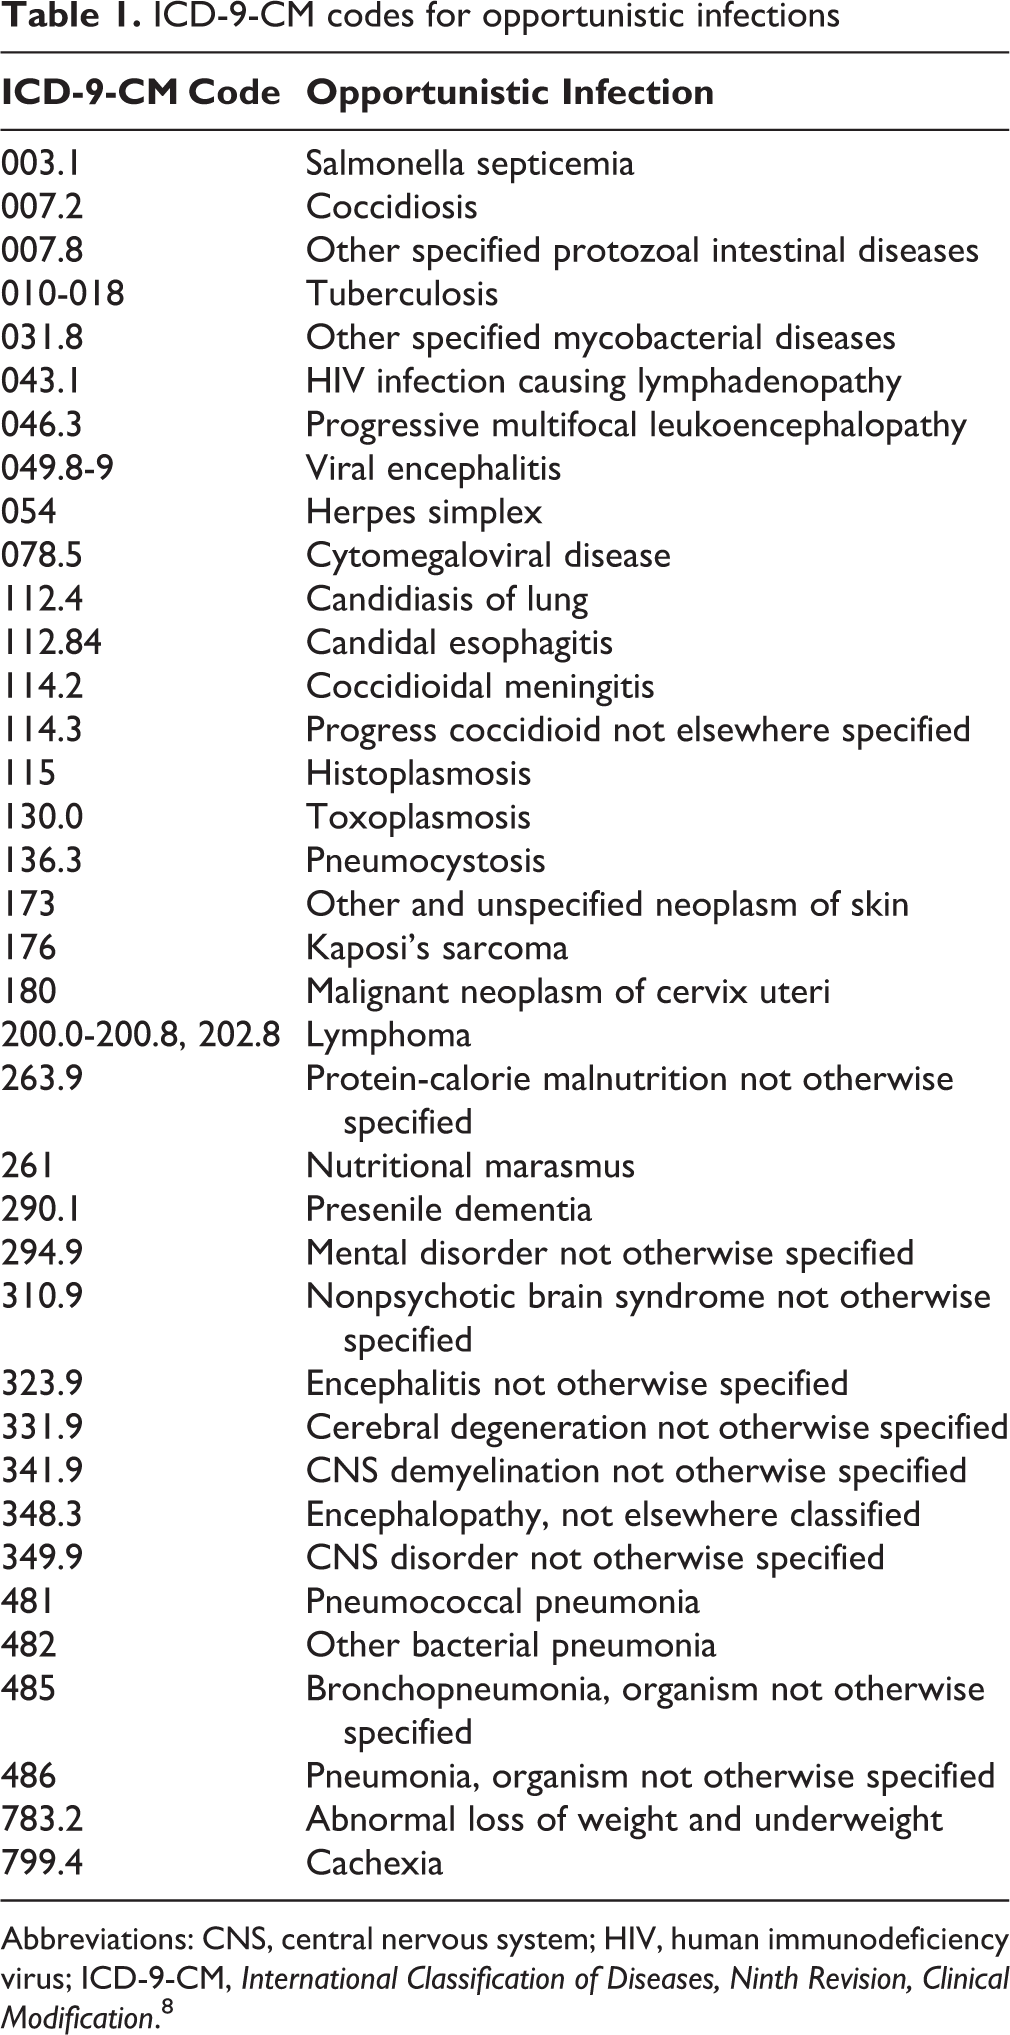
Abbreviations: CNS, central nervous system; HIV, human immunodeficiency virus; ICD-9-CM, International Classification of Diseases, Ninth Revision, Clinical Modification. 8
We calculated rates of new HIV diagnoses per 100 000 AI/ANs in the IHS user population (hereinafter, AI/ANs) by reported characteristics. The IHS population (approximately 1.6 million people) comprises all registered AI/ANs who received IHS-funded health care at least once in the preceding 3 years. We used Poisson regression analysis to test for trends over time and to calculate rate ratios (RRs) and 95% confidence intervals (CIs) for comparisons between groups. We considered P < .05 to be significant. We used SAS/STAT version 9.3 for all analyses. 10
Results
Rates of new HIV diagnoses among AI/ANs were stable from 2010 through 2014; during the entire study period (2005-2014), the average annual rate of new HIV infections was 15.1 per 100 000 AI/ANs. A total of 2273 AI/ANs met our definition of a new HIV diagnosis during 2005 through 2014 (Table 2). Males accounted for 1527 (67.2%) new HIV diagnoses, and the rate of new diagnoses among males (21.3 per 100 000 AI/ANs) was twice that of females (9.5 per 100 000 AI/ANs). Rates of new HIV diagnoses among males were higher than among females in every age group for those aged 20-59, in every region except Alaska, and for every year of the study. The rate of new HIV diagnoses among men aged 40-44 was higher than among any other age group (<13, 13-14, 15-19, 20-24, 25-29, 50-54, 55-59, 60-64, and ≥65, all P < .001; 30-34, P = .005; 35-39, P = .05), except for those aged 45-49 (P = .11). The rate of new HIV diagnoses in the Southwest region (19.9 per 100 000 AI/ANs) was significantly higher than in all other regions (P < .001) except for the East (18.3 per 100 000 AI/ANs, P = .46) and accounted for 44.7% of new HIV diagnoses.
Characteristics of American Indian/Alaska Natives (AI/ANs) newly diagnosed with HIV,a by sex, based on first occurrence of HIV-associated hospitalizations or outpatient visits, Indian Health Service, 2005-2014b
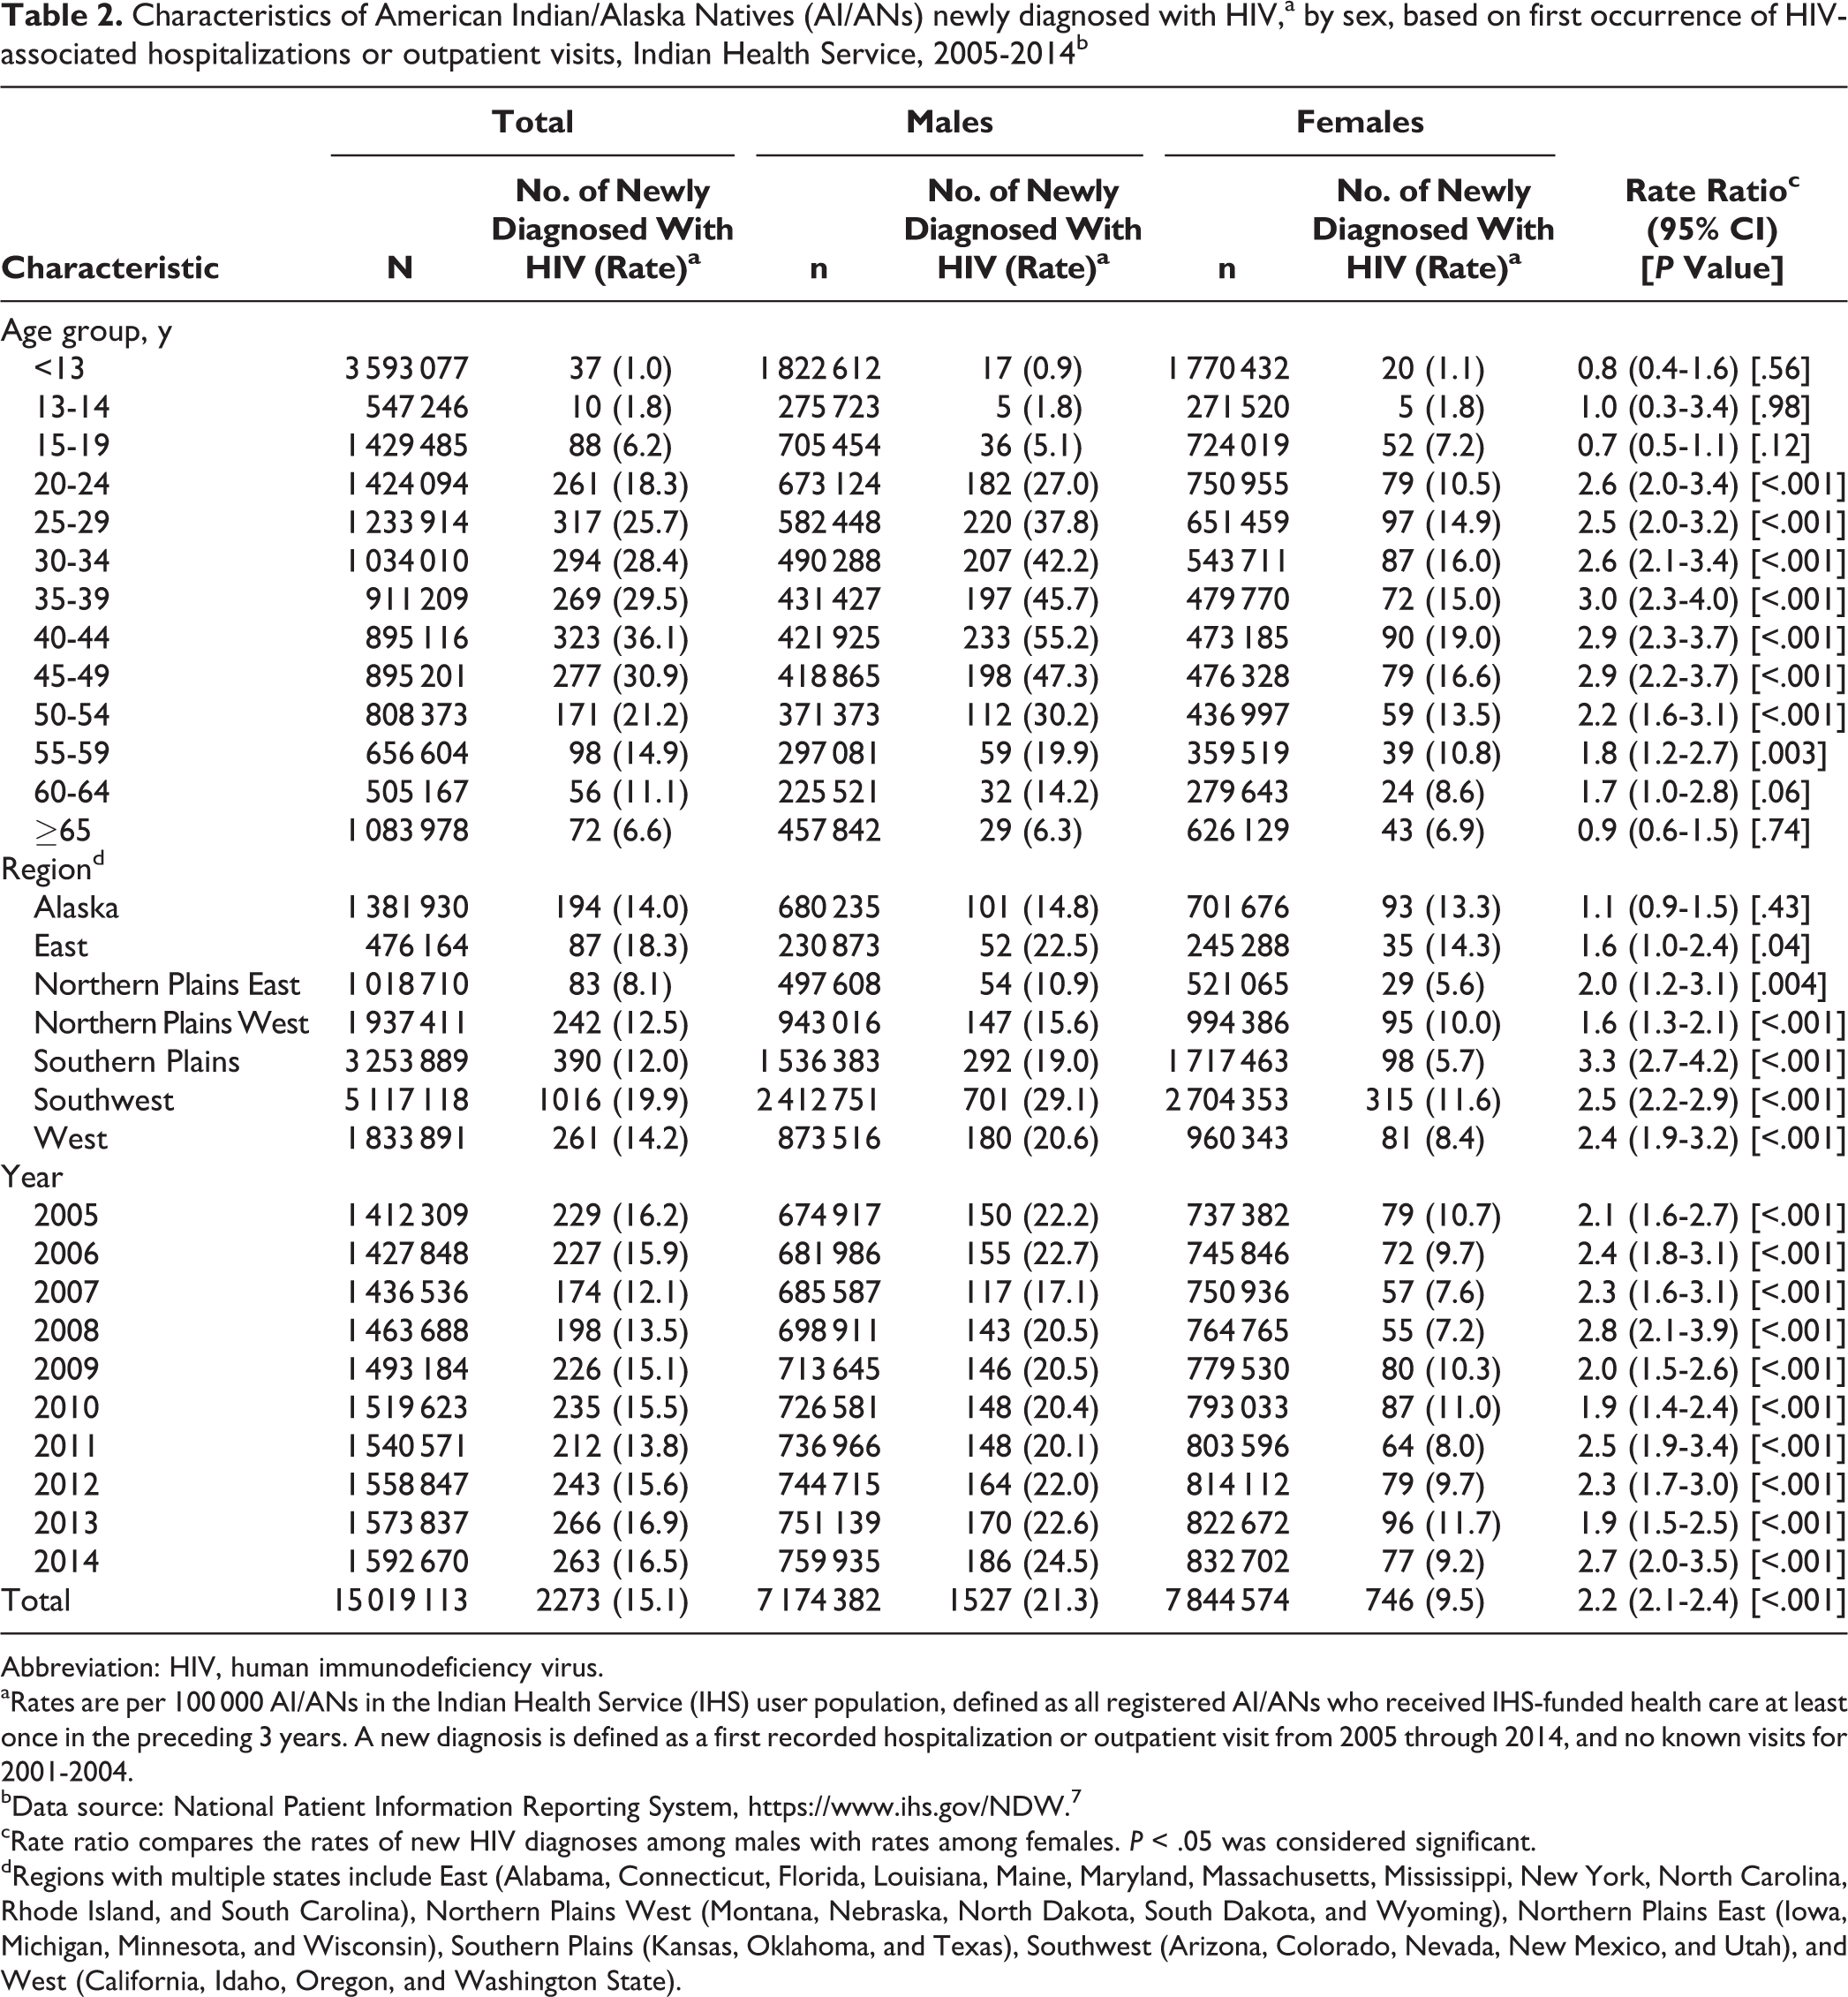
Abbreviation: HIV, human immunodeficiency virus.
aRates are per 100 000 AI/ANs in the Indian Health Service (IHS) user population, defined as all registered AI/ANs who received IHS-funded health care at least once in the preceding 3 years. A new diagnosis is defined as a first recorded hospitalization or outpatient visit from 2005 through 2014, and no known visits for 2001-2004.
bData source: National Patient Information Reporting System, https://www.ihs.gov/NDW. 7
cRate ratio compares the rates of new HIV diagnoses among males with rates among females. P < .05 was considered significant.
dRegions with multiple states include East (Alabama, Connecticut, Florida, Louisiana, Maine, Maryland, Massachusetts, Mississippi, New York, North Carolina, Rhode Island, and South Carolina), Northern Plains West (Montana, Nebraska, North Dakota, South Dakota, and Wyoming), Northern Plains East (Iowa, Michigan, Minnesota, and Wisconsin), Southern Plains (Kansas, Oklahoma, and Texas), Southwest (Arizona, Colorado, Nevada, New Mexico, and Utah), and West (California, Idaho, Oregon, and Washington State).
Most facilities (356 of 391) had at least 1 new HIV diagnosis; the number of new HIV diagnoses per facility ranged from 0 to 287 during the study period. Most of the 2273 new HIV diagnoses (n = 2029, 89.3%) had at least 1 ICD-9-CM code for confirmed HIV, including the following: 042 (n = 1209, 53.2%), V08 (n = 758, 33.3%), and 079.53 (n = 73, 3.2%). One hundred ninety (8.4%) records were coded 795.71 (indeterminate HIV test result), with no additional HIV codes. An opportunistic infection was seen within 90 days before or after the hospitalization or outpatient visit among 459 of 2273 (20.2%) new HIV diagnoses.
Overall, the annual rate of new HIV diagnoses among AI/ANs was stable from 2010 (15.5 per 100 000 AI/ANs) through 2014 (16.5 per 100 000 AI/ANs; test for trend over time P = .11). Rates of new HIV infection increased significantly among males (P < .001); among those aged 15-19 (P < .001), 45-49 (P < .001), and 50-54 (P = .012); and in the Southwest region (P = .002) (Table 3). Rates of new HIV infection decreased significantly among adults aged 35-39 from 2010 through 2014 (P = .043). Annual rates of new HIV diagnoses varied widely because of small numbers in some categories.
Numbers and ratesa of new HIV diagnoses among American Indian/Alaska Natives (AI/ANs) based on first occurrence of HIV-associated hospitalizations or outpatient visits, Indian Health Service, 2010-2014b
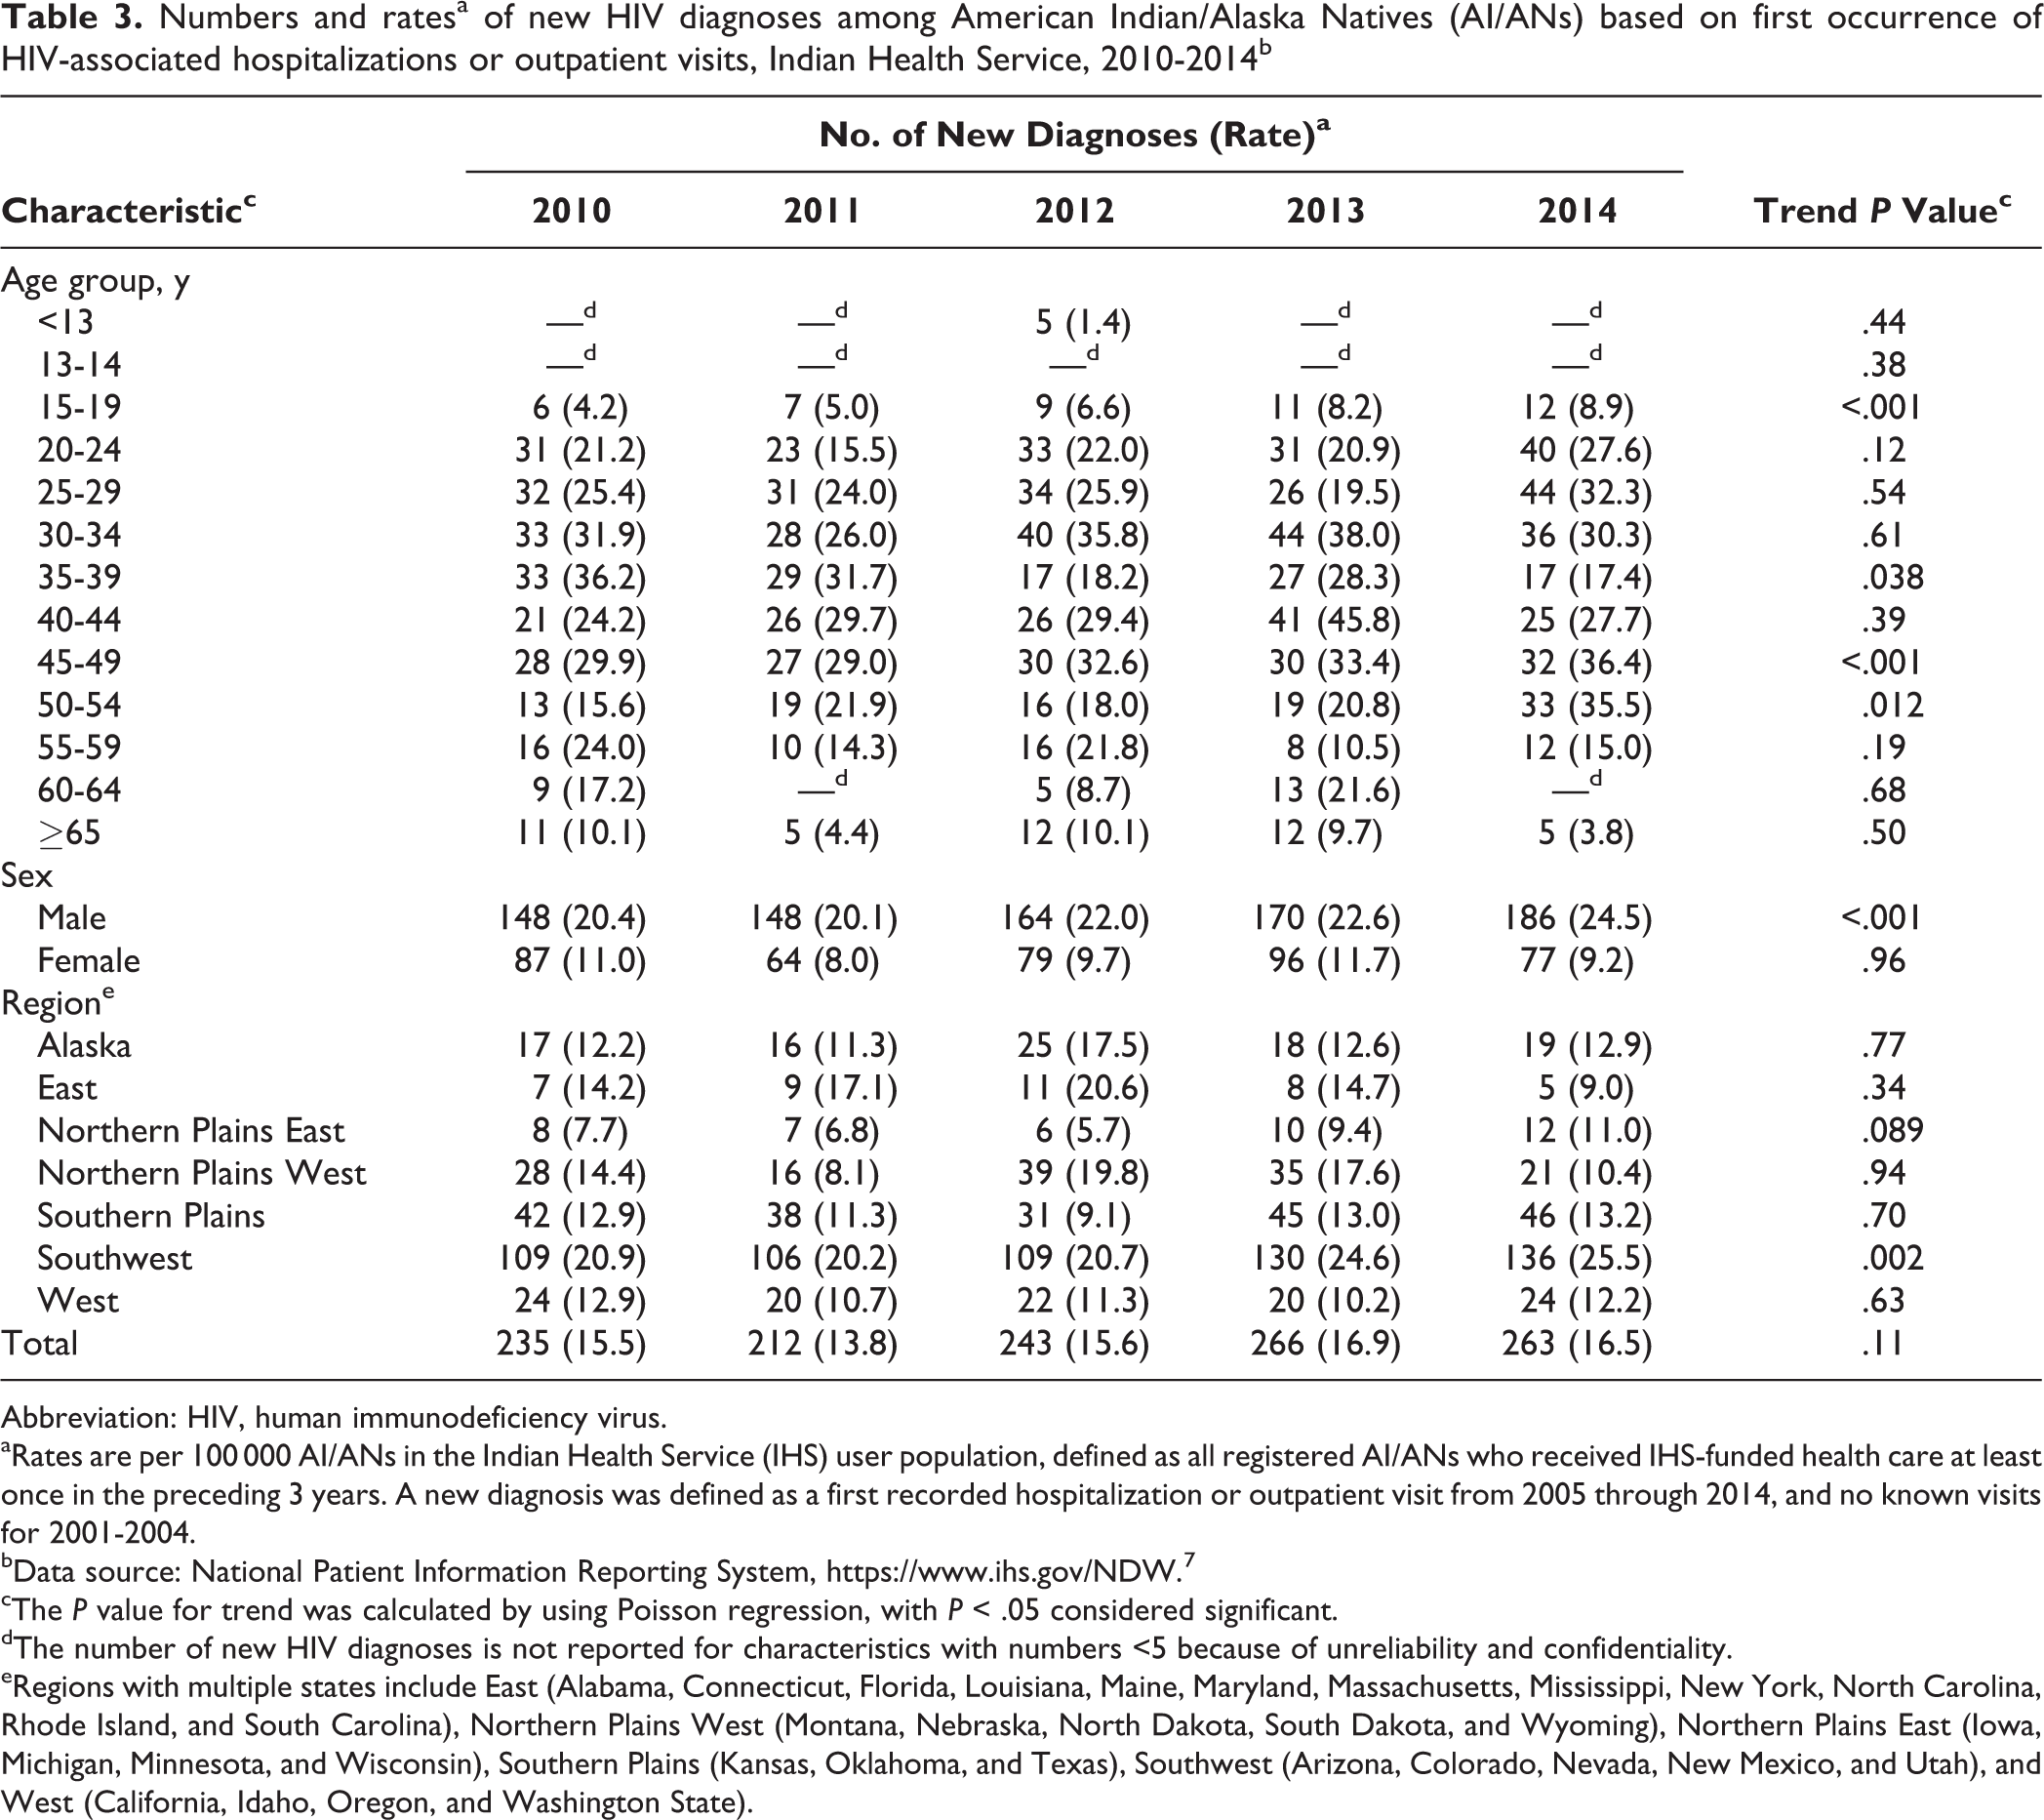
Abbreviation: HIV, human immunodeficiency virus.
aRates are per 100 000 AI/ANs in the Indian Health Service (IHS) user population, defined as all registered AI/ANs who received IHS-funded health care at least once in the preceding 3 years. A new diagnosis was defined as a first recorded hospitalization or outpatient visit from 2005 through 2014, and no known visits for 2001-2004.
bData source: National Patient Information Reporting System, https://www.ihs.gov/NDW.7
cThe P value for trend was calculated by using Poisson regression, with P < .05 considered significant.
dThe number of new HIV diagnoses is not reported for characteristics with numbers <5 because of unreliability and confidentiality.
eRegions with multiple states include East (Alabama, Connecticut, Florida, Louisiana, Maine, Maryland, Massachusetts, Mississippi, New York, North Carolina, Rhode Island, and South Carolina), Northern Plains West (Montana, Nebraska, North Dakota, South Dakota, and Wyoming), Northern Plains East (Iowa, Michigan, Minnesota, and Wisconsin), Southern Plains (Kansas, Oklahoma, and Texas), Southwest (Arizona, Colorado, Nevada, New Mexico, and Utah), and West (California, Idaho, Oregon, and Washington State).
Discussion
The rates of new HIV diagnoses among the AI/ANs reported in our study using IHS data were nearly 2 times those seen in the national HIV surveillance report 1 produced by using data from the National HIV Surveillance System (NHSS). The NHSS uses census estimates of the US AI/AN population to calculate rates of new HIV infection; this study used the total population served by the IHS to calculate similar rates and, therefore, the two are not directly comparable, but are estimates of two overlapping but different populations. In addition, only confirmed HIV diagnoses are counted in NHSS data, whereas we also included diagnoses with indeterminate HIV test results in our analysis. Racial misclassification among AI/ANs is rare in the IHS because documentation of AI/AN status is required to determine patient eligibility. Therefore, from the point of view of racial misclassification, we consider IHS NPIRS data to be a more accurate representation of the AI/AN population.
Our study showed that the rate of new HIV diagnoses was highest among males and those aged 20-59. Males had higher rates of new HIV infection across nearly all demographic categories and during the entire study period than did females and accounted for most new diagnoses. The rate of new HIV diagnoses among males also increased during 2010 through 2014. Understanding this trend can assist in shaping policies that target AI/AN males with culturally appropriate prevention messages, use of the latest testing technology to detect diagnoses of acute HIV infection, and linkage to services (eg, pre-exposure prophylaxis).
We found that 1 in 5 AI/ANs had an opportunistic infection within 90 days before or after a new HIV diagnosis, a proxy for late diagnosis of HIV; conversely, although measured by using a different method, an estimated 39% of people in the general US population had an opportunistic infection within 90 days before or after a new HIV diagnosis, according to data from 1996-2005. 11 If our results represent earlier detection of HIV infection in the IHS, this may be partially attributable to wide adoption of routine HIV screening of adults and adolescents per national recommendations. 12 Of note, AI/ANs have significantly higher death rates from HIV than non-Hispanic white people. IHS data do not implicate late diagnosis as a contributing factor and may point to a need for research assessing other possible factors that contribute to this disparity, such as access to care or adherence to treatment. 13
Whether certain trends, such as relatively high rates of new HIV diagnoses in the Southwest compared with other regions, indicate increased case finding through screening or elevated incidence is unclear. According to internal IHS data, IHS facilities in the Southwest region have the highest HIV screening coverage among those aged 13-64 nationwide, which may increase the detection of previously undiagnosed HIV. The Southwest region of the IHS also has the highest burden of syphilis, 14 which is known to be correlated with HIV incidence.
Limitations
Our study had several limitations. First, new HIV diagnoses reflect a newly detected HIV infection in a user of the IHS network as defined by an ICD-9-CM code; however, patients could seek care outside of the IHS system, which would not be recorded in NPIRS. To the extent that this occurred, there is potential for undercounting or overcounting annual numbers within the IHS data due to misclassifying the initial date of HIV diagnosis. However, this limitation is shared with national CDC surveillance data, and there was no reason to assume bias in directionality (ie, both overcounting and undercounting may have an equal probability of occurrence). In addition, a new HIV diagnosis does not necessarily indicate recent infection; a person may have been infected for a long time before the disease was diagnosed, thereby limiting our ability to determine the incidence of new infection. IHS NPIRS data do not include laboratory results, so this study relied strictly on ICD-9-CM coding for a definition of new HIV diagnoses. This study used a sensitive definition of HIV by including indeterminate HIV test results that can be recorded with an ICD-9-CM code; although only 8% of new diagnoses in this study came from this code, this inclusion may have led to an overestimation of new HIV diagnoses.
Conclusions
We found that the rate of new HIV diagnoses, based on provider visit data among IHS users, was stable from 2010 through 2014. AI/ANs aged 20-54, particularly men, may benefit from increased HIV prevention and screening efforts. Our findings on HIV trends may help tribal, federal, and state health entities serving tribal nations better target efforts on HIV prevention, screening, and linkage to care among AI/ANs. Furthermore, our analysis suggests that the rates and numbers of new HIV diagnoses in the AI/AN population reported to national surveillance may be underestimated because of racial/ethnic misclassification.
Footnotes
Declaration of Conflicting Interests
The authors declared no potential conflicts of interest with respect to the research, authorship, and/or publication of this article.
Funding
The authors disclosed receipt of the following financial support for the research, authorship, and/or publication of this article: The authors acknowledge the support of the US Department of Health and Human Services Secretary’s Minority AIDS Initiative Fund.