
Abstract
Objectives:
The Colorado BMI Monitoring System was developed to assess geographic (ie, census tract) patterns of obesity prevalence rates among children and adults in the Denver-metropolitan region. This project also sought to assess the feasibility of a surveillance system that integrates data across multiple health care and governmental organizations.
Materials and Methods:
We extracted data on height and weight measures, obtained through routine clinical care, from electronic health records (EHRs) at multiple health care sites. We selected sites from 5 Denver health care systems and collected data from visits that occurred between January 1, 2013, and December 31, 2015. We produced shaded maps showing observed obesity prevalence rates by census tract for various geographic regions across the Denver-metropolitan region.
Results:
We identified clearly distinguishable areas by higher rates of obesity among children than among adults, with several pockets of lower body mass index. Patterns for adults were similar to patterns for children: the highest obesity prevalence rates were concentrated around the central part of the metropolitan region. Obesity prevalence rates were moderately higher along the western and northern areas than in other parts of the study region.
Practice Implications:
The Colorado BMI Monitoring System demonstrates the feasibility of combining EHRs across multiple systems for public health and research. Challenges include ensuring de-duplication across organizations and ensuring that geocoding is performed in a consistent way that does not pose a risk for patient privacy.
Neighborhood characteristics are associated with overweight and obesity, independent of individual factors. 1 Despite some leveling of historically high obesity rates among children aged 2-5 years, 2 obesity is one of the most pressing lifespan public health issues of the 21st century. 3,4 Clinically obese persons incur higher health care expenses 5,6 and have a higher risk for obesity-related diseases than persons who are not clinically obese. 7 Geographic patterns of obesity vary substantially. 8,9 Studies have found an association between various individual factors and obesity, including education, smoking status, age, and ethnicity. 8,10 -14 However, obesity is deeply influenced by structural and environmental factors, such as the availability of health food options and recreational activities. 15,16
State population-based monitoring systems (ie, the Behavioral Risk Factor Surveillance System 17 [BRFSS]) annually monitor data on obesity and related conditions and outcomes, which are often reported for adults at the county level. Previous reports on obesity prevalence have been challenged for relying on data collected on small sample sizes, 18 using self-reported data 1,17 (eg, driver’s license height or weight 19 ), or aggregating data to large geographic areas. 20,21 Establishing population health monitoring systems with local-level geographic analyses can inform targeted interventions, help evaluate programs, and serve as an important tool for policy development. 22,23
This study had 2 objectives: (1) describe the development of a pilot local-scale body mass index (BMI) monitoring system for BMI data collected on height and weight during routine clinical care visits and (2) use these data to assess geographic patterns of estimates of obese children and adults focused on the Denver-metropolitan region.
Materials and Methods
This project used electronic health record (EHR) data from the Colorado BMI Monitoring System, a collaborative effort among public health agencies, health care systems, and academia that integrates data from 6 health systems. For this study, 5 health care organizations, each with multiple clinic locations, contributed data for persons residing in the Denver-metropolitan region.
Study Population
Denver-metropolitan region patients from Children’s Hospital Colorado, Denver Health, Kaiser Permanente Colorado, Metro Community Provider Network, and Salúd Family Health Centers were available for inclusion if they had a clinical visit with data on a recorded height and weight in an EHR between January 1, 2013, and December 31, 2015. Three sites (Denver Health, Metro Community Provider Network, and Salúd Family Health Centers) are federally qualified health centers whose patient populations generally have low incomes.
Study Setting
The study included 5 clinical systems within the Denver-metropolitan region (population ∼2.7 million). Consequently, the study area was defined as the 7-county Denver-metropolitan region, which included Adams, Arapahoe, Boulder, Broomfield, Denver, Douglas, and Jefferson counties in Colorado.
Data Collection
We extracted data on height and weight obtained as part of routine clinical care during the study period (2013-2015) from EHRs at each health care system in 2016. We also extracted data on demographic characteristics, including address, age, sex, and race/ethnicity, which were recorded as part of EHR registration. Each health system cleaned its EHR data, including de-duplication for each patient. De-duplication across health systems was not feasible.
The Colorado Department of Public Health and Environment (CDPHE) served as a trusted broker across institutions and acted as the hub for data storage, aggregation, and dissemination. CDPHE and the participating health systems worked closely to develop a collaborative governance structure, data model, and data flow plan. Each participating site transferred data to CDPHE through a secure file transfer protocol mechanism. The resulting data represented children and adolescents (aged 2-17 years) and adults (aged ≥18 years) who presented during the study period for routine care at 1 of the participating health care organizations and had data on at least 1 height and weight measurement. We obtained human subjects approval for this study from the Colorado Multiple Institutional Review Board and the Kaiser Permanente Institutional Review Board.
Geocoding
Geocoding refers to the process of transforming the patient’s written address into spatially referenced coordinates that can be manipulated in a geographic information system (GIS). Kaiser Permanente Colorado and Denver Health performed their own geocoding using GIS software and address data from EHRs. For sites that did not have their own geocoding software, CDPHE matched addresses to the census tract in which persons most recently resided at the time of last visit, using geocoding solutions (either Centrus Desktop 24 or MapMarkerUSA Desktop 25 ). Geocoded EHRs were then aggregated across study sites into a single analytic database.
Data Processing and Analysis
We calculated BMI by using the most recent height and weight (in kg/m2) measurement for each person. We then processed all measures by using Centers for Disease Control and Prevention (CDC) algorithm software 26 to assess the validity of measured height, weight, and resulting BMI calculation. For adults aged ≥18, we defined obese as a BMI ≥30 kg/m2. 27 For children and adolescents aged 2-17 years, we plotted individual height and weight measures on the CDC male or female BMI-for-age growth chart to determine a BMI percentile. We defined children and adolescents as obese if their BMI plotted at ≥95th percentile. 26,28,29 With a valid BMI and geolocation established, we aggregated all records based on patient’s census tract of residence and then stratified them by age group. Using the 2011-2015 American Community Survey, 30 5-year estimated total census population and boundaries, we calculated unadjusted estimated obesity prevalence rates for children, adolescents, and adults at the census-tract level. We defined the population coverage rate as the proportion of children, adolescents, and adults living in a census tract who were represented in the aggregated cohort for that census tract.
We calculated the percentage of observed children, adolescents, and adults who were obese for each census tract by dividing the number of obese persons by the total number of valid BMI measurements observed from that census tract. We designated census tracts as having insufficient data if (1) there were <50 valid BMI measurements, (2) the number of valid BMI measurements was <10% of the census-reported adult population, or (3) the number of valid BMI measurements was <20% of the census-reported children and adolescent population.
We also calculated the range of values for a given prevalence estimate that fell within a specified probability to produce a 95% confidence interval (CI) for each census tract. We developed a detailed census-tract table that contained the estimated population (American Community Survey 2011-2015), the number and percentage of persons with a valid BMI measurement, and the percentage of the population with an obese BMI measurement with 95% CIs for each census tract. We used these detailed census tract-aggregated tables to create maps and tables for dissemination posted to a website hosted by CDPHE. 31
Map Design
The mapping process was iterative; we reviewed data and made subsequent revisions until we reached consensus. Map design was guided by previous work in health mapping 32 -34 and was driven by the goal of exploring observed BMI patterns while producing information that would be intuitive, appealing, and easy to read for the target audiences (public health workers, researchers, and community members). We included orienting features, such as county boundaries, neighborhood boundaries, and major roads, to provide map users with geographic context. We classified data by using the standardized cut-point categories adopted by CDC in its series of obesity maps. 21 We produced shaded maps showing the observed rates of obesity by census tract for various study regions, including the full 7-county area and the city and county of Denver. We used hatched markings on the maps to identify census tracts that had insufficient data.
Results
The total number of children and adolescents who had valid BMI measurements within the 7-county Denver-metropolitan region was 290 150, covering approximately 41.3% of the total population of children and adolescents from American Community Survey estimates. The total number of adults who had valid BMI measurements within the 7-county Denver-metropolitan region was 588 146, or 26.1% of the total adult population.
We found geographic differences in obesity prevalence rates across the Denver-metropolitan region. Higher population coverage rates were centered in the city and county of Denver, with declining rates by census tract in the towns surrounding Denver (Table 1). Across the 7-county Denver-metropolitan region, the proportion of children and adolescents who were classified as obese was 13.9% and the proportion of adults who were classified as obese was 31.5% (Table 2). The northern and western sides of the Denver-metropolitan region had the highest obesity prevalence rates, and obesity prevalence rates were lower outside of the city. Obesity prevalence rates were generally higher and less varied among adults than among children and adolescents. Patterns of variation in obesity prevalence rates on the maps were distributed more randomly with less distinct clustering among adults than among children.
Population coverage ratesa for the 7-county Denver-metropolitan region and city and county of Denver, Colorado, 2013-2015b
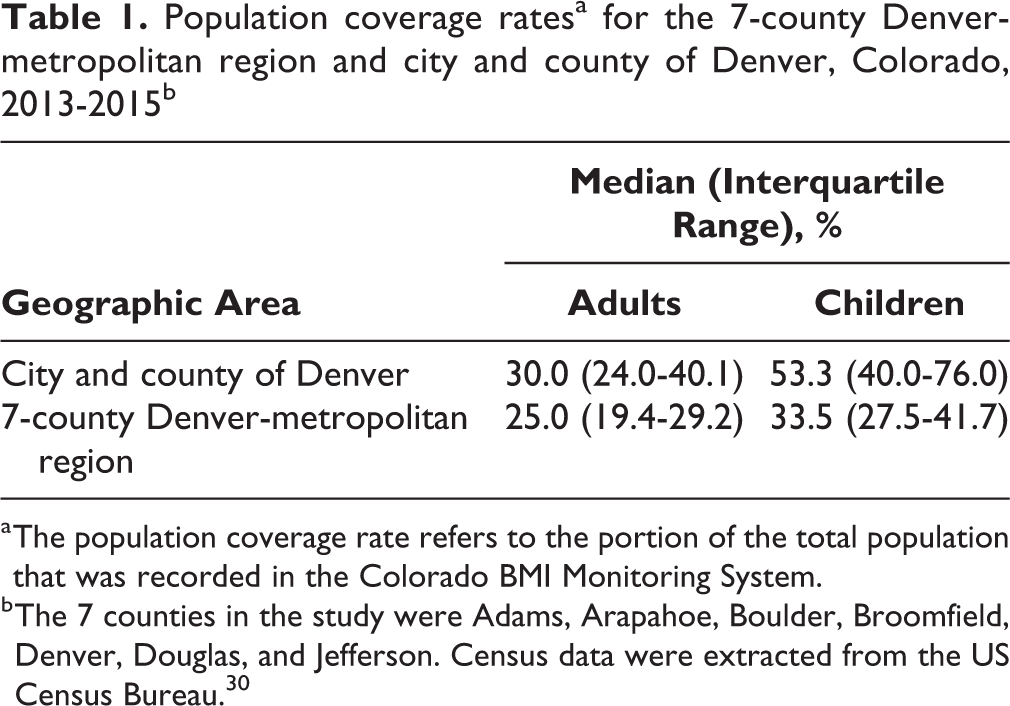
a The population coverage rate refers to the portion of the total population that was recorded in the Colorado BMI Monitoring System.
b The 7 counties in the study were Adams, Arapahoe, Boulder, Broomfield, Denver, Douglas, and Jefferson. Census data were extracted from the US Census Bureau. 30
Estimated prevalence of obesity among children, adolescents, and adults, 7-county Denver-metropolitan region and city and county of Denver, Colorado, 2013-2015a
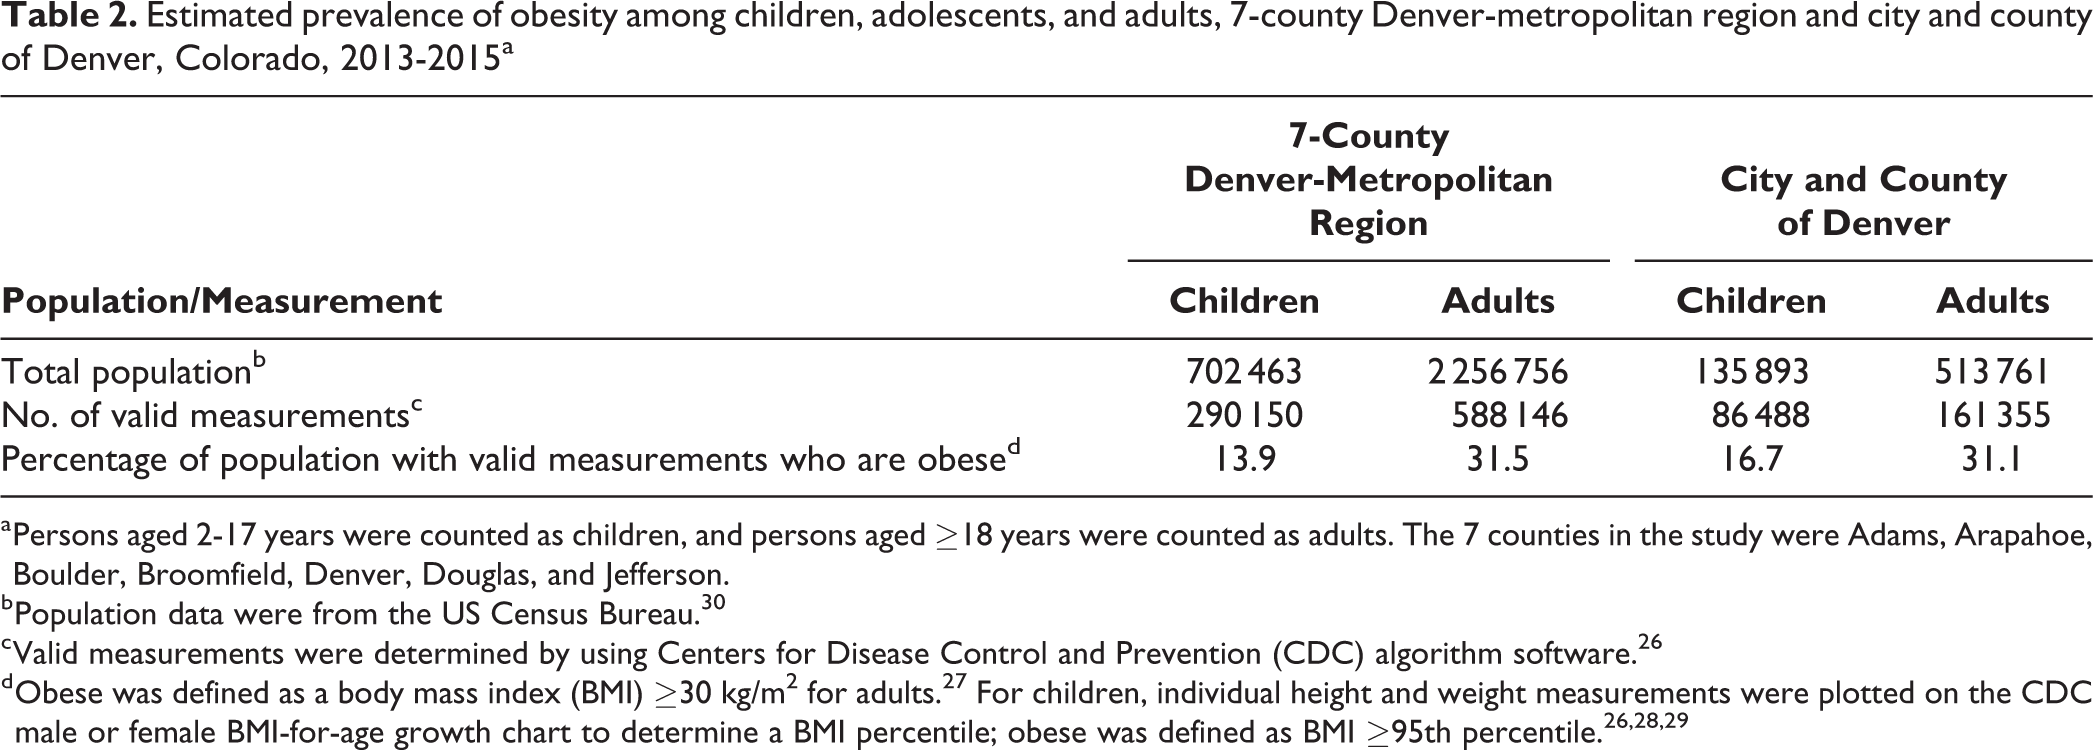
a Persons aged 2-17 years were counted as children, and persons aged ≥18 years were counted as adults. The 7 counties in the study were Adams, Arapahoe, Boulder, Broomfield, Denver, Douglas, and Jefferson.
b Population data were from the US Census Bureau. 30
c Valid measurements were determined by using Centers for Disease Control and Prevention (CDC) algorithm software. 26
Children and Adolescents
The western and northern thirds of the city were generally characterized by high prevalence rates of obesity (range, 20%-24%) and a few pockets of relatively low BMI (<10%) (Figure 1). Particularly notable was a break in the rates on the east and west sides, a major north–south interstate extending through the middle of the city. Obesity prevalence rates for children and adolescents were clustered in the central areas of the region, with particularly high rates throughout much of the central portion of the city and county of Denver and Aurora.
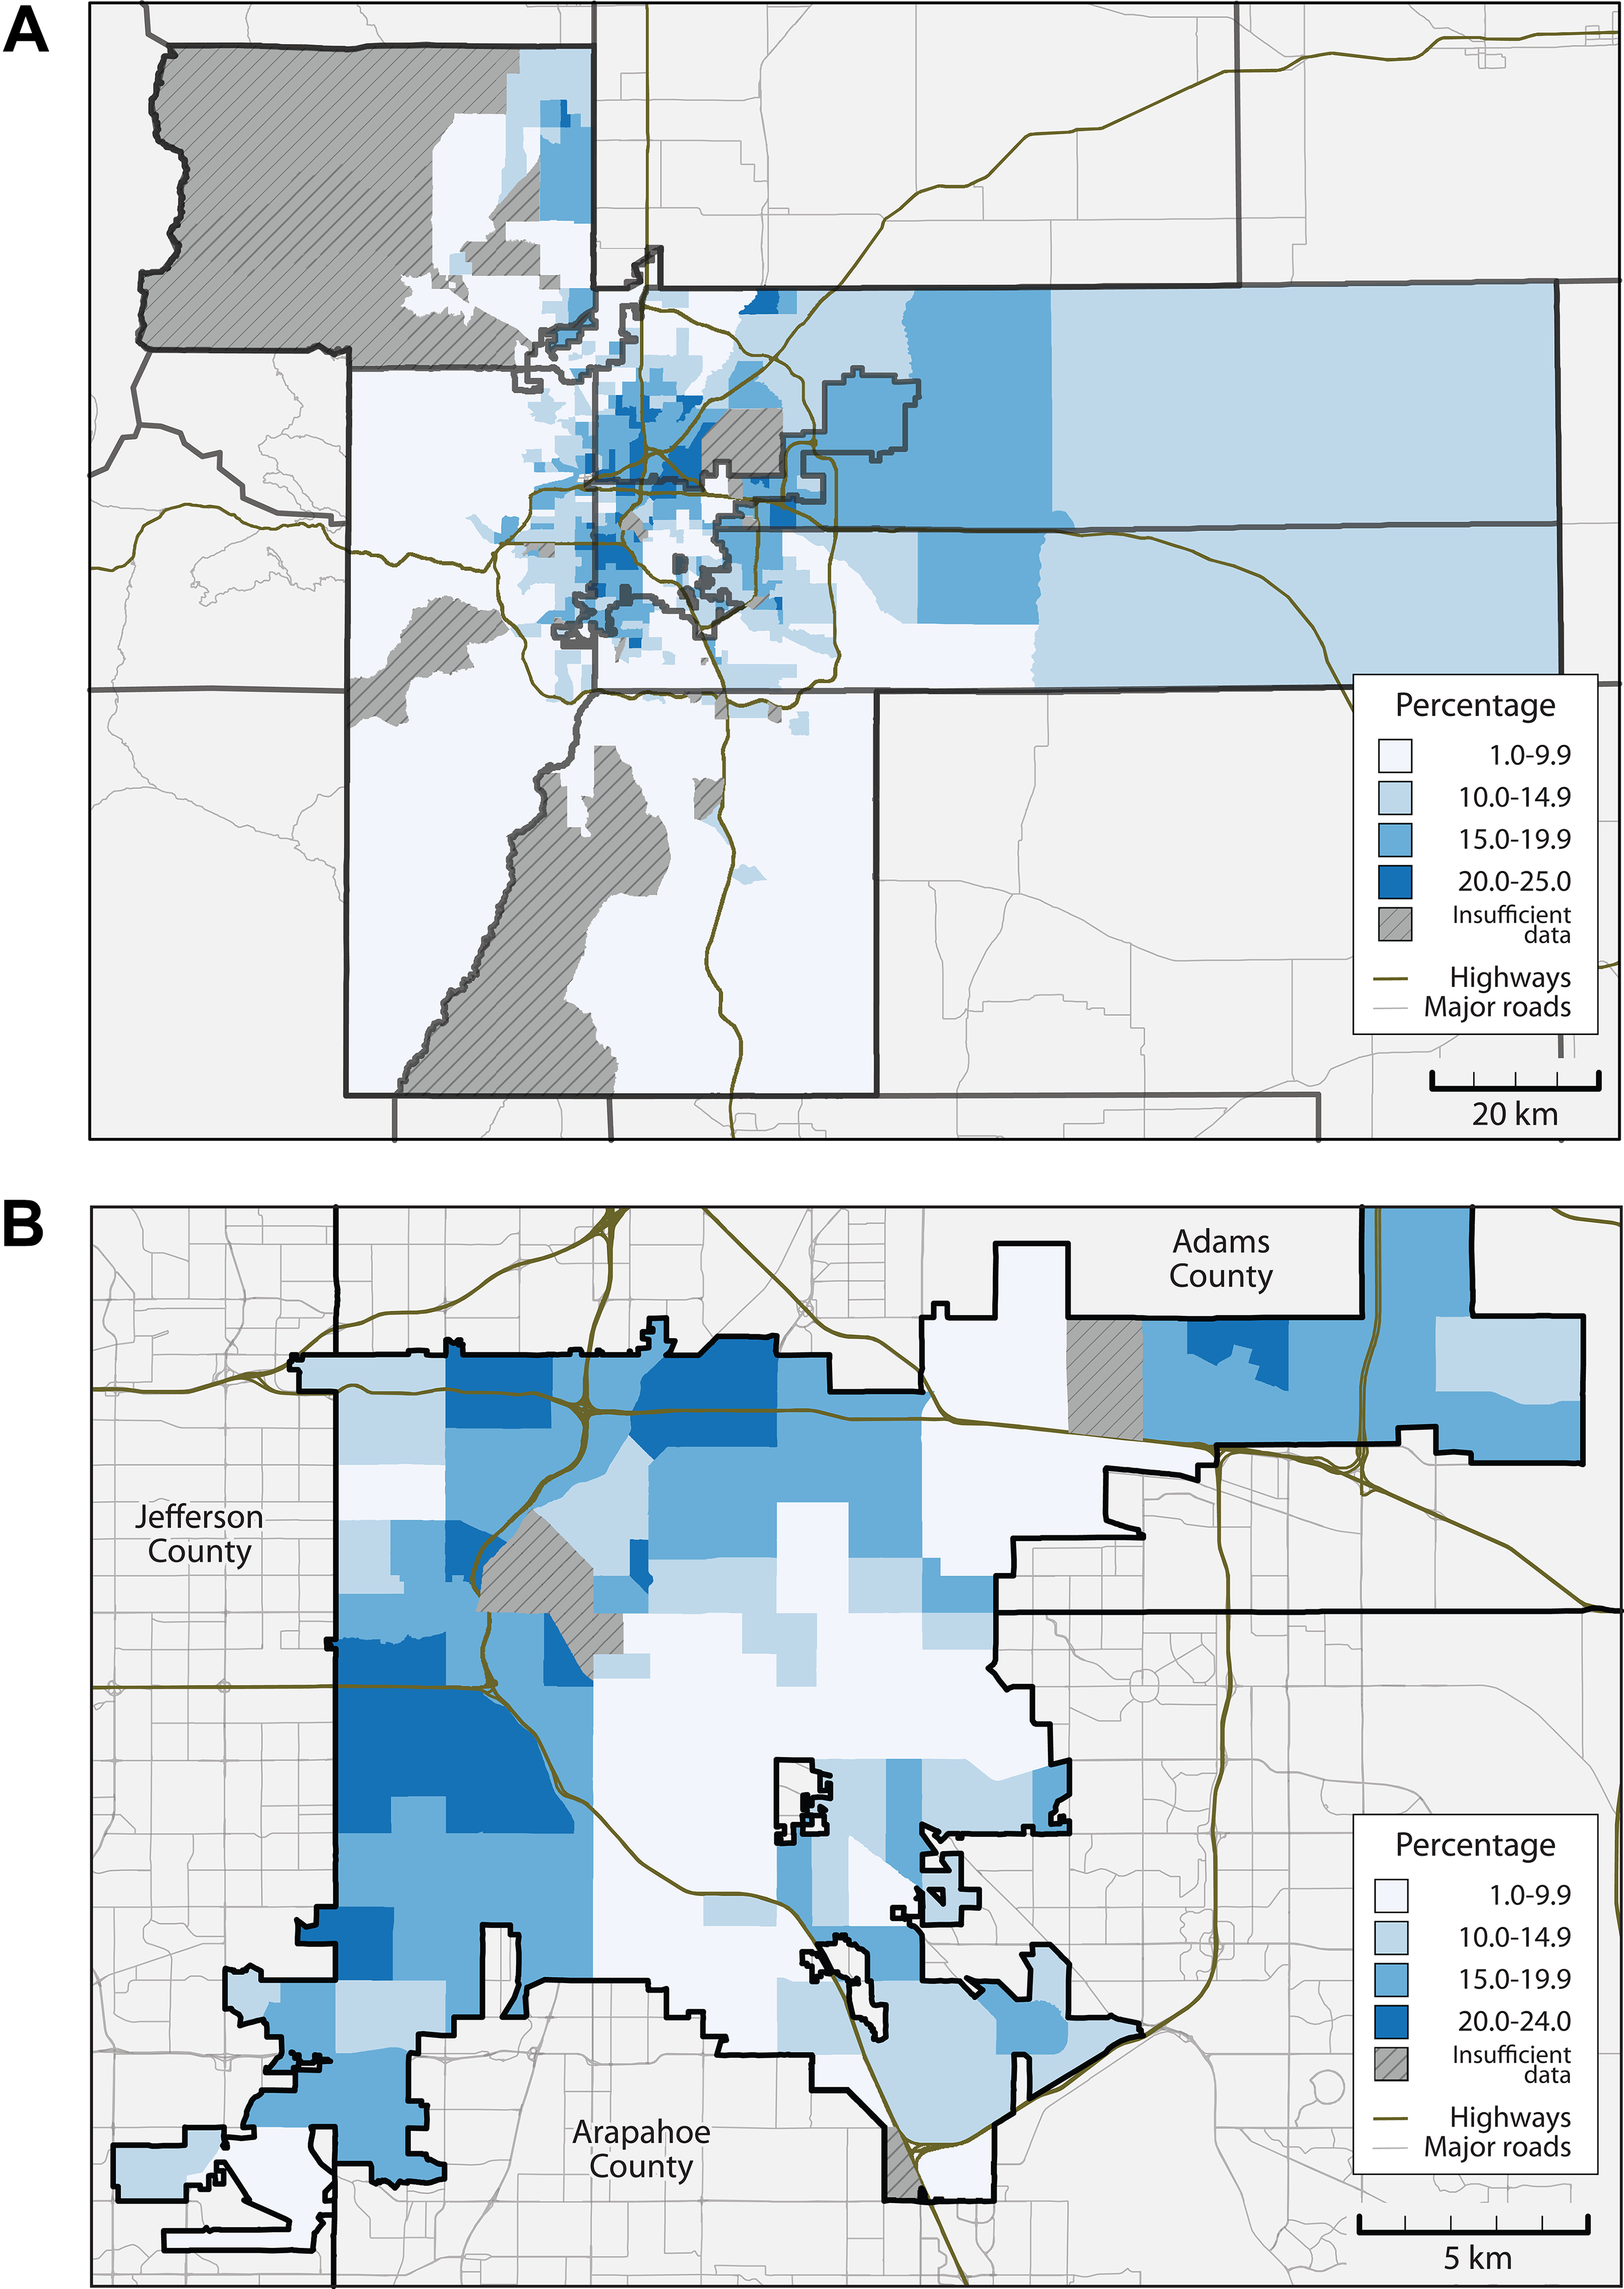
Percentage of observed children and adolescents aged 2-17 years with a body mass index (BMI) indicating obesity, by census tract: (A) for the Denver-metropolitan region and (B) for the city and county of Denver, 2013-2015. Hatched census tracts lack sufficient data, defined as having <50 valid BMI measurements or <20% of the census-reported children and adolescent population.
Adults
Adult obesity prevalence rates across census tracts in the city and county of Denver ranged from 12% to 44% (Figure 2). Similar to obesity prevalence rates for children, obesity prevalence rates for adults were moderately higher along the western and northern corridors than in other parts of the city. When aggregated to census tracts, adult obesity prevalence rates were less variable than children’s obesity prevalence rates. Geographic patterns of higher obesity prevalence rates among adults were generally similar to patterns among children, with relatively higher concentrations in the city and county of Denver and lower rates in the surrounding suburbs.
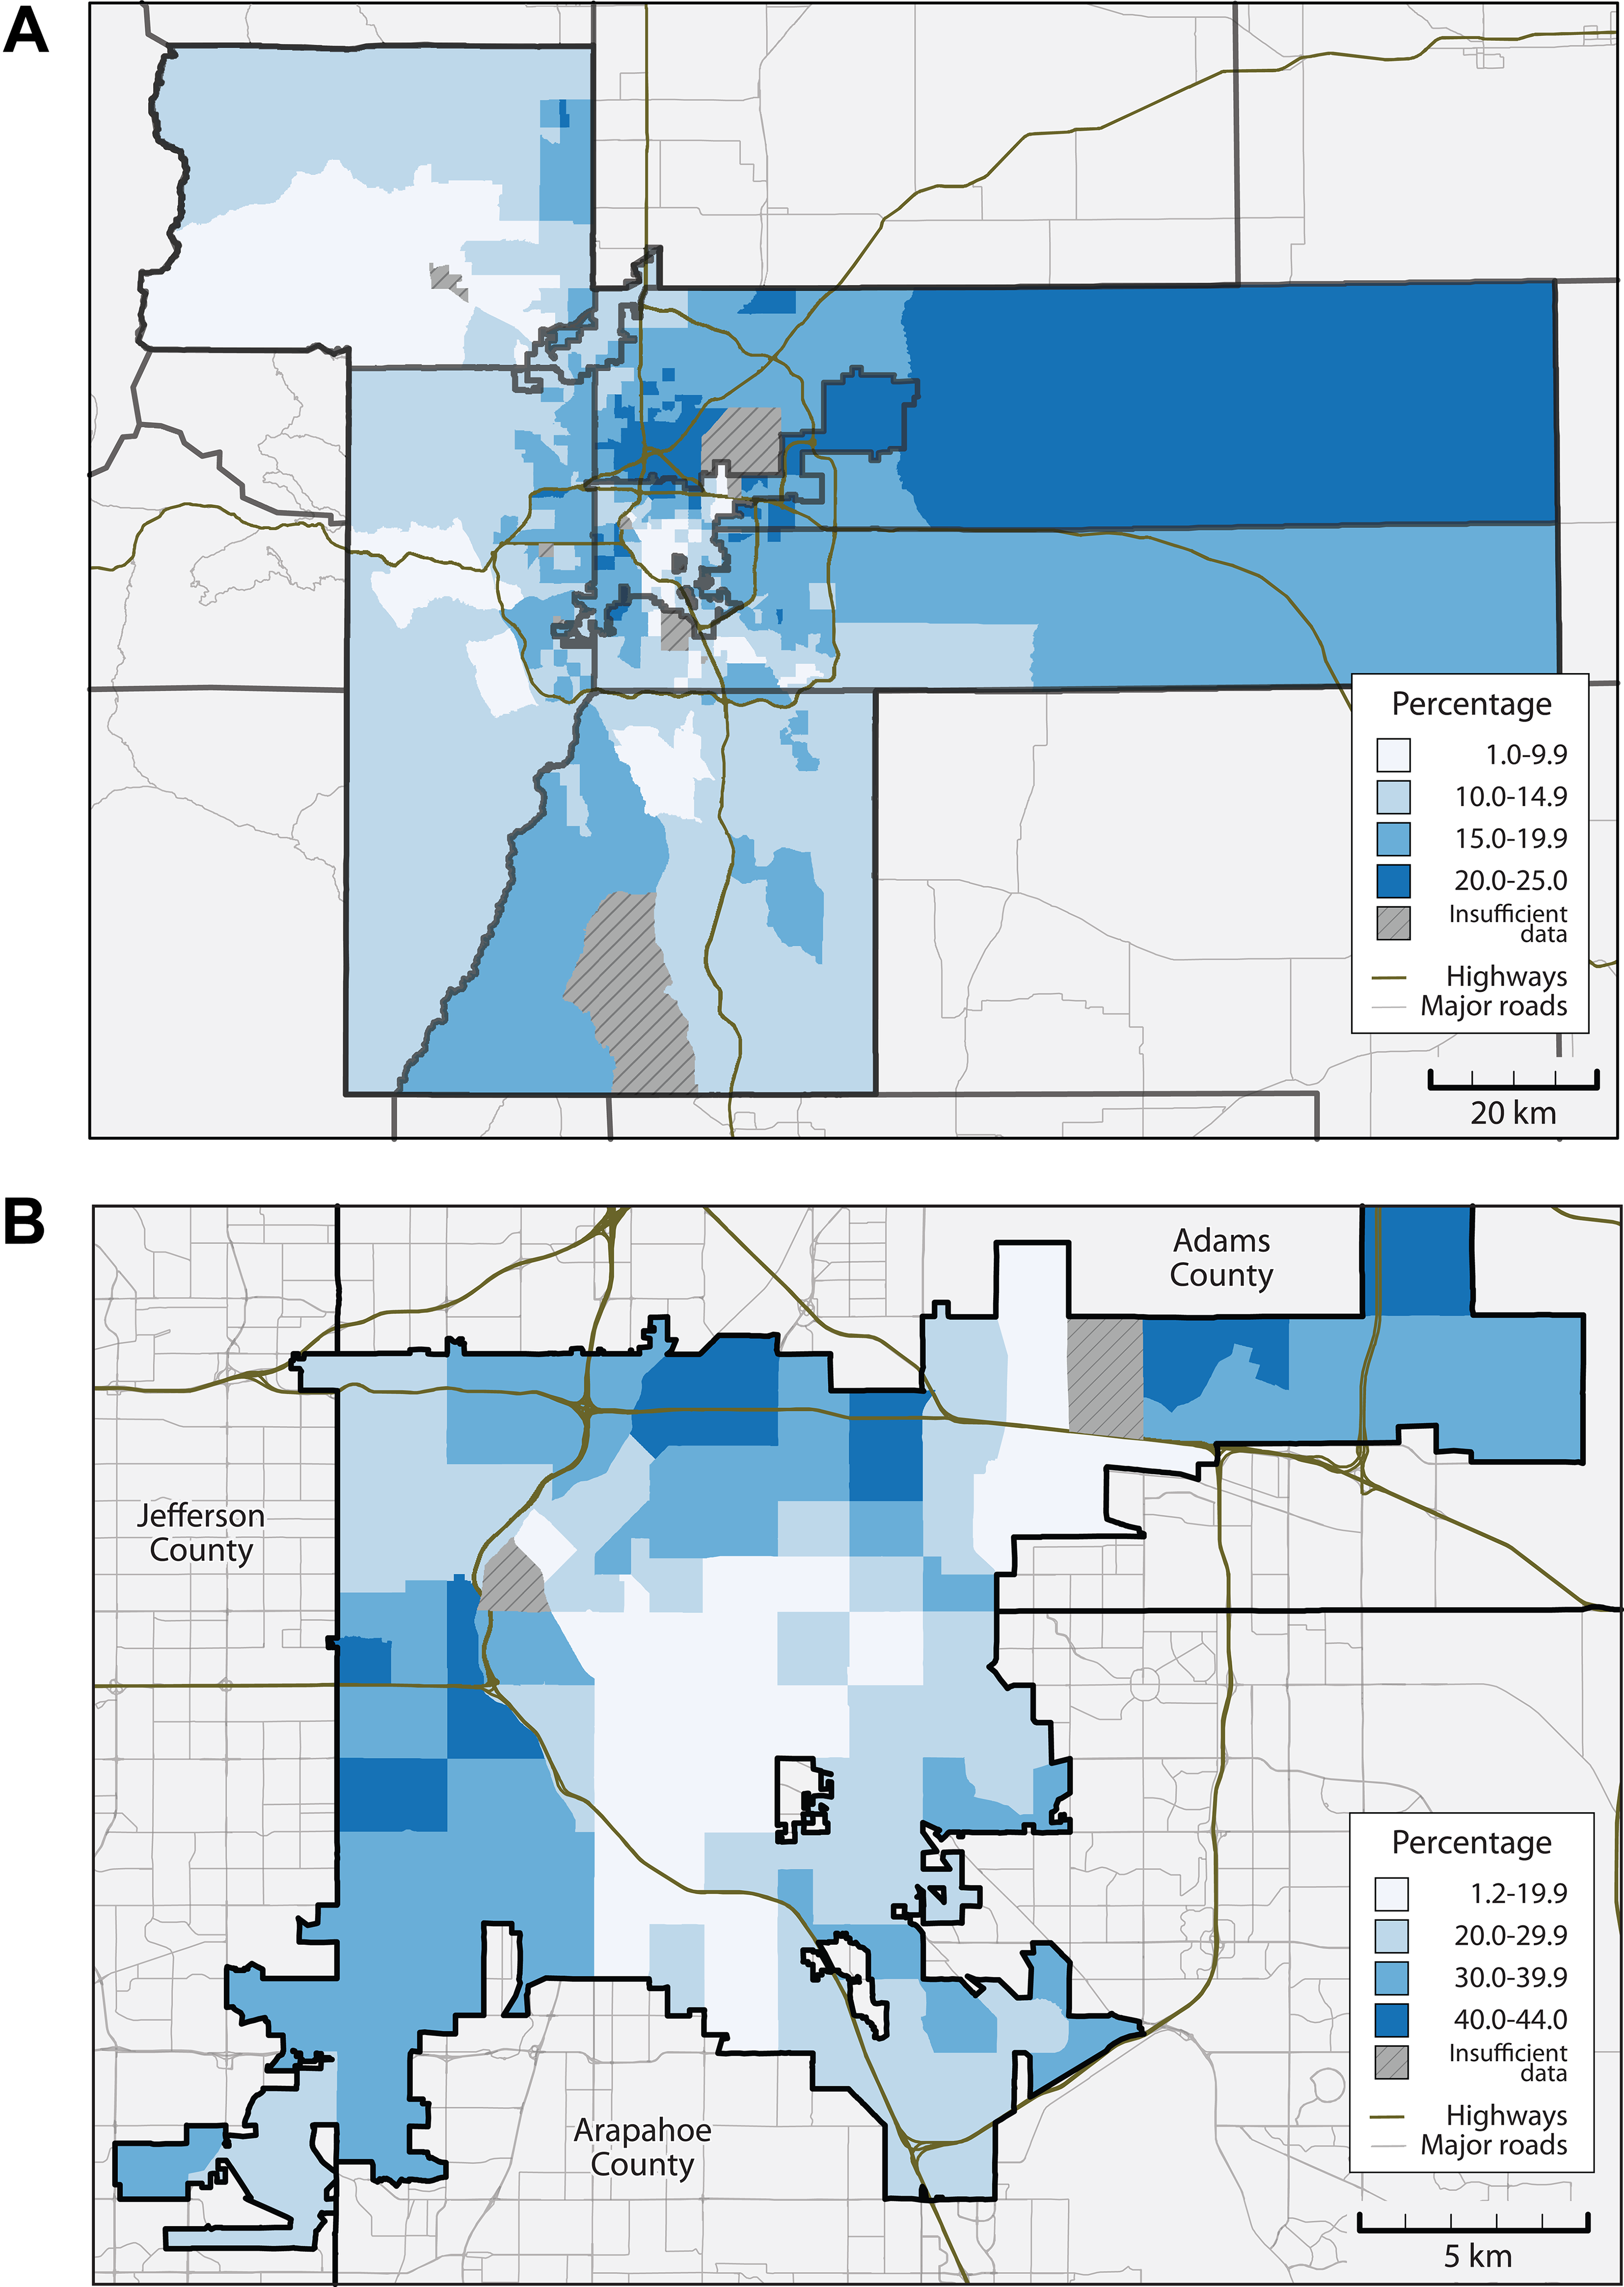
Percentage of observed adults aged ≥18 years with a body mass index (BMI) indicating obesity, by census tract: (A) for the Denver-metropolitan region and (B) for the city and county of Denver, 2013-2015. Hatched census tracts lack sufficient data, defined as having <50 valid BMI measurements or <10% of the census-reported adult population.
Discussion
Public health interventions to address the obesity epidemic span a wide variety of strategies and approaches, from modifying individual behavior to making changes in the physical and social environments. 9,18,35,36 During the last several decades, nonprofit and government organizations in the United States have established programs to provide individuals and targeted communities with assistance and information to improve diet and physical activity behavior. 37 -39 The maps presented in this article highlighted neighborhoods and communities that could benefit from such public health interventions and inform project evaluation.
The data provided by this project offer several advantages over existing surveillance systems, such as the BRFSS. For one, mapping at the census-tract level enables exploration of within-city variations. In addition, the data can be separated into age groups that enable distinction in rates of obesity and overweight between, for example, children and adults. Finally, the Colorado BMI Monitoring System draws from objectively measured clinical data, which yields higher-quality data than self-reported data.
It was important that CDPHE use a consistent geocoding system to define a census tract for all patient addresses submitted to the Colorado BMI Monitoring System, because the use of multiple geocoding applications by participating health care systems could lead to error in the assignment of the census-tract Federal Information Processing Standards code. It should also be noted that the Centrus geocoding system is an in-house solution that performs all processing of address matching and location of addresses within a single desktop computer’s hard drive, and it does not use or communicate with a cloud-based (internet) system. This factor is important when considering how to geocode or assign geographies to protected individual health information.
Population-based factors driven by socioeconomic characteristics, such as income, crime, education, or culture, likely influence the clustering of high rates of obesity. 9,40,41 Facets of the built environment, such as the availability of healthy food sources or physical activity amenities, may also play a role. 1,9,42 Determining mechanisms and interventions for how these factors collectively drive or modify these patterns is a persistent and difficult public health challenge. Access to such a monitoring system may provide additional opportunity to explore these relationships.
Over time, systems such as the Colorado BMI Monitoring System can provide a platform for assessing trends in obesity prevalence rates, including changes in the spatial patterns of obesity. Research shows that BMI data collected in routine clinical care can identify trends in obesity rates among children in clinical settings. 42 EHR observations may be repeated for an individual, which would permit a longitudinal perspective to a citywide obesity surveillance system. Such temporal trend analyses, combined with spatial components, may provide new study opportunities on obesity prevalence rates. By identifying census tracts with high rates of obesity, programs and initiatives—such as the construction of new playgrounds and park spaces, community-based efforts to encourage healthy food vendors, and the establishment of urban gardens—could be tailored to environments and then evaluated for their impact on local obesity prevalence rates.
Government agencies involved with urban planning, school districts, and public health agencies all have engaged in strategic approaches to the obesity epidemic. Civic groups and neighborhood organizations also work to improve the living conditions and healthiness of their neighborhoods and communities. For example, members of the study team used obesity prevalence maps provided from this project to engage with community groups in discussions about the obesity epidemic in 2016. Efforts such as this mapping project can serve to integrate efforts across organizations and agencies and to inform advocacy efforts by neighborhood organizations. High-quality surveillance data can also inform social scientific research on the underlying environmental determinants of obesity. In previous work, for example, data on BMI were combined with other health outcome measures to examine relationships and explore the social determinants of health. 43,44
The Colorado BMI Monitoring System is among the first census tract–level EHR-based surveillance maps that confirmed the feasibility of this surveillance approach and provided the first look at community-level variation in health outcomes, both of which justified investment into an EHR-based surveillance network. This project ultimately informed the Colorado Health Observation Regional Data Service (CHORDS), a Denver regional network intended to provide electronic surveillance data for public health research and policymaking. 45,46 For example, this study demonstrated that the state health department could efficiently provide geocoding for multiple contributing data partners. A comparison analysis validated that geocoding results (ie, census tract of residence) did not differ significantly across geocoding software, which allowed data contributors to use geocoding tools of their choice. The CHORDS project was also able to borrow the project’s rules for suppressing unstable data and used the work to inform the map design, presentation, and explanatory language.
Limitations
This study had several limitations. First, this study was limited by the use of a convenience sample. Only patients who made a clinical visit to 1 of the health care systems, and from whom data on height and weight measurements were collected, could be assessed for obesity. Because we included in the database only persons who had a medical encounter at 1 of the participating health care institutions during the study period, population coverage rates varied across geographic areas. However, 26% to 41% of all persons in a given census tract were represented. In the surrounding counties, where representation was generally lower, less stable rates of obesity and overweight were observed. Efforts to expand coverage are underway to increase the sample size.
Second, because these data comprised only persons who sought care at 1 of 5 health care systems, selection biases may have been introduced into the data, making it difficult to generalize findings to the population. The health care systems that contributed data represent distinct critical segments of the population. For example, Denver Health serves low-income populations, and Kaiser Permanente serves patients who are insured through their employers. Future research should assess the extent to which selection bias affects these estimates and what measures can be taken to improve the representativeness of the surveillance system.
Third, data on height and weight measurements collected at clinics may use different protocols when making those measurements, such as whether the patient takes off his or her shoes. Although this type of variation is not likely to be significant, objective clinical observations are likely more accurate than other self-reported surveillance data, as obtained on the BRFSS.
Fourth, although each health care system minimized duplication of patient data in each database, multiple representations of an individual in the monitoring system were possible. A person who presented for care at multiple participating health care sites during the observation period would have been counted more than once in the data. Some populations may use health care more frequently than other populations. Older adults, for example, are more likely to frequently visit clinics than younger adults, increasing their representative share of the aggregated BMI values. The project has now begun partnering with a local health information exchange to identify and resolve duplicate records so that patients are counted only once. When studying in 1-year intervals, the likelihood of duplication is more limited because care is typically provided in fewer sites in 1 year than in multiple years. Selection bias may be present (although unlikely to be significant) with a greater likelihood of patients with chronic conditions (obesity, diabetes) who are likely to seek care and may therefore be overrepresented compared with the general population.
Practice Implications
Although the Colorado BMI Monitoring System has potential as a research and public health tool, 2 challenges need to be addressed: (1) de-duplication across sites to ensure an individual is represented only once in the population across the region and (2) defining methods to adjust or weight populations for more accurate estimates. 47,48 Even with a chance for selection bias, the sheer volume of observations was an asset, and expansion to include additional health delivery systems will improve the coverage. Future monitoring systems should determine ways to include other data related to obesity (eg, health outcomes, social, and built-environment assets). An important future step for maximizing the impact of obesity surveillance will be the development of efficient systems to disseminate findings to policy makers, community-based organizations, public health agencies, and others. This EHR-based public health surveillance method should be considered or applied to new use cases where researchers and public health practitioners need tools to monitor key population health challenges. This system can serve to evaluate public health programs, identify geographic areas for future work, and facilitate additional study to explore links between obesity and environmental assets.
Footnotes
Acknowledgments
The findings and conclusions in this article are those of the authors and do not necessarily represent the official position of the Colorado Health Foundation, Kaiser Community Benefit, or the Colorado Department of Public Health and Environment.
Declaration of Conflicting Interests
The authors declared no potential conflicts of interest with respect to the research, authorship, and/or publication of this article.