
Abstract
It is long perceived that the more data collection, the more knowledge emerges about the real disease progression. During emergencies like the H1N1 and the severe acute respiratory syndrome coronavirus 2 pandemics, public health surveillance requested increased testing to address the exacerbated demand. However, it is currently unknown how accurately surveillance portrays disease progression through incidence and confirmed case trends. State surveillance, unlike commercial testing, can process specimens based on the upcoming demand (e.g., with testing restrictions). Hence, proper assessment of accuracy may lead to improvements for a robust infrastructure. Using the H1N1 pandemic experience, we developed a simulation that models the true unobserved influenza incidence trend in the State of Michigan, as well as trends observed at different data collection points of the surveillance system. We calculated the growth rate, or speed at which each trend increases during the pandemic growth phase, and we performed statistical experiments to assess the biases (or differences) between growth rates of unobserved and observed trends. We highlight the following results: 1) emergency-driven high-risk perception increases reporting, which leads to reduction of biases in the growth rates; 2) the best predicted growth rates are those estimated from the trend of specimens submitted to the surveillance point that receives reports from a variety of health care providers; and 3) under several criteria to queue specimens for viral subtyping with limited capacity, the best-performing criterion was to queue first-come, first-serve restricted to specimens with higher hospitalization risk. Under this criterion, the lab released capacity to subtype specimens for each day in the trend, which reduced the growth rate bias the most compared to other queuing criteria. Future research should investigate additional restrictions to the queue.
Keywords
Respiratory viruses often create emerging outbreaks when unexpected events challenge the immune system of the susceptible population, increase influenza-like illness (ILI) incidence, alter health care–seeking behaviors, and challenge the public health infrastructure created for disease surveillance.
1
In the United States, emerging outbreaks have been either pandemic, such as the 2009 H1N1 and the 2019 severe acute respiratory syndrome coronavirus 2 (SARS-CoV-2), or seasonal, such as the 2017–2018 A(H3N2). While both pandemic outbreaks resulted from animal-to-human transfer followed by sustained human-to-human transmission, the 2017–2018 A(H3N2) emergency was likely the result of a flu vaccine with less than
Although digital surveillance systems have proven beneficial for early warnings of emerging outbreaks (e.g., Pro MED—mail, health maps, and the Global Public Health Intelligence Network), 3 epidemiological characterization of influenza viruses still occurs from official data collection sources such as hospital and emergency department (ED) reports, laboratory testing data, and data from local and state health departments.
As per surveillance standards from the World Health Organization, influenza data collection occurs passively when symptomatic individuals report their symptoms to the health care system.4,5 In Michigan, for example, EDs are connected to the Michigan Syndromic Surveillance System (MSSS). Registrations of individuals presenting at EDs, including their chief complaint, are automatically and electronically sent into the MSSS, which is monitored by the local and state public health departments. Primary and urgent care practitioners in Michigan can report their weekly ILI cases to the Centers for Disease Control and Prevention’s (CDC’s) ILI Sentinel Network, but enrollment in the network is optional, and the system does not have the capability for real-time updating of the overall case trend. Aggregate weekly totals and individual case reports from EDs, primary care providers, and urgent care providers, as well as any other type of individual submission (e.g., from schools or flu-testing labs), are captured by the Michigan Disease Surveillance System (MDSS), which is the virtual data-sharing platform across the state and local health departments.
When the influenza pandemic occurred in 2009, it is likely that individuals who sought health care were influenced by the media coverage about the disease. Consider the trend of cases with constitutional and respiratory symptoms that were reported through the MSSS during the nascent phase of the outbreak (Figure 1). Although the respiratory trend does not show a clear pattern, the constitutional trend shows that chief complaints increased after April 21, which is the day when the CDC reported the first human cases of the 2009 H1N1 flu. One might suspect that the increasing trend was influenced by the health care–seeking behavior of individuals who attributed their symptoms to the newly described 2009 H1N1 virus.
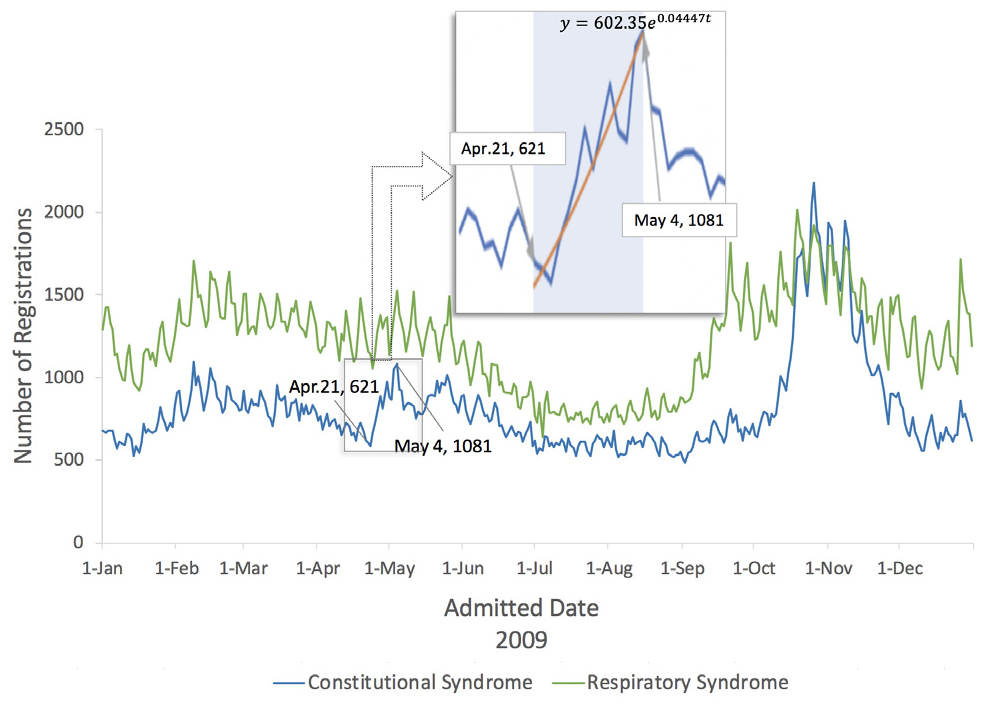
Number of daily emergency department registrations from constitutional symptoms (i.e., fever, headache, malaise, fatigue, and diarrhea) and respiratory symptoms (i.e., shortness of breath or difficulty breathing, cough, sore throat, and runny nose).
Once ILI cases seek health care during routine surveillance, local health departments and sentinel providers send respiratory specimens from a subset of the cases to the state public health laboratory (PHL) or commercial laboratories for further specimen testing and characterization. Local health departments control the submission of specimens to the PHL by following recommended criteria from the Michigan Department of Health and Human Services (MDHHS). In addition, local health departments can receive test results from commercial labs. In April 2009, during the nascent phase of the pandemic, the PHL tested most of the influenza specimens while the MDHHS validated the testing protocols for other laboratories. Also during this phase, the MDHHS recommended that not only sentinels but any health care provider could send specimens to the PHL. This operational landscape, together with the lab-testing capacity and the manual methods for receiving and processing the specimens, created congestion and delays of up to 2 weeks.6–8 Once the PHL became congested, the MDHHS restricted the specimen submission to prioritize specific populations with severe ILI presentations (e.g., hospitalized patients and pregnant women). This reactive response could have created biases (or differences) between the incidence trends observed through surveillance and the real unobserved trends.
Significant biases may produce underreaction or overreaction in mitigation efforts. As an example, consider the 2009 and the 1918 influenza pandemic outbreaks. The 2009 pandemic had a median growth rate of 0.125 while the 1918 pandemic had a median growth rate of 0.201 (both rates were calculated from data in Biggerstaff et al. 9 ). If the true unobserved outbreak is like the 2009 outbreak but the data show a 1918 pandemic-like outbreak, the bias of –0.076 may lead authorities to implement aggressive travel-related control policies, and overreaction may occur. Conversely, if the true unobserved outbreak is like the 1918 outbreak but data show a 2009 pandemic-like outbreak, the bias of 0.076 would trigger underreaction.
In this article, we present a simulation-based evaluation of surveillance operations for reporting, collection, and testing of specimens during the nascent phase of an emerging influenza outbreak in the State of Michigan. We seek to accomplish 2 objectives: the first is to identify factors that contribute to differences between real and observed incidence trends. Table 1 describes the complete pool of factors to explore, which include “pandemic risk perception,”“primary care access,” and “sampling criteria” to prioritize specimens in the PHL. The second objective is to quantify how well the observed trends represent the behavior of the true incidence trend. To our knowledge, these 2 objectives have not been investigated in previous simulation models for surveillance research. Simulation models have been used to explore policies for spatial allocation of data providers10,11 and to test the performance of process monitoring algorithms for detecting outbreaks of influenza 12 or other diseases.13–15
Experimental Factors Considered in the 3 Stages a
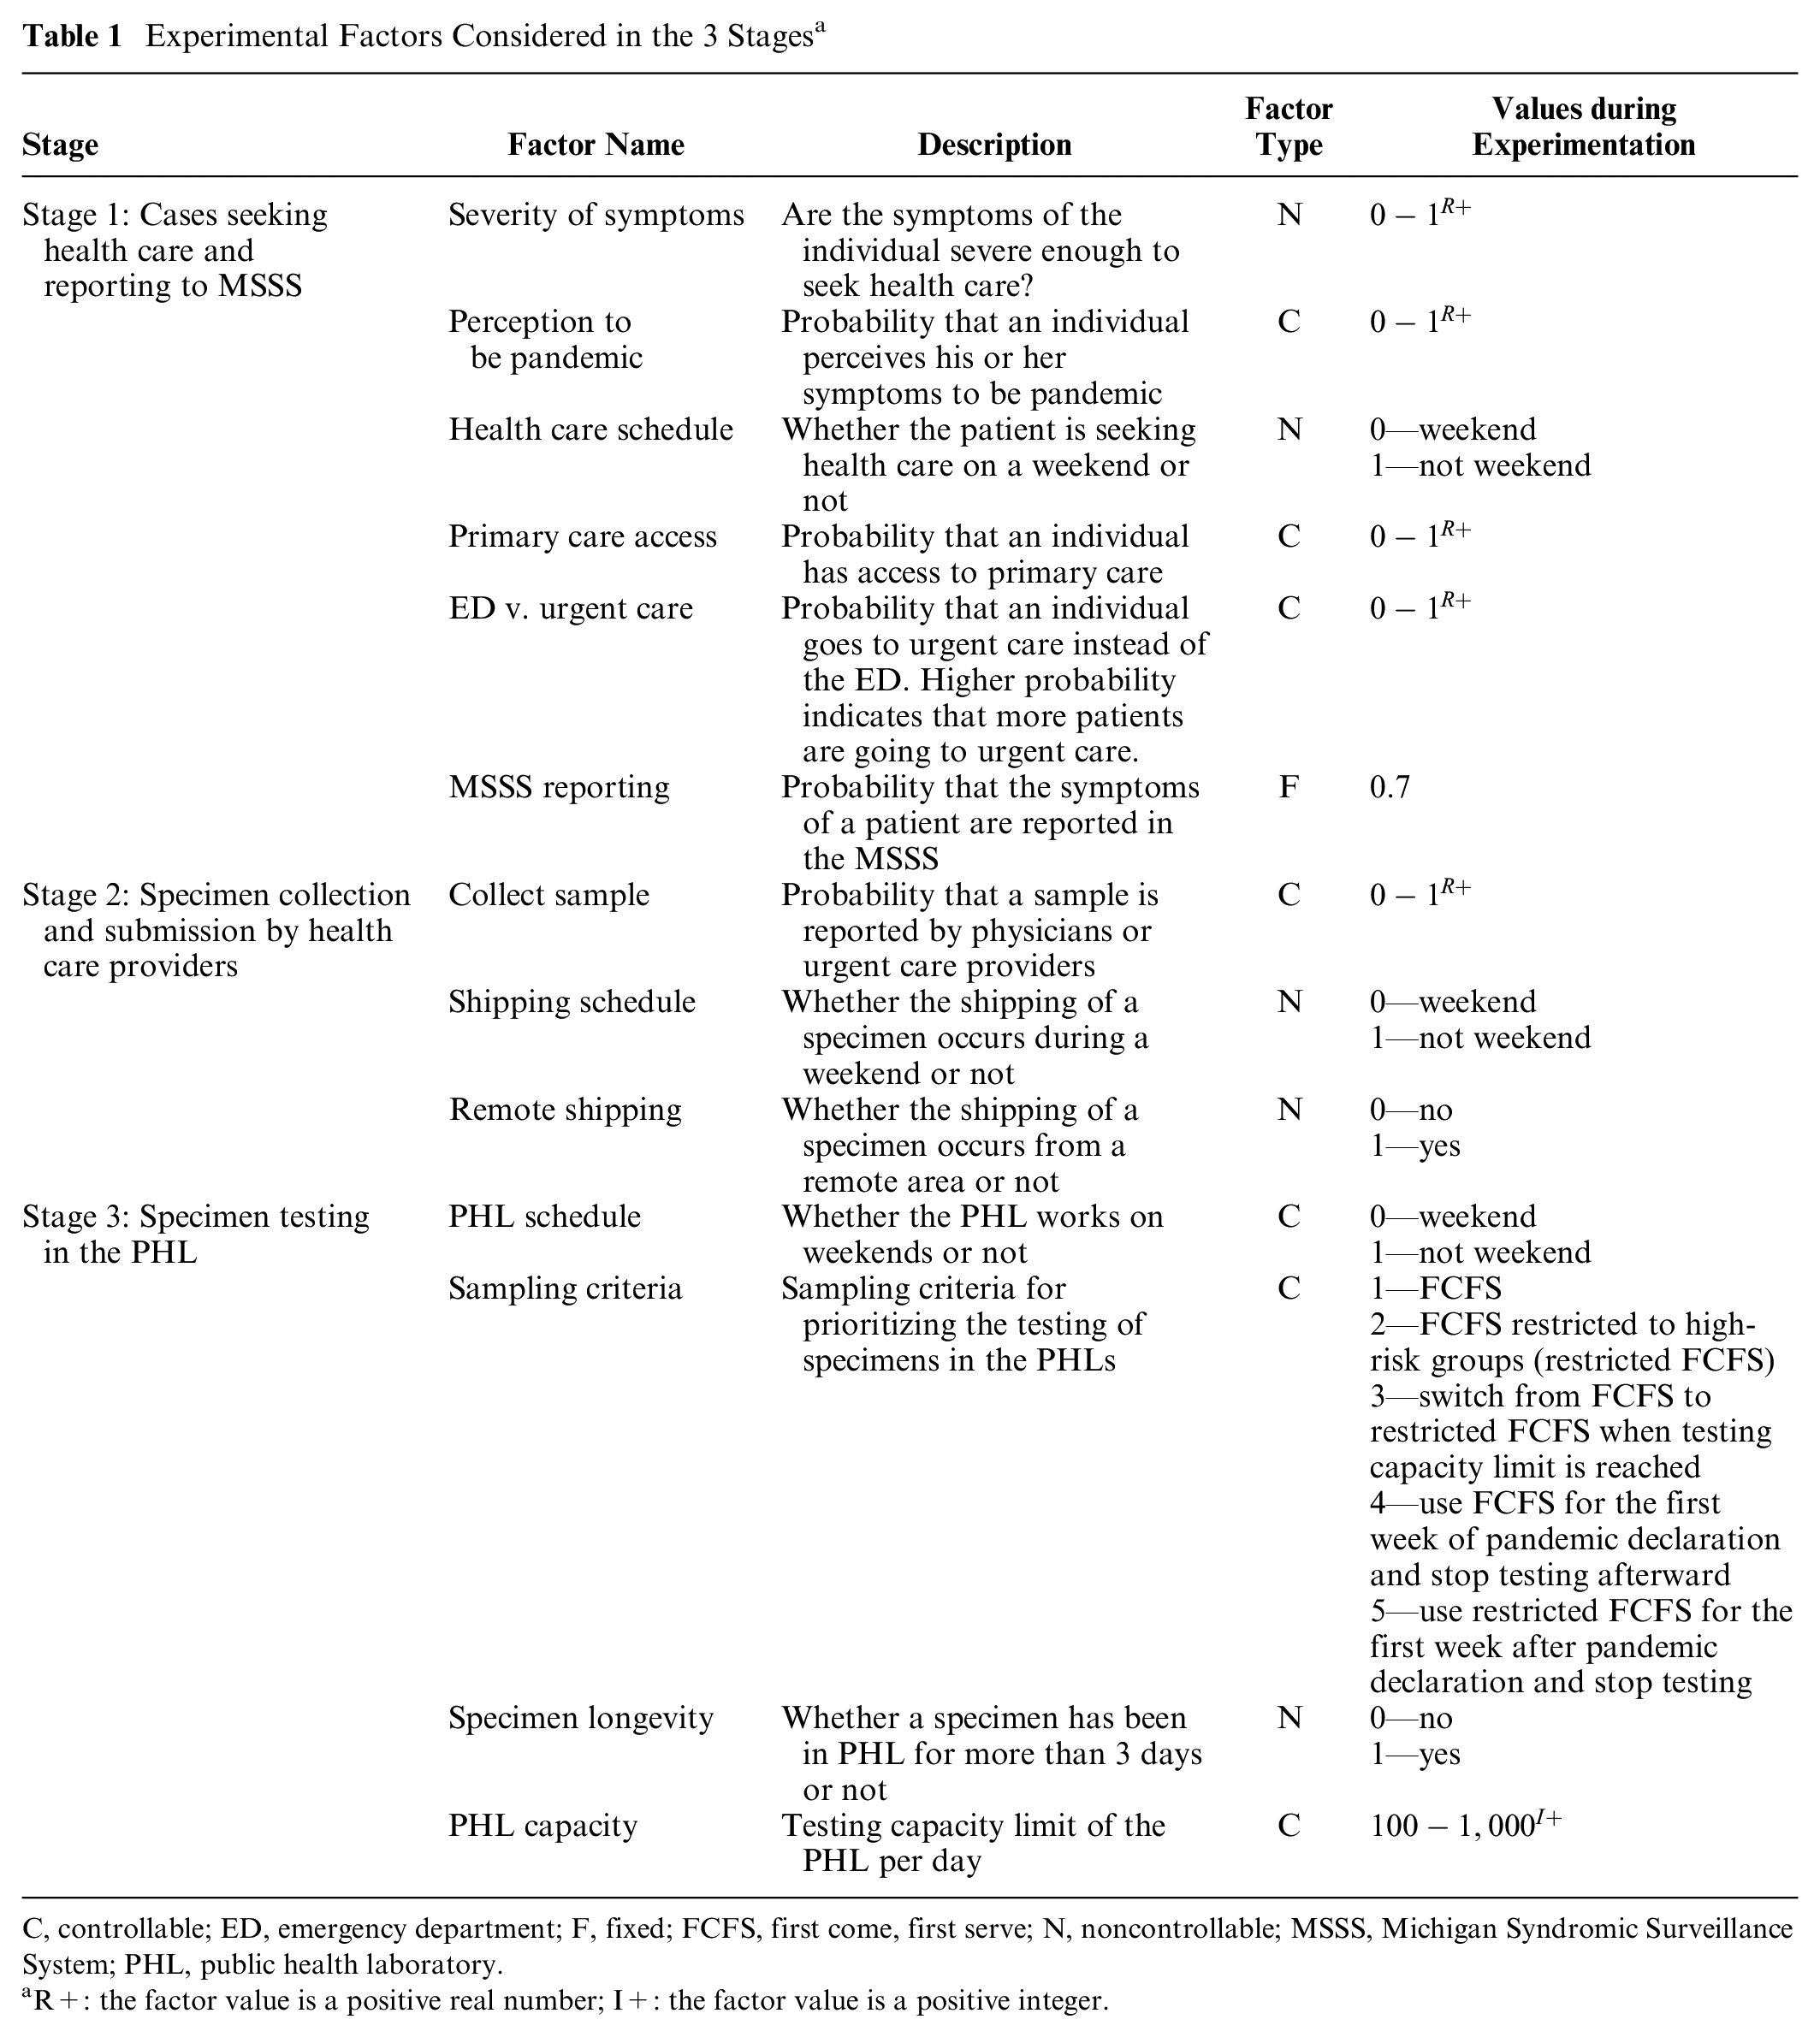
C, controllable; ED, emergency department; F, fixed; FCFS, first come, first serve; N, noncontrollable; MSSS, Michigan Syndromic Surveillance System; PHL, public health laboratory.
R+: the factor value is a positive real number; I+: the factor value is a positive integer.
Our simulation model is built as a realistic representation of cocirculating influenza viruses across multiple regions in the State of Michigan, in the presence of mitigation, containment, and surveillance policies. Epidemiological and surveillance processes are grounded on real data, public health documentation, and field experts in public health operations who were in service during the 2009 influenza pandemic.
Methods
Model
We developed a simulation that models the true unobserved influenza incidence trend in the State of Michigan, as well as trends observed at different data collection points of the surveillance system. Figure 2 presents the different stages at which the trends are generated.
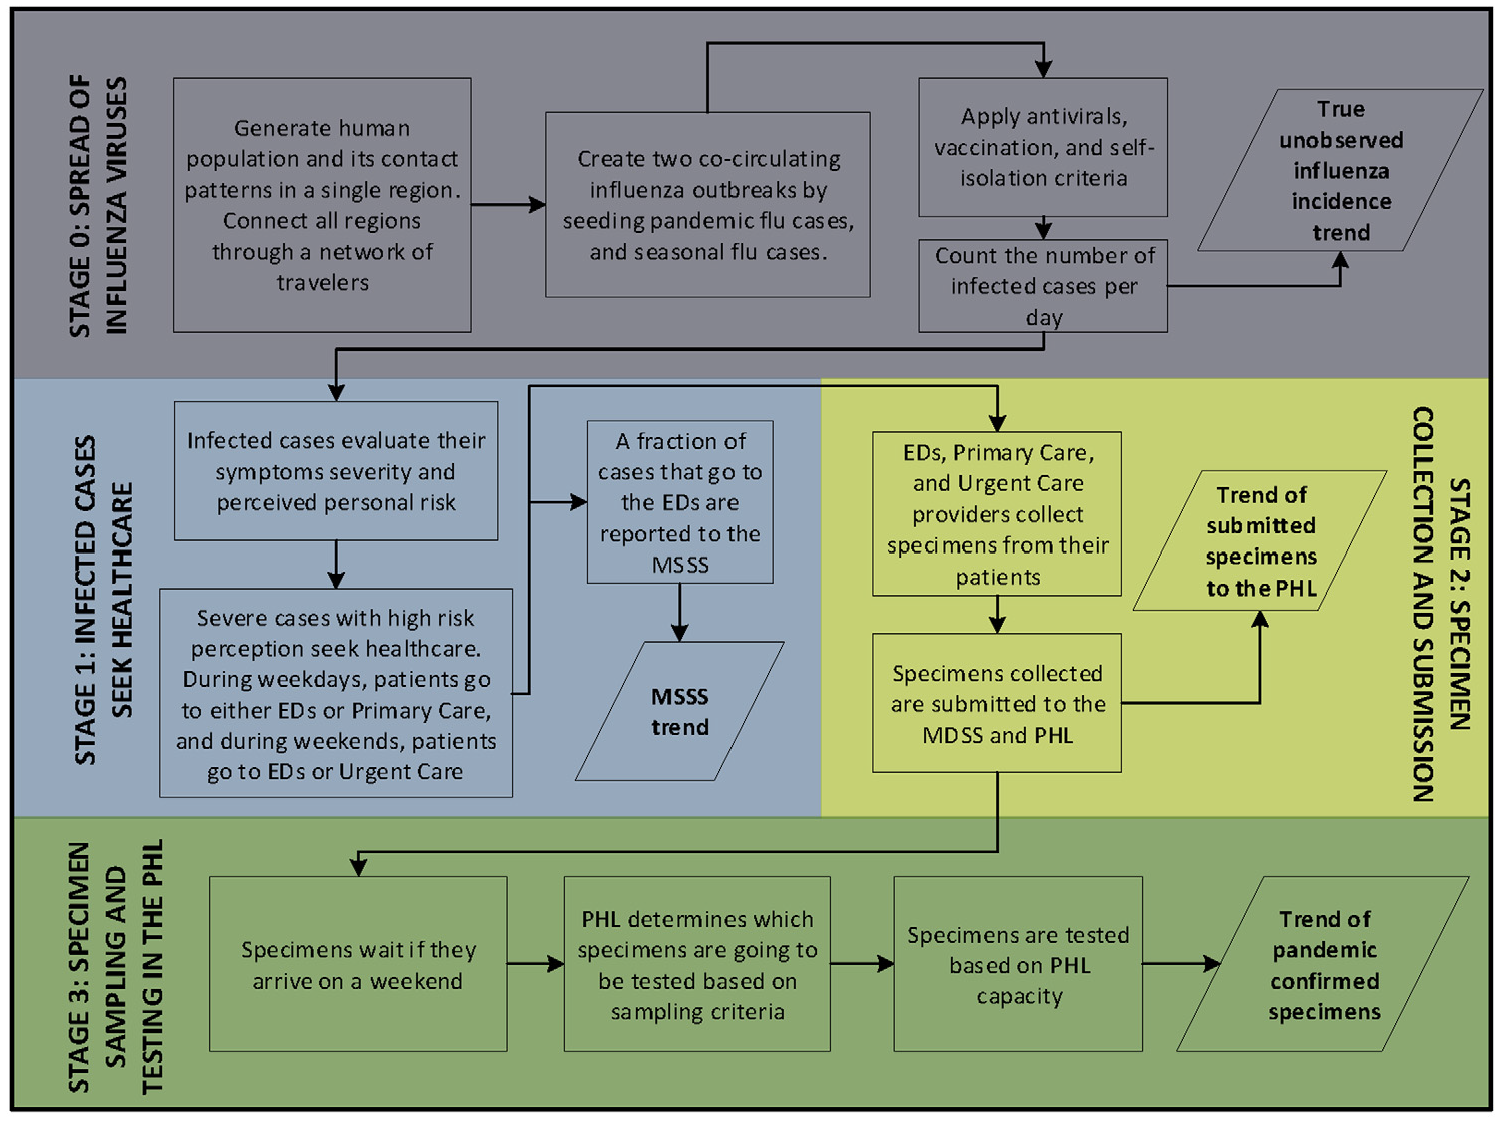
Simulation of influenza incidence trends. Stage 0 generates the trend of infected cases per day, which is not observed by the surveillance system. Stages 1, 2, and 3 generate incidence trends at different surveillance points. MSSS, Michigan Syndromic Surveillance System; PHL, public health laboratory.
Stage 0 generates the true unobserved influenza incidence trend (Figure 2). In this stage, 2 cocirculating influenza viruses spread through a network of regions simulating human contact patterns in the State of Michigan (~10,000,000 inhabitants). The Michigan network connects its 4 characteristics regions: Upper Peninsula, Northern Lower Peninsula, Southeast Michigan Council of Governments, and Southern Lower Peninsula.
Real data were used to build the geographic and demographic features, as well as the contact and travel patterns within and between the regions and across the Michigan boundaries. Data sets were sourced from the US Census Bureau,16–18 National Household Travel Survey, 19 Michigan School Data webpage, 20 National Center for Education Statistics, 21 National Institute for Early Education Research, 22 Michigan Department of Transportation,23–25 and survey data 26 (see Supplementary [SI]: 1.1–1.3).
The 2 cocirculating viruses were seeded to re-create an emerging virus that interacts with a seasonal strain already infecting the population. The emerging and seasonal viruses were simulated using the epidemiological features of the pandemic and seasonal H1N1 strains, respectively. 27 Cocirculation enables the further sampling and testing of influenza viruses in the surveillance system. The viruses are seeded in the Southern Lower Peninsula and spread through contacts made by infected individuals while traveling within and between regions. Infected individuals are also allowed to enter and leave Michigan by traveling across the state boundaries.
Antiviral and seasonal vaccination have been modeled as factors that reduce the probability of infecting a susceptible individual, using existing estimates of influenza antiviral and vaccine efficacy (see SI: 1.4). Some sick individuals withdraw from their usual schedules and reduce the population of infectious individuals in the community. A fraction of these individuals will be hospitalized based on age-based hospitalization rates in Michigan (see SI: 1.4).
The previous contact and mitigation structure generates the daily trend of original infected cases with realistic variability and provides a robust simulation testbed for a wide variety of scenarios.
In addition to stage 0, 3 more stages were simulated to represent the surveillance system as shown in Figure 2 (see SI: 1.5). In stage 1, symptomatic individuals seek health care, based on a set of disease and behavioral factors that have been previously established in the literature as influencing health care–seeking behavior and introducing delay in the disease reporting (Table 1, stage 1). Stage 1 generates the trend of daily constitutional cases that are reported to the MSSS (MSSS trend). In stage 2, health care providers collect and/or submit influenza specimens to the PHLs, based on a set of screening factors (Table 1, stage 2), which generates the trend of specimens that are submitted to the PHLs. In stage 3, cases are tested based on a set of operational factors, including PHL schedule, sampling criteria, and PHL capacity. Factor experimental values were selected based on observed operational conditions during the 2009 pandemic influenza (Table 1, stage 3). Stage 3 generates the trend of pandemic confirmed specimens by date of submission to the PHL. Figure 3 shows 2 scenarios that present the simulated surveillance trends for the growth phase of an influenza outbreak.
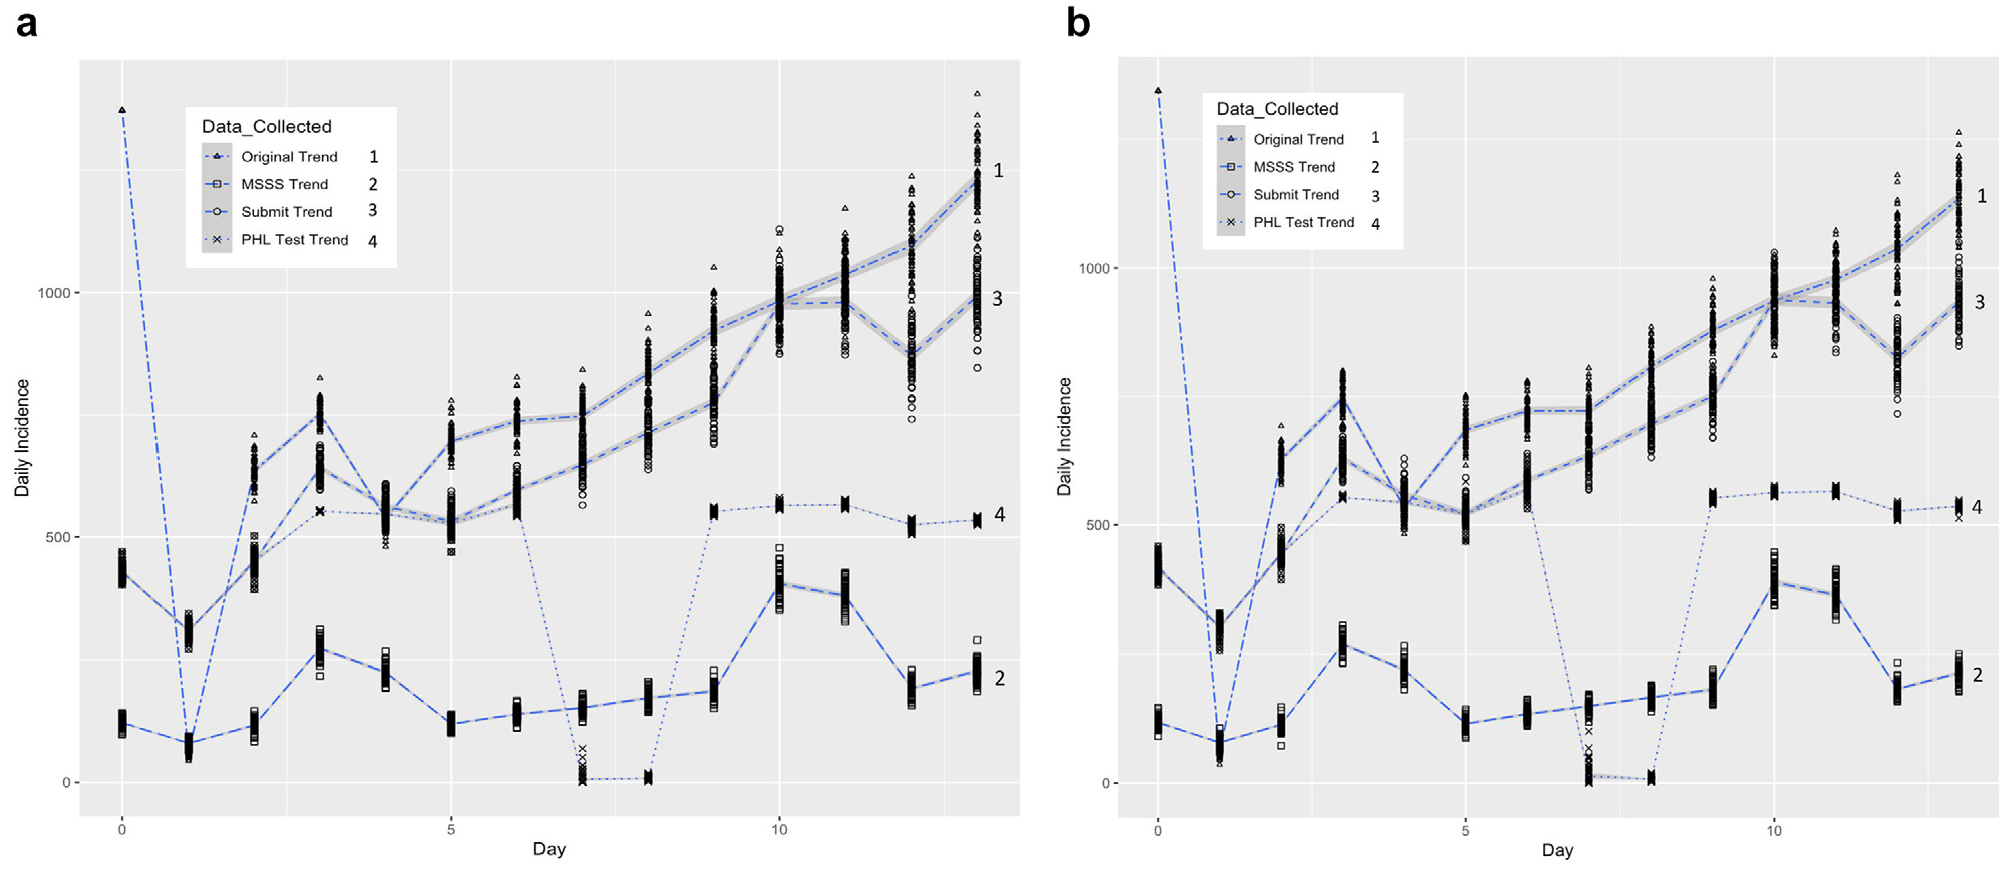
(a) Scenario 1: simulated data collection trends from 60 replicates using expected reproduction numbers of 2.0965 and 1.6 for the pandemic and seasonal outbreaks, respectively; 686 initial infected cases for the pandemic outbreak and 686 initial infected cases for the seasonal outbreak; and a value of 1 (high) disease severity and a
Experiments
Two experiments were conducted for calibration, validation, sensitivity, and scenario analysis. The first experiment sampled from stage 0 of the model, with the objective to calibrate the model using the simulated ILI growth rate
To fit
Calibration Parameters
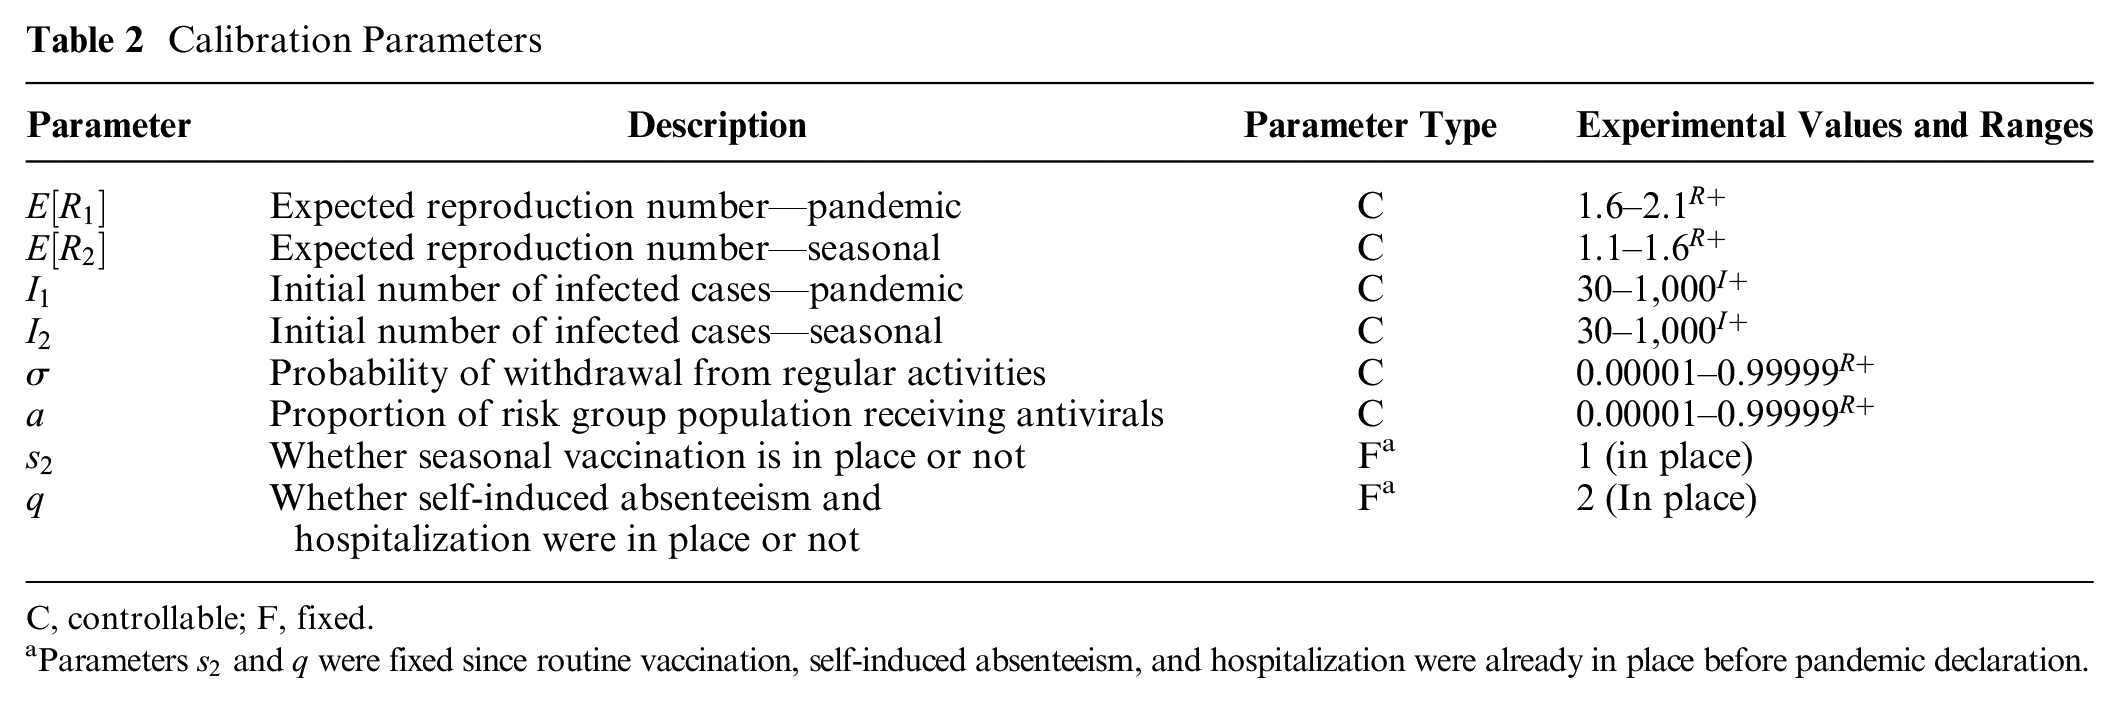
C, controllable; F, fixed.
Parameters
Table 3 shows the 2 scenarios obtained. Face validation was conducted by discussing the scenarios with the public health operations experts on our team. It was concluded that both hypothetical scenarios portray plausible initial conditions of the pandemic outbreak in Michigan, assuming the overall case incidence grows similarly to the MSSS trend of constitutional cases: high pandemic reproduction number, moderate seasonal reproduction number, high withdrawal percentage, and low antiviral usage coverage. In addition, the initial pool of infected cases was estimated to be high (686 in both scenarios), which suggests that influenza spread initiated before the pandemic was declared.
Optimal Calibrated Scenarios
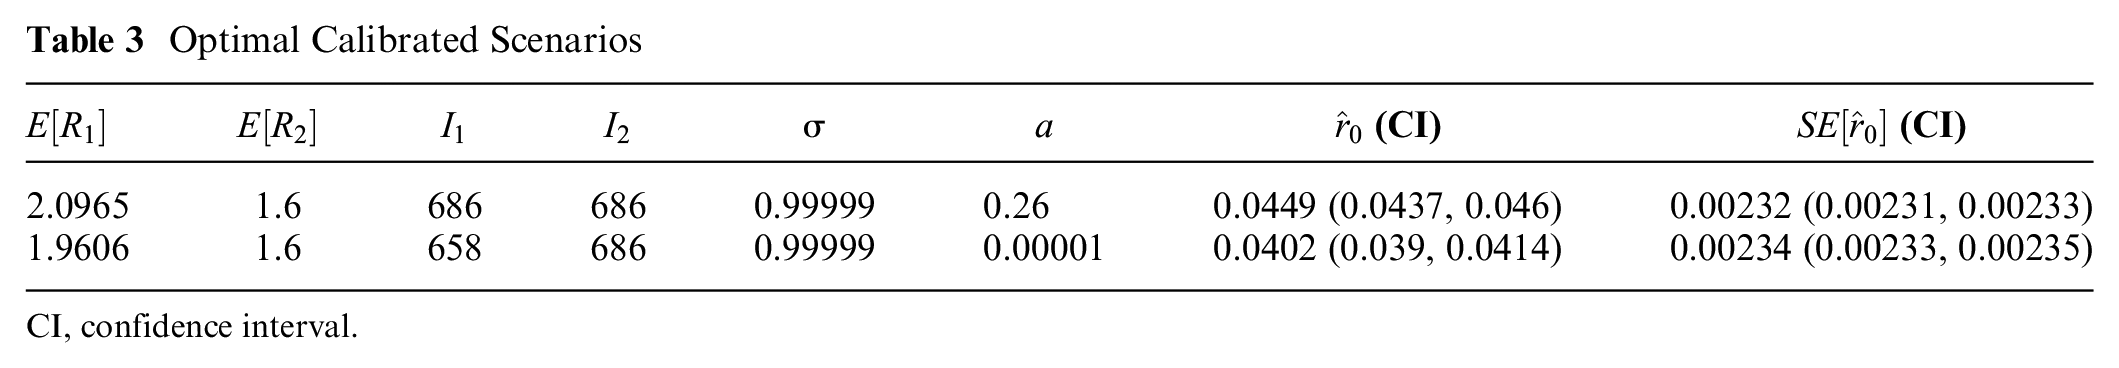
CI, confidence interval.
The second experiment sampled from all the stages in the simulation model, with the objective to provide sensitivity analysis and external validation. In addition, the experiment sought to provide understanding of the explanatory power of the incidence trends at different stages of the surveillance system. A set of scenarios was sampled to create second-order polynomial equations, where the responses were the biases between the growth rates of the trends generated by the surveillance system. The biases can be defined as follows:


where
For external validity, we compared real and simulated growth rates of pandemic cases confirmed by PHL testing. MDHHS 2009 data on pandemic confirmed cases were used to estimate a real growth rate from April 19, 2009, to May 30, 2009 (week 16 to week 21).28,29 To determine whether this real growth rate could be produced by the simulation, experimental runs that used first come, first serve (FCFS) as the sampling criteria were selected for the analysis. This selection considered that the real sampling in the PHLs was conducted mostly using FCFS. From the growth rates of the selected runs, a confidence interval was calculated and compared against the real growth rate of pandemic cases. Since the confidence interval includes the real growth rate from confirmed cases, we confirm the validity of our model to replicate this real scenario.
The second experiment generated 3,200 replicates, consisting of 320 combinations with 10 replicates. For each of the 320 combinations, we estimated and compared the fraction of the variability explained by the predictors in each of the following relationships:


where
Results
Figure 4 shows the results for
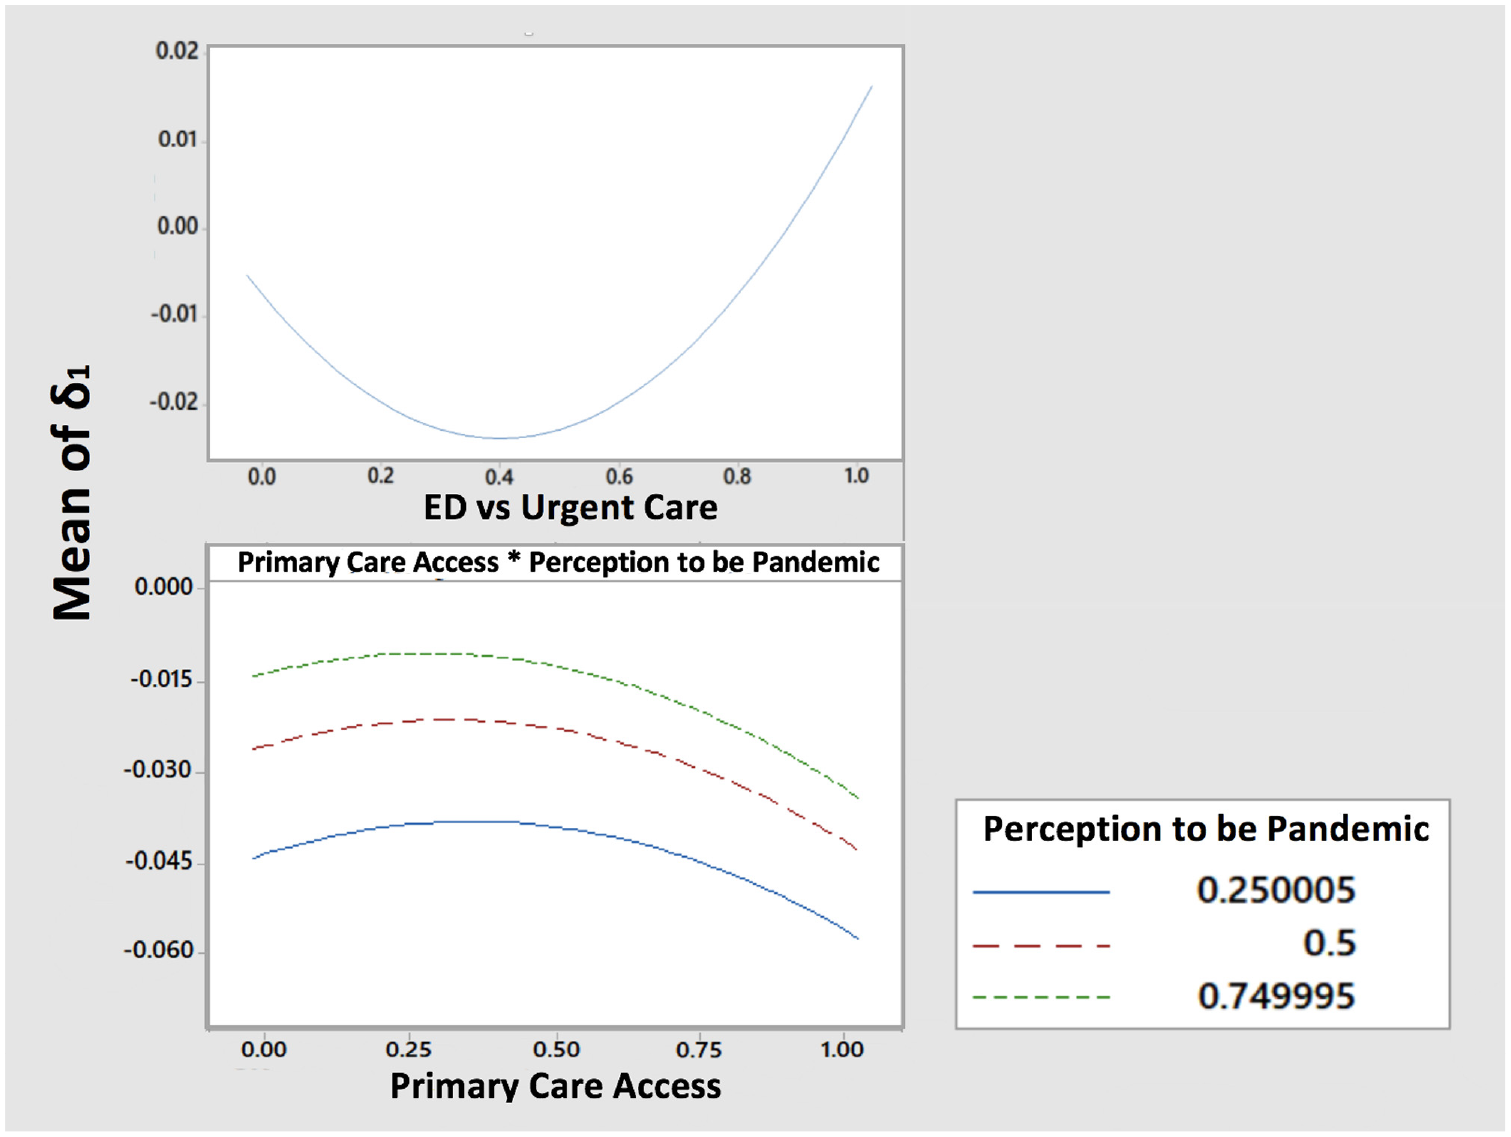
Effect plot of factors affecting bias between original and Michigan Syndromic Surveillance System trend. ED, emergency department.
Figure 5 shows the results for
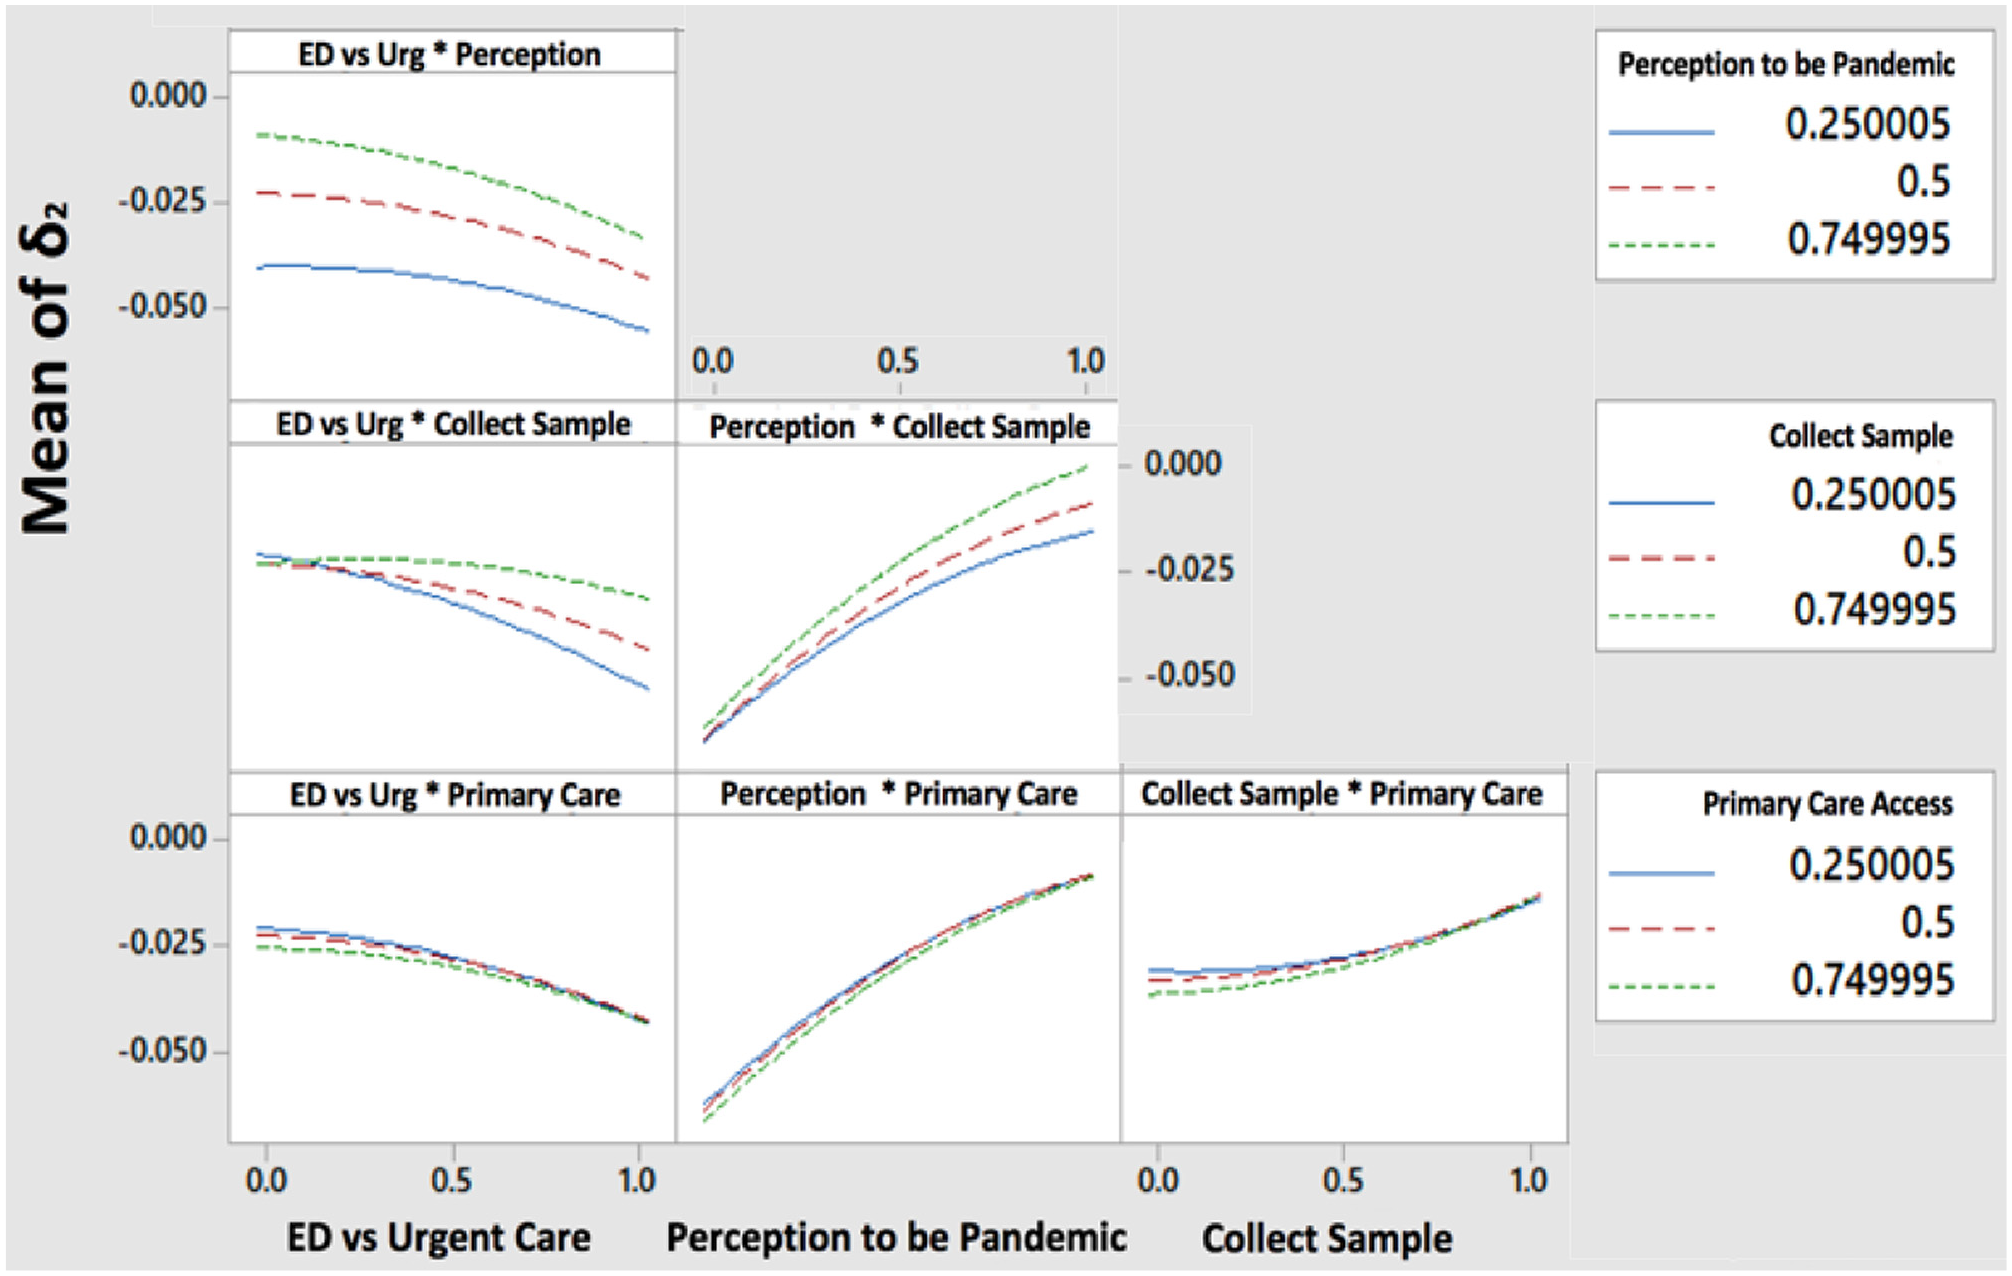
Effect plot of factors affecting bias between original and submit trend. ED, emergency department.
Figure 6 shows the results for
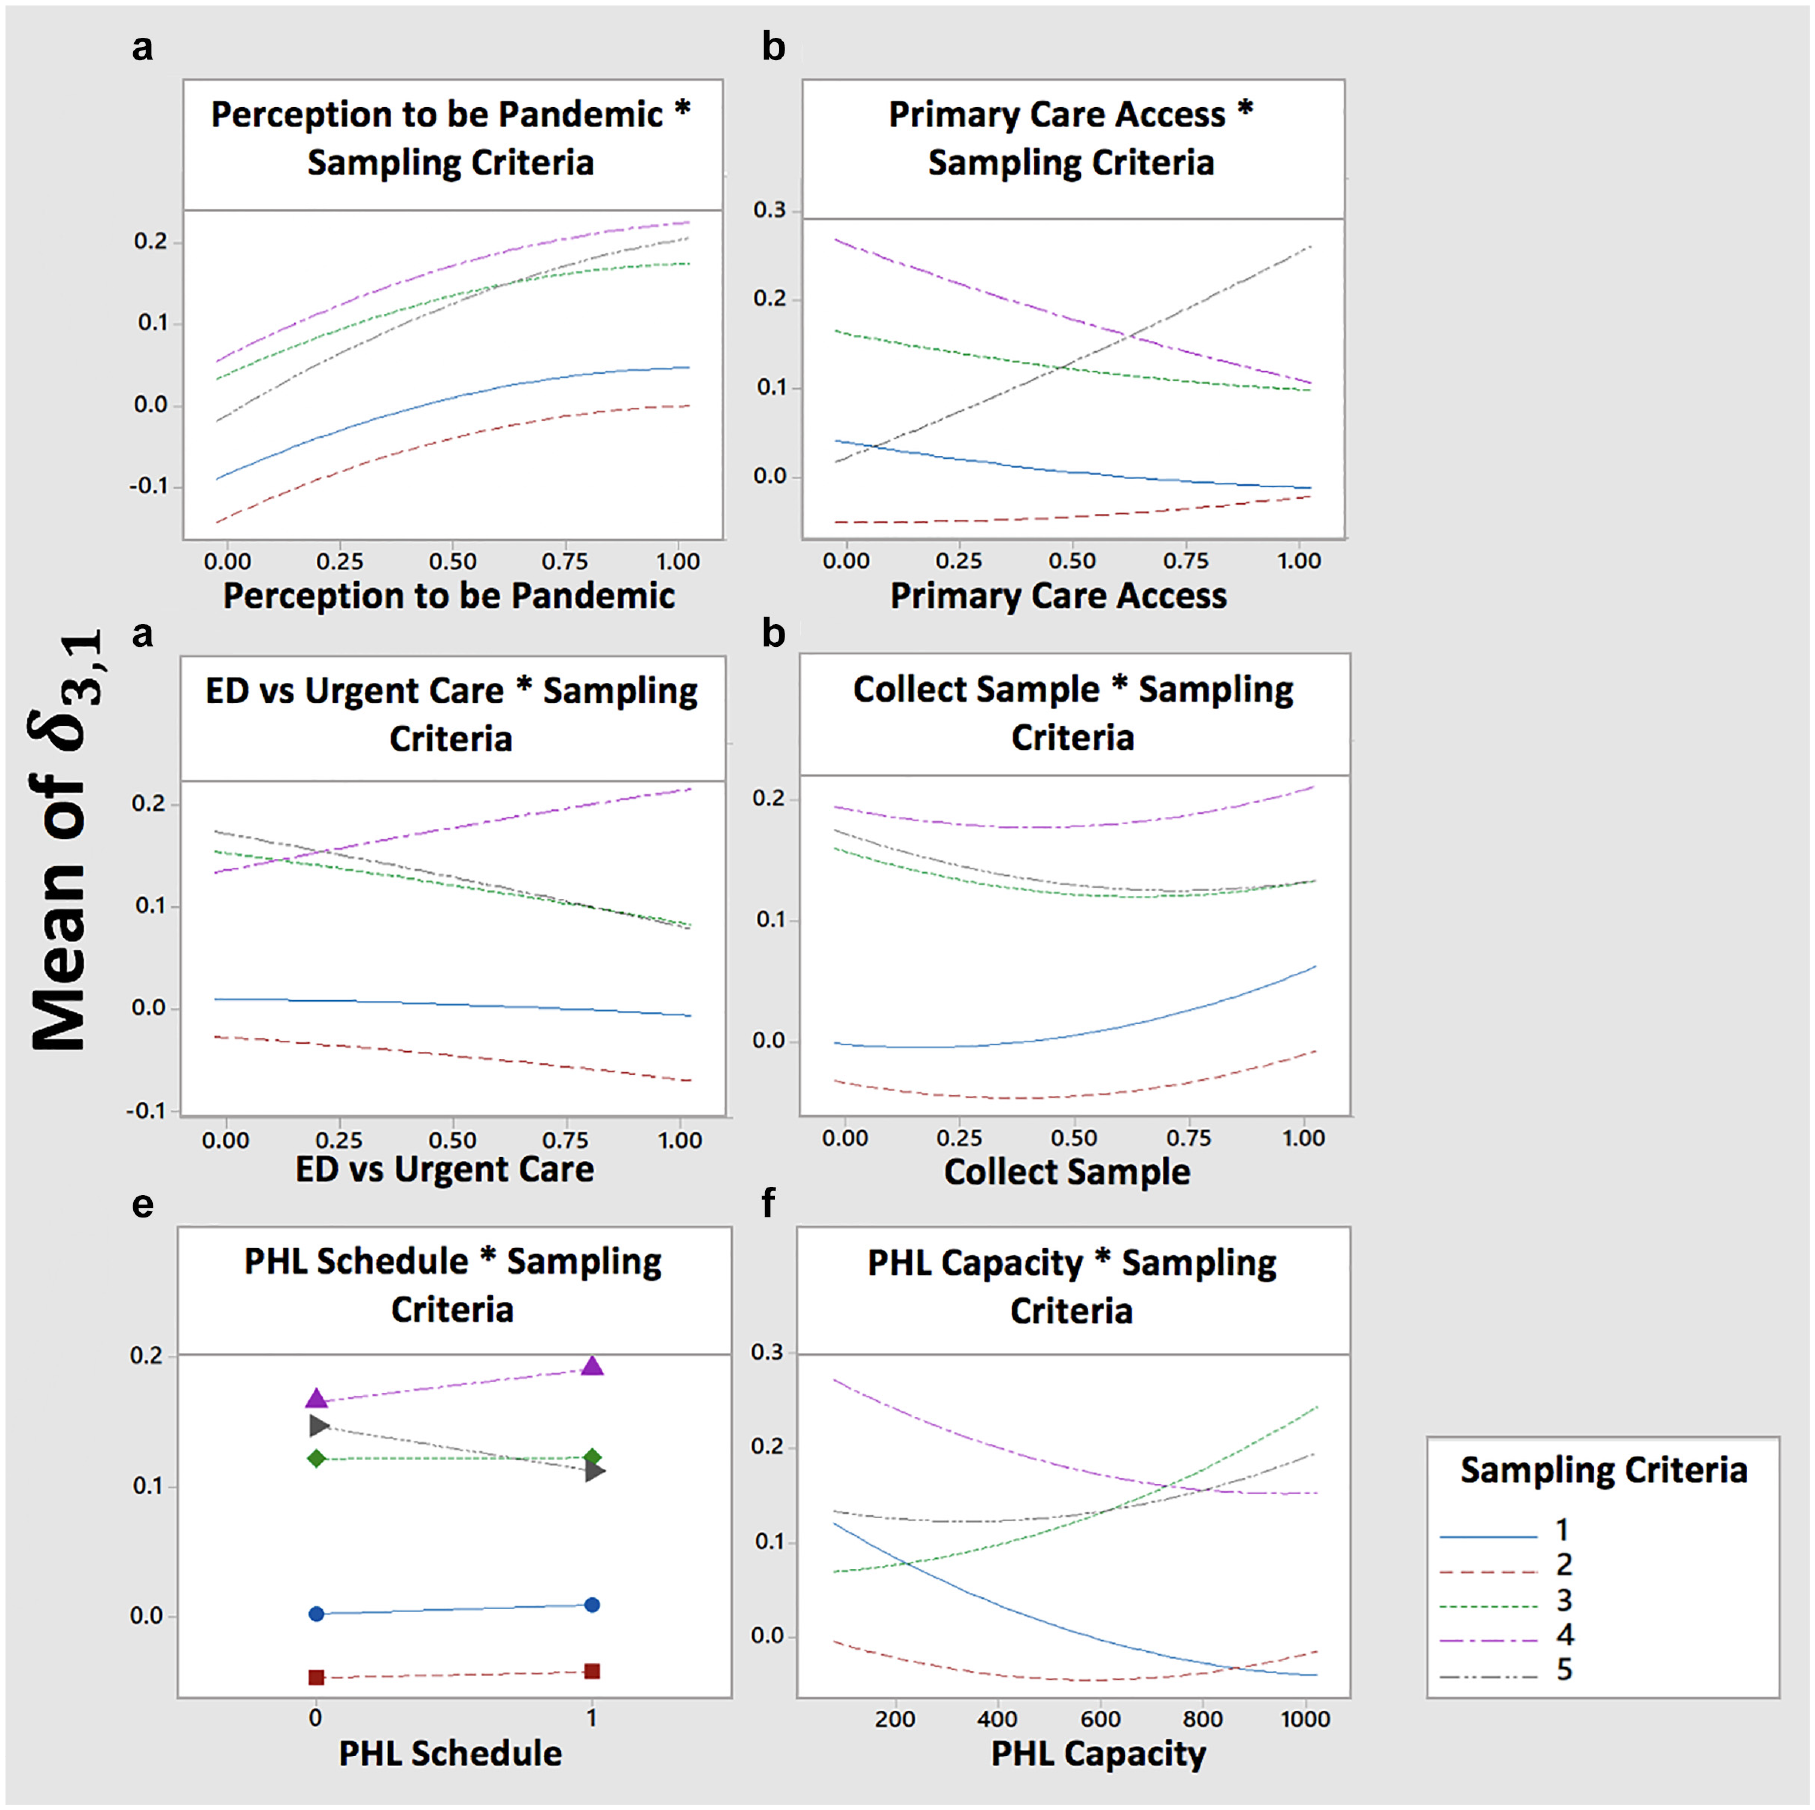
Effect plot of factors affecting bias between original and public health laboratory (PHL) tested trend. ED, emergency department.
Explanatory Power of the Trends
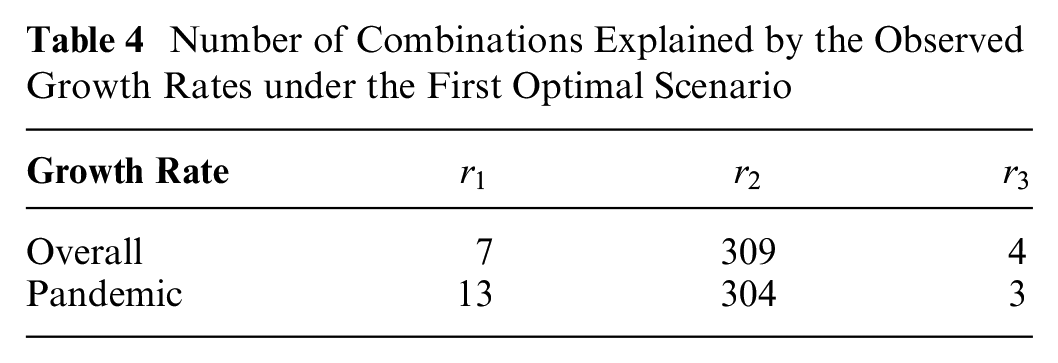
Table 4 and Figure 7 show that
Number of Combinations Explained by the Observed Growth Rates under the First Optimal Scenario
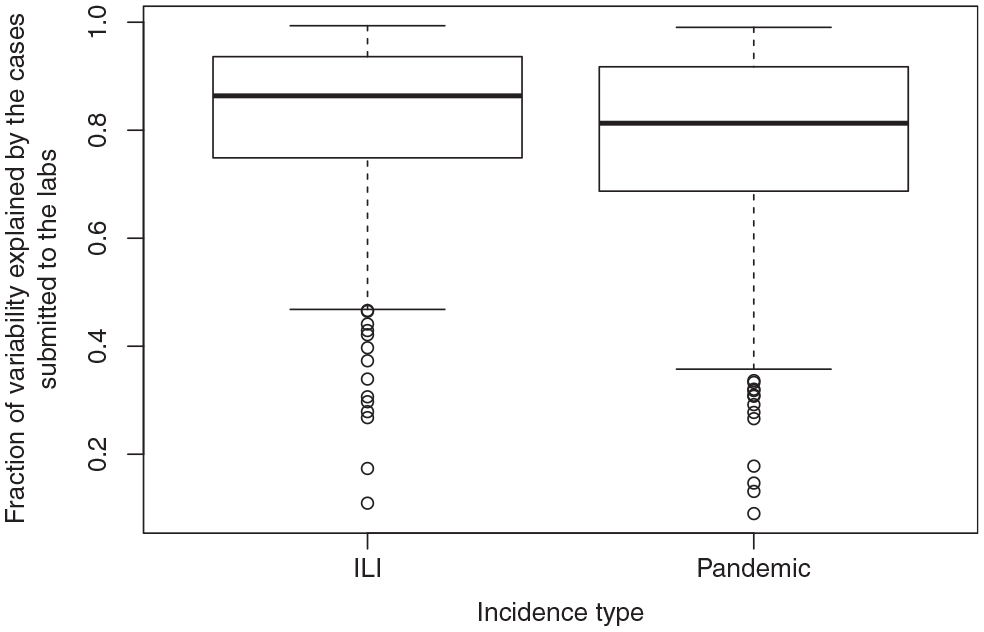
Boxplots of the variability in the overall ILI and pandemic growth rates that is explained by the growth rates of cases submitted to the lab.
Discussion
Most of the surveillance system can be seen as a set of connected pipelines through which cases are constantly routed. The parameters “perception to be pandemic,”“primary care access,”“ED v. urgent care,” and “collect sample” act as valves that divert or route the flow of specimens to the data collection points. In general, opening a valve that leads to a data collection point contributes to cases that reduce the bias, and closing a valve has the opposite effect.
“Perception to be pandemic” is one of the first valves of our simulated surveillance system and can route or divert a high volume of cases. Hence, it has a highly significant impact on all the biases under study. Our results suggest that high risk perception due to the pandemic increases the reporting, which leads to the reduction of biases in the growth rates. As the public interest decreases, so will the reporting pattern. 30 Therefore, an emerging outbreak should be seen as an opportunity to support the collection of larger sample sizes, and public communication should provide a realistic sense of the risk posed by the influenza virus.
“ED v. urgent care” is a key valve in routing or diverting cases reporting over the weekend, and hence it is important to encourage urgent care and EDs to report their weekend cases. This practice will likely produce more representative samples in the incidence trends for each of the weekend days reported. The PHL should also consider that misrepresentation may occur for days with small sample sizes.
Once the specimens arrive at the PHL, the bias from the true unobserved pandemic curve is affected by 2 factors: “sampling criteria” and “PHL capacity.” Based on the sampling decisions made in Michigan during the H1N1 pandemic, we designed and tested 5 types of “sampling criteria.” Two of these criteria implied that the tested sampling method was maintained over the course of the growth phase, while 3 of these criteria implied a switch in the sampling method. Our results show that switching from one sampling criterion to another contributes to higher biases than maintaining the same sampling criteria. When the transition happens from FCFS or FCFS restricted to no sampling, the growth rate is estimated only with 1 week of data, which increases the bias. When the transition happens from FCFS to FCFS restricted, the pool of samples is reduced, and therefore the samples that tested positive out of this pool do not represent incidence at the same scale as the FCFS samples. Estimation methods should ensure that proper adjustment strategies are used to account for abrupt changes in the pool of samples.
Under constrained capacity, FCFS restricted outperformed the other 4 sampling criteria when the objective was to minimize the growth rate bias for the overall incidence trend of pandemic cases. The restriction allowed that the PHL tested cases for each day that would have otherwise expired if they had continued waiting in the queue. Hence, the restriction releases capacity to collect samples for each day in the trend, which reduces the growth rate bias. Future research should aim at investigating additional restriction strategies that further minimize the bias.
Although our results were obtained using the H1N1 pandemic scenario, we believe that our insights can be considered during other emergent outbreaks of respiratory viruses. During the H1N1 pandemic, commercial labs were still working on the approval of their testing protocols and not reporting during the first 2 weeks after pandemic declaration. During the 2019 SARS-CoV-2, it took more than a week and a half after pandemic declaration to begin operationalizing government-funded free testing across the United States. These experiences illustrate that during the nascent phase of an outbreak emergency, the PHL is at the frontline of outbreak detection and follow-up. However, their testing capabilities are usually constrained. Our results suggest that, under conditions of high specimen reporting and submission, incidence growth is better characterized in real time if the PHL provides the results from a limited sample representing each day of the curve, rather than providing results from all the arriving specimens. In practice, the PHL labs are testing not only to characterize the epidemic curve but also to detect changes in the virus genetic makeup, as well as to identify positive cases guiding targeted mitigation (e.g., isolation of cases and quarantine of case contacts). Although the PHL capacity planning cannot be driven only by the epidemiological characterization, our results suggest that the PHL could report the results in 2 categories: 1) the results of a full set of specimens tested to comply with the different objectives and 2) out of the results from the full set, a fraction specifically selected for epidemiological characterization. In our research, the daily fraction was dictated by the specimens arriving at the PHL that met our age-based risk group definition. This definition worked well to represent the population since in our model, the disease was affecting the population homogeneously across age groups. In practice, the fraction to consider should be detached from categories representing heterogeneous incidence.
Our results also show that the growth rate of ILI cases submitted to the PHL has a good explanatory power for the growth rate of overall ILI cases. Similarly, the growth rate of pandemic cases submitted to the PHL has a good explanatory power for the growth rate of overall pandemic cases. This result seems to illustrate that the node connected to the most and the widest variety of health care providers in the surveillance network also collects the most representative data, leading to lower biases in the growth rates. In countries like England, public health authorities are in search of better predictors of ILI activity, to complement or replace the existing primary care consultation data. 30 Convergent data sources that receive reporting from different types of providers (i.e., urgent care, primary care, or hospital) might present as enhanced alternatives to primary care provider consultation for the estimation of ILI incidence. In Michigan, the MDHHS receives most of the requests for PHL testing before specimens are being sent, but some are submitted directly to the PHL during an emergency. The PHL sometimes declines specimens directly reported due to capacity constraints, and therefore, there are no results to submit to the MDSS. Hence, the MDSS would produce the least biased growth rates, as long as the PHL underreporting is considered (e.g., by means of sensitivity analysis).
To strengthen viral surveillance, several future research directions can be proposed for the modeling framework that we have established:
Supplemental Material
sj-pdf-1-mdm-10.1177_0272989X211022276 – Supplemental material for Accuracy of State-Level Surveillance during Emerging Outbreaks of Respiratory Viruses: A Model-Based Assessment
Supplemental material, sj-pdf-1-mdm-10.1177_0272989X211022276 for Accuracy of State-Level Surveillance during Emerging Outbreaks of Respiratory Viruses: A Model-Based Assessment by Yuwen Gu, Elise DeDoncker, Richard VanEnk, Rajib Paul, Susan Peters, Gillian Stoltman and Diana Prieto in Medical Decision Making
Footnotes
Acknowledgements
We thank the Michigan Department of Health and Human Services for providing de-identified data sets from the Michigan Syndromic Surveillance System and for providing valuable comments and reviews for the improvement of this manuscript.
The author(s) declared no potential conflicts of interest with respect to the research, authorship, and/or publication of this article.
The author(s) disclosed receipt of the following financial support for the research, authorship, and/or publication of this article: This research was supported by the National Science Foundation Grant No. 1537379.
References
Supplementary Material
Please find the following supplemental material available below.
For Open Access articles published under a Creative Commons License, all supplemental material carries the same license as the article it is associated with.
For non-Open Access articles published, all supplemental material carries a non-exclusive license, and permission requests for re-use of supplemental material or any part of supplemental material shall be sent directly to the copyright owner as specified in the copyright notice associated with the article.