
Abstract
Objective:
Current chronic liver disease (CLD) mortality surveillance methods may not adequately capture data on all causes of CLD mortality. The objective of this study was to calculate and compare CLD death rates in New Mexico and the United States by using both an expanded definition of CLD and estimates of the fractional impact of alcohol on CLD deaths.
Methods:
We defined CLD mortality as deaths due to alcoholic liver disease, cirrhosis, viral hepatitis, and other liver conditions. We estimated alcohol-attributable CLD deaths by using national and state alcohol-attributable fractions from the Centers for Disease Control and Prevention’s Alcohol-Related Disease Impact application. We classified causes of CLD death as being alcohol-attributable, non–alcohol-attributable, or hepatitis C. We calculated average annual age-adjusted CLD death rates during five 3-year periods from 1999 through 2013, and we stratified those rates by sex, age, and race/ethnicity.
Results:
By cause of death, CLD death rates were highest for alcohol-attributable CLD. By sex and race/ethnicity, CLD death rates per 100 000 population increased from 1999-2001 to 2011-2013 among American Indian men in New Mexico (67.4-90.6) and the United States (38.9-49.4), American Indian women in New Mexico (48.4-63.0) and the United States (27.5-39.5), Hispanic men in New Mexico (48.6-52.0), Hispanic women in New Mexico (16.9-24.0) and the United States (12.8-13.1), non-Hispanic white men in New Mexico (17.4-21.3) and the United States (15.9-18.4), and non-Hispanic white women in New Mexico (9.7-11.6) and the United States (7.6-9.7). CLD death rates decreased among Hispanic men in the United States (30.5-27.4).
Conclusions:
An expanded CLD definition and alcohol-attributable fractions can be used to create comprehensive data on CLD mortality. When stratified by CLD cause and demographic characteristics, these data may help states and jurisdictions improve CLD prevention programs.
Chronic liver disease (CLD) is a largely preventable chronic condition marked by progressive destruction of healthy liver tissue during a period longer than 6 months. It imposes a substantial burden on the health care system in the United States. The National Center for Health Statistics (NCHS) reported that in 2015, CLD and cirrhosis was the 12th leading cause of death in the United States and resulted in more than 40 000 deaths. 1 It is also likely that cirrhosis deaths are underestimated. In a 1979-2008 assessment of liver-related mortality, if other liver-attributable causes of death (eg, hepatorenal syndrome, viral hepatitis, and hepatobiliary cancers) were included in the case definition, overall liver-attributable mortality was nearly twice as high as for CLD and cirrhosis alone, especially among non-white and Hispanic decedents. 2 Furthermore, the economic burden of cirrhosis is substantial, and treatment and prevention strategies continue to be resource intensive, especially for alcoholic liver disease. 3
Racial/ethnic disparities in CLD mortality exist. For example, according to the National Institute on Alcohol Abuse and Alcoholism, the age-adjusted cirrhosis death rate for Hispanic white men in 2013 was 1.5 times higher than for non-Hispanic white men, and it was 1.3 times higher for Hispanic white women than for non-Hispanic white women. 4 Disparities among other racial/ethnic minority groups are more difficult to ascertain. The National Institute on Alcohol Abuse and Alcoholism does not report separate death rates for American Indian/Alaska Natives, Asians, or Pacific Islanders but, instead, includes rates for American Indian/Alaska Natives, Asians, and Pacific Islanders in the all races category. On the other hand, the NCHS, which provides death rates for American Indians separately, reported that in 2014, CLD and cirrhosis were the 11th leading cause of death among non-Hispanic white men and women but the 4th leading cause of death among American Indians. 1
CLD can be caused by various behaviors and conditions, including excessive alcohol consumption, viral hepatitis, and nonalcoholic fatty liver disease. The relative contribution of various causes to the overall burden of CLD has changed. Historically, excessive alcohol consumption was the leading cause of CLD. 4,5 However, because of an increase in cases of hepatitis C from 1999 to 2007, hepatitis C has become an increasingly substantial contributor to CLD. 6 Conventional CLD surveillance methods use International Classification of Diseases, 10th Revision (ICD-10) codes 7 for only alcoholic liver disease and cirrhosis to identify CLD deaths 4 ; these methods exclude viral hepatitis codes, although deaths caused by end-stage hepatitis C infection are almost entirely due to decompensated cirrhosis. Thus, CLD surveillance definitions that omit other relevant conditions, such as viral hepatitis, portal hypertension, and fatty liver disease, could result in incomplete data on CLD mortality.
Conventional methods for assessing the contribution of excessive alcohol consumption to CLD mortality may also result in incomplete data. The role of alcohol is typically determined by using only the ICD-10 codes for alcoholic liver disease on death certificates. 8 Not only does the use of this code alone potentially miss other liver diseases in which alcohol may have played a partial role, but also death certificates in general frequently underestimate the role of alcohol. In one assessment of veterans using deaths from 1965-1983, researchers found that deaths due to alcohol consumption were underestimated 6-fold when only death certificates were used instead of additional medical and legal records. 9
To help more accurately estimate the population-based impact of excessive alcohol consumption on mortality, the Centers for Disease Control and Prevention developed the Alcohol-Related Disease Impact (ARDI) application. 10 ARDI uses an allocation methodology to estimate the fractional impact of alcohol on deaths from 54 acute and chronic causes. For example, whereas some causes of death (eg, alcoholic liver disease) are considered to be 100% attributable to alcohol, other causes of death are considered to be only fractionally attributable to alcohol (eg, unspecified cirrhosis is considered to be 40% attributable to alcohol). These alcohol-attributable fractions are either measured directly or calculated indirectly based on current scientific literature. They do not change from year to year; rather, they are revised periodically as the literature is updated. CLD surveillance definitions that include the use of ARDI could result in more complete data on CLD mortality.
State and local public health jurisdictions use surveillance data to prioritize and target interventions for diseases. A clear understanding of the demographic characteristics and causes of CLD mortality, based on comprehensive state- and national-level data, is crucial when developing prevention initiatives for CLD. The issue of CLD mortality is particularly pertinent in New Mexico. In 2016, New Mexico had the highest CLD death rate in the nation (24.9 deaths per 100 000 population, followed by South Dakota with 16.4 deaths per 100 000 population), compared with the national rate of 10.7 deaths per 100 000 population. 11 In 2016, 48.5% of New Mexico’s population was Hispanic and 10.6% of the population was American Indian/Alaska Native; the prevalence of CLD is high among both populations. 12 In 2013, annual alcohol consumption in New Mexico was >2.3 gallons per capita among people aged ≥14, putting New Mexico into a group of states with alcohol consumption levels >10% higher than the Healthy People 2020 target of 2.1 gallons per person. 13
The objective of this study was to calculate and compare CLD death rates in New Mexico and the United States during a 15-year period, using an expanded definition of CLD and estimates of the fractional impact of alcohol on CLD deaths. We hypothesized that adding these methods might result in more comprehensive data on CLD mortality and that stratification of these data by cause, age, sex, and race/ethnicity might identify disparities in CLD mortality among some demographic groups.
Methods
We examined multiple cause-of-death data from death certificates, available from the NCHS, to identify all CLD deaths in New Mexico and the United States for 1999-2013. 14 We used ICD-10 codes to define the underlying cause of CLD mortality (Table), and we estimated alcohol-attributable CLD deaths by using ARDI’s national and state alcohol-attributable fractions. 10
Causes of chronic liver disease mortality by category, ICD-10 code, and percentage of deaths attributable to alcohol
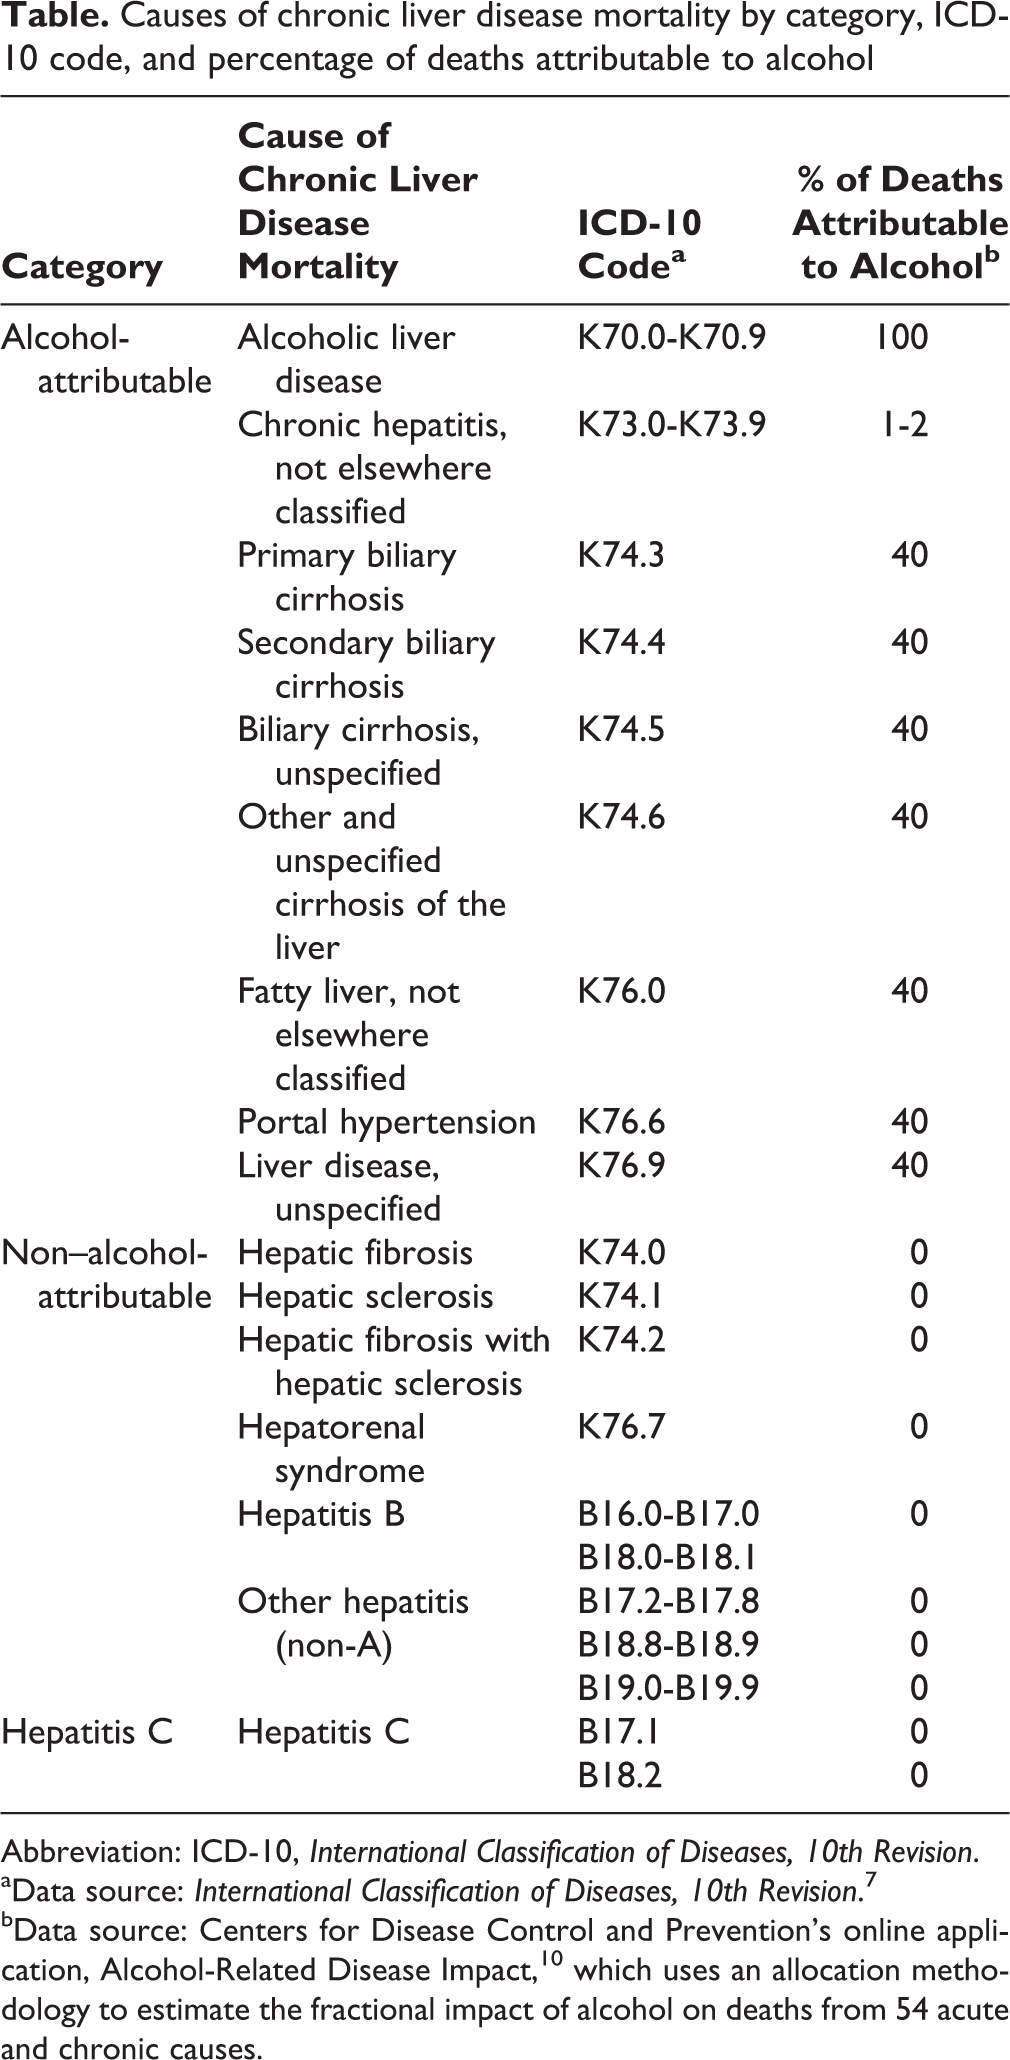
Abbreviation: ICD-10, International Classification of Diseases, 10th Revision.
aData source: International Classification of Diseases, 10th Revision. 7
bData source: Centers for Disease Control and Prevention’s online application, Alcohol-Related Disease Impact, 10 which uses an allocation methodology to estimate the fractional impact of alcohol on deaths from 54 acute and chronic causes.
Using ICD-10 codes, we identified 16 causes of CLD mortality and grouped them into 3 overall categories: alcohol-attributable, non–alcohol-attributable, and hepatitis C. We created a hepatitis C category because of increasing death rates due to hepatitis C infection and the recent emergence of hepatitis C infection as a major public health problem. We assigned alcohol-attributable fractions to each of the 16 causes of CLD mortality (Table).
We calculated death rates for the 3 overall causes of CLD death by age, race/ethnicity, and sex. To calculate robust death rates for New Mexico’s small population (2 088 070 in 2017), 12 we determined the number of CLD deaths and then calculated average annual death rates using five 3-year periods from 1999-2013. With the exception of rates by age group, we age-adjusted the death rates to the 2000 US standard population, 15 and we expressed these rates as deaths per 100 000 population.
We used percentage change to describe increases and decreases in average annual death rates from 1999-2013. We used 1999-2013 bridged-race population estimates released by the NCHS 16 as denominators when calculating death rates. Race bridging refers to making data collected using 1 set of race categories consistent with data collected using a different set of race categories. We calculated CLD death rates by cause of CLD death, age, race/ethnicity, and sex to determine how the rates changed over time.
We calculated death rates for the following racial/ethnic categories: non-Hispanic white, Hispanic, and American Indian/Alaska Native. We did not calculate rates for Asians, Pacific Islanders, or African Americans because of small numbers of people in these groups (cell size ≤10 people) in New Mexico. We obtained data on demographic characteristics from the NCHS data file. 14 We used SAS version 9.4 for all analyses. 17
Results
During 2011-2013, the most recent period studied, 1971 CLD deaths occurred in New Mexico (an average of 657 deaths per year) and 149 461 CLD deaths occurred in the United States (an average of 49 820 deaths per year). Of the 1971 CLD deaths in New Mexico, 1170 (59.4%) were due to alcohol-attributable causes, 551 (28.0%) were due to non–alcohol-attributable causes, and 250 (12.7%) were due to hepatitis C. Of the 149 461 CLD deaths in the United States during this same period, 81 010 (54.2%) were due to alcohol-attributable causes, 46 698 (31.2%) were due to non–alcohol-attributable causes, and 21 753 (14.6%) were due to hepatitis C.
The overall CLD death rate per 100 000 population increased in New Mexico and the United States between 1999-2001 and 2011-2013: the rate increased by 27.0% (from 22.6 to 28.7) in New Mexico and by 12.9% (from 12.4 to 14.0) in the United States (Figure 1).
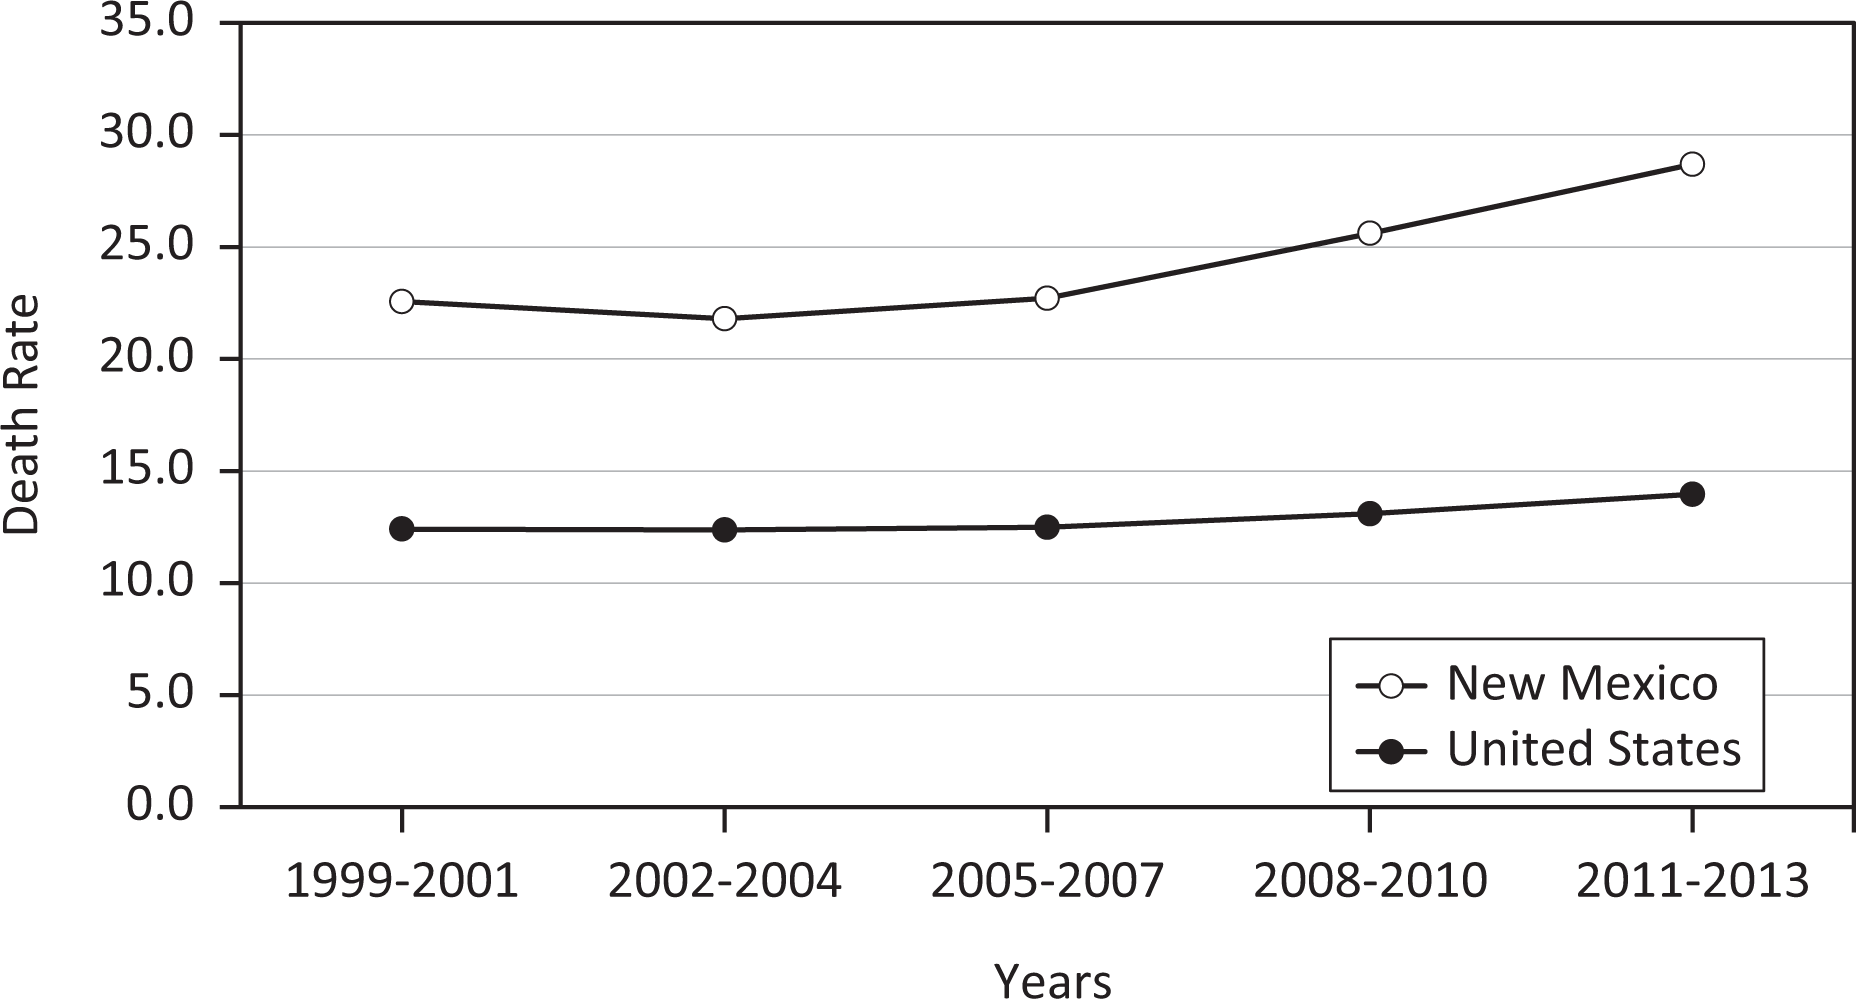
Age-adjusted death rates from chronic liver disease, United States and New Mexico, 1999-2013. Death rates are age-adjusted to the 2000 US standard population, calculated as average annual death rates during five 3-year periods from 1999-2013, and reported as deaths per 100 000 population.
In both the United States and New Mexico, alcohol-attributable CLD accounted for most CLD deaths, followed by non–alcohol-attributable CLD and hepatitis C (Figure 2). In the United States, alcohol-attributable CLD deaths per 100 000 population increased by 14.9%, from 6.7 in 1999-2001 to 7.7 in 2011-2013; non–alcohol-attributable CLD deaths increased by 4.8%, from 4.2 in 1999-2001 to 4.4 in 2011-2013; and hepatitis C deaths increased by 26.7%, from 1.5 in 1999-2001 to 1.9 in 2011-2013. During these same periods in New Mexico, alcohol-attributable CLD deaths per 100 000 population increased by 24.5%, from 13.9 to 17.3; non–alcohol-attributable CLD deaths increased by 31.7%, from 6.0 to 7.9; and hepatitis C deaths increased by 34.6%, from 2.6 to 3.5.
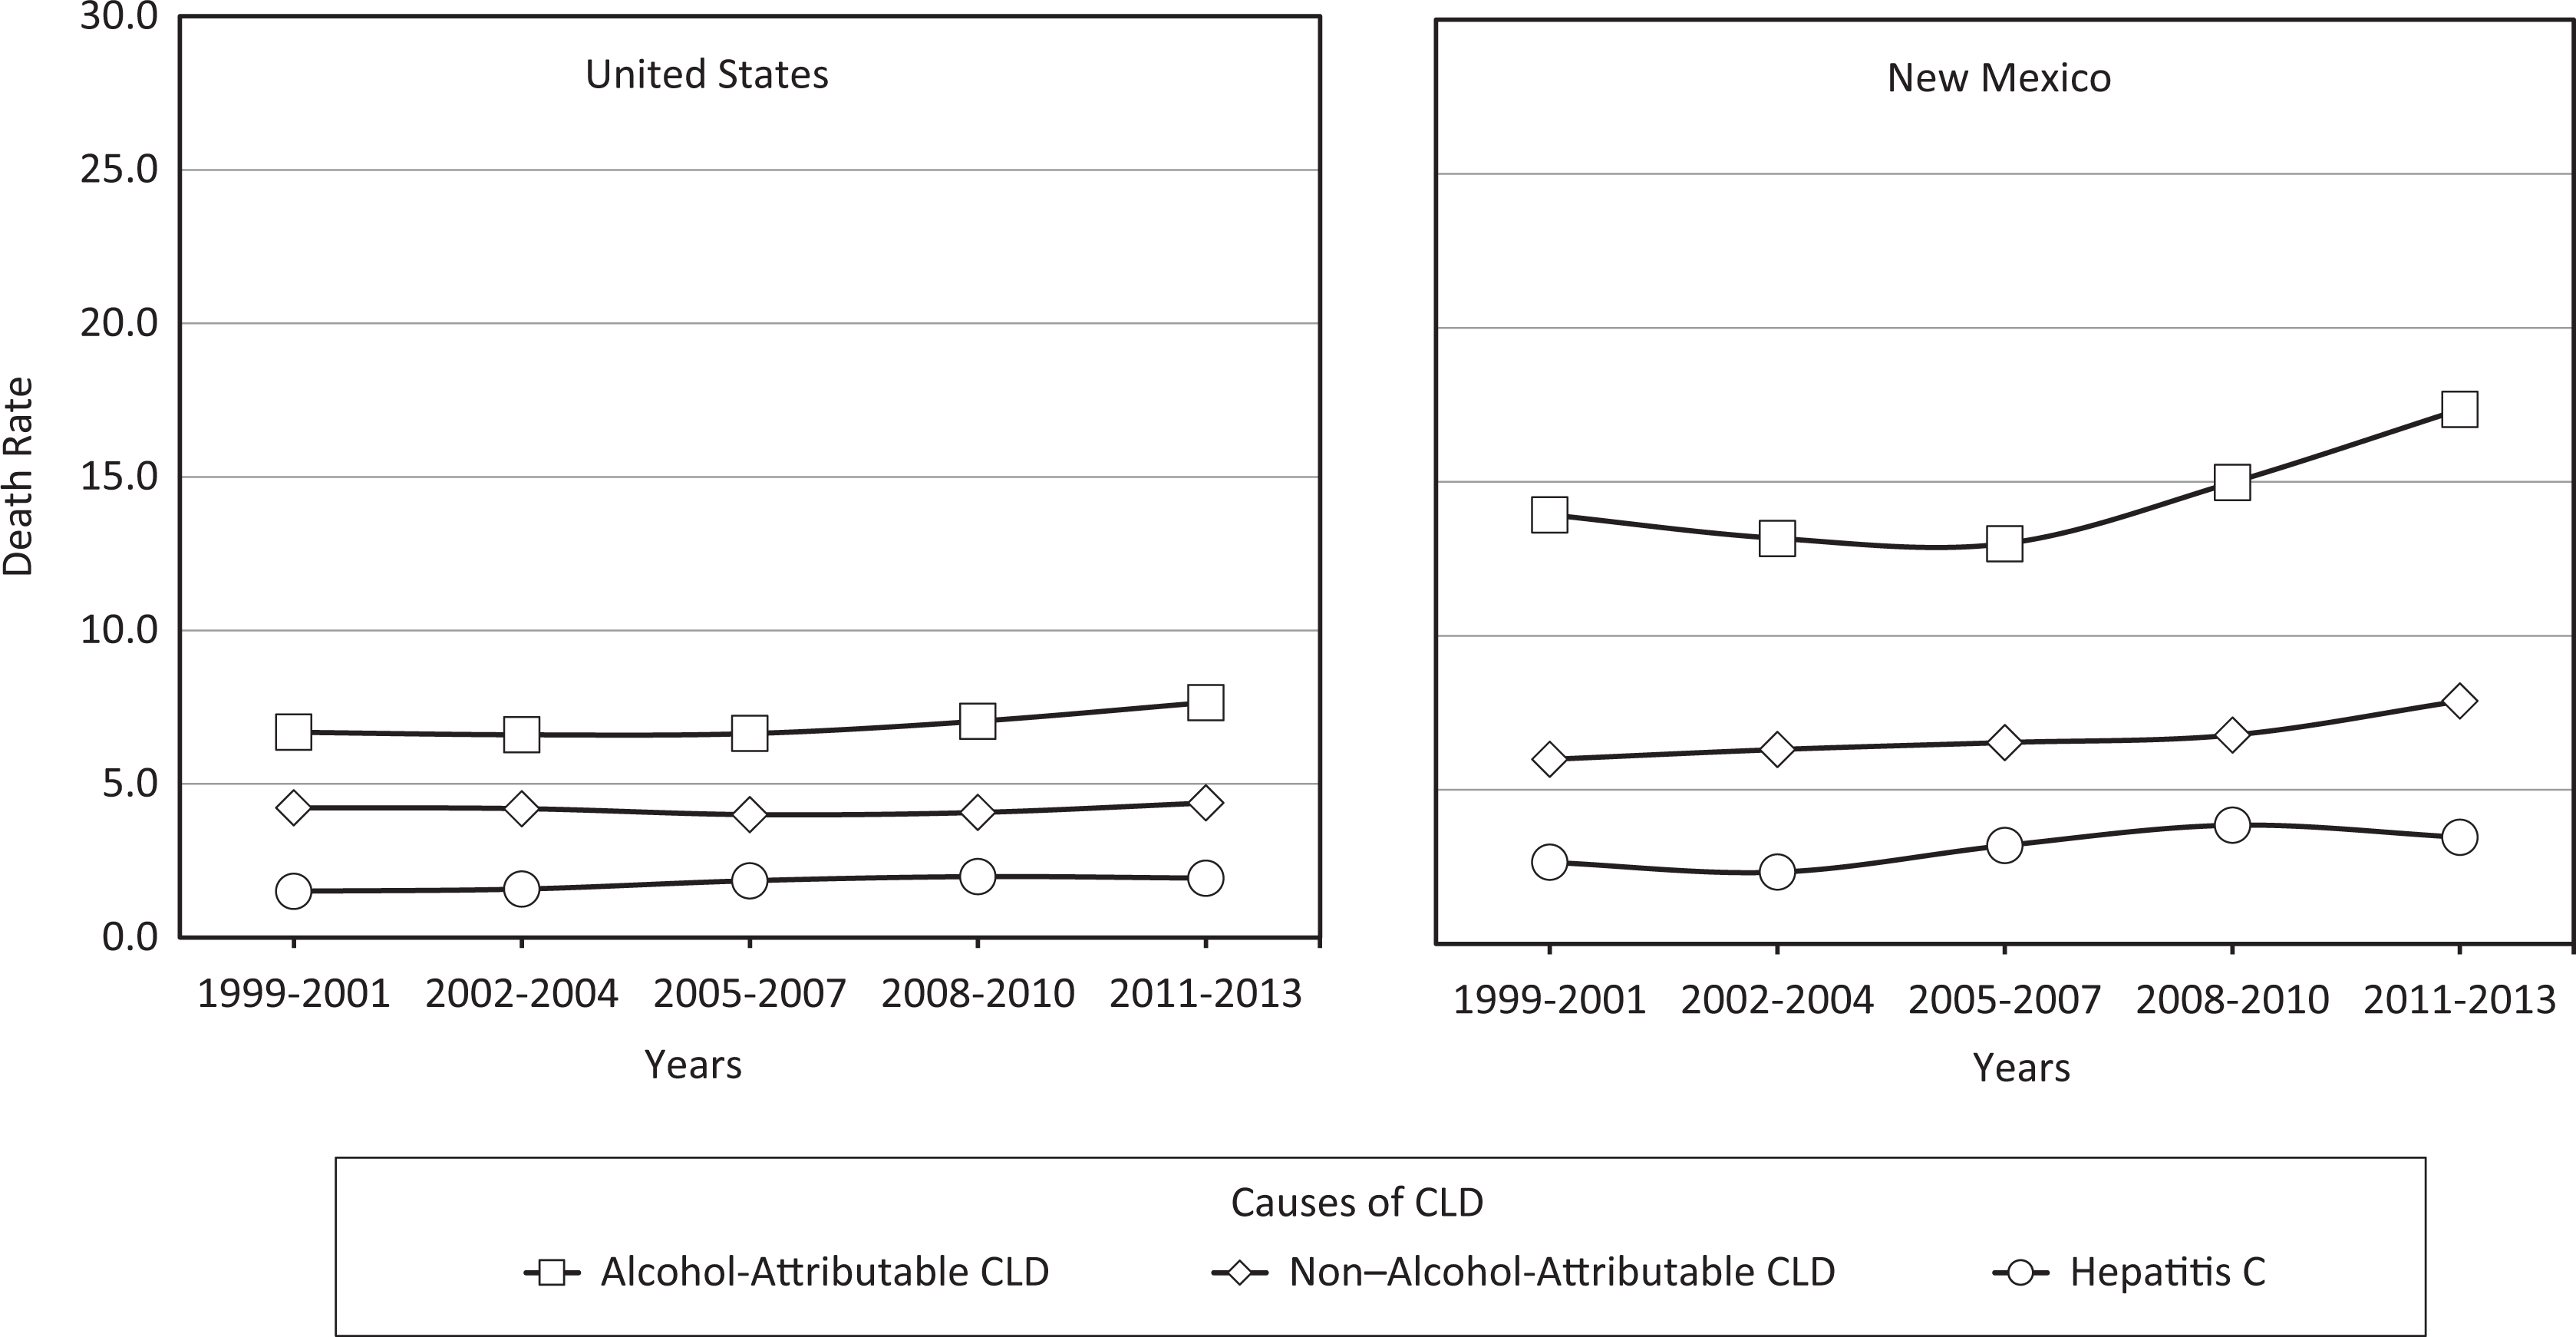
Age-adjusted death rates from chronic liver disease (CLD), by cause of death, United States and New Mexico, 1999-2013. Death rates are age-adjusted to the 2000 US standard population, calculated as average annual death rates during 3-year periods from 1999-2013, and reported as deaths per 100 000 population. The cause of CLD death was categorized as either alcohol-attributable CLD, non–alcohol-attributable CLD, or hepatitis C.
In the United States, the CLD death rate per 100 000 population increased with age (Figure 3). The highest CLD death rate (38.0), by age, was among adults aged ≥65 in 2011-2013. However, the increase in CLD death rates from 1999-2001 to 2011-2013 (34.8%) was highest among 45- to 64-year-olds, increasing from 26.4 to 35.6 deaths per 100 000 population. Similarly, in New Mexico, CLD death rates from 1999-2001 to 2011-2013 among 45- to 64-year-olds increased by 44.2%, from 49.6 to 71.5 deaths per 100 000 population. Although the CLD death rates in the United States for each period were consistently highest for those aged ≥65, the CLD death rates in New Mexico fluctuated by age during the study period: the rates per 100 000 population were highest for adults aged ≥65 in 1999-2001 (54.8) and 2002-2004 (50.0), but the rates were highest for 45- to 64-year-olds during 2005-2007 (52.3), 2008-2010 (58.1), and 2011-2013 (71.5).
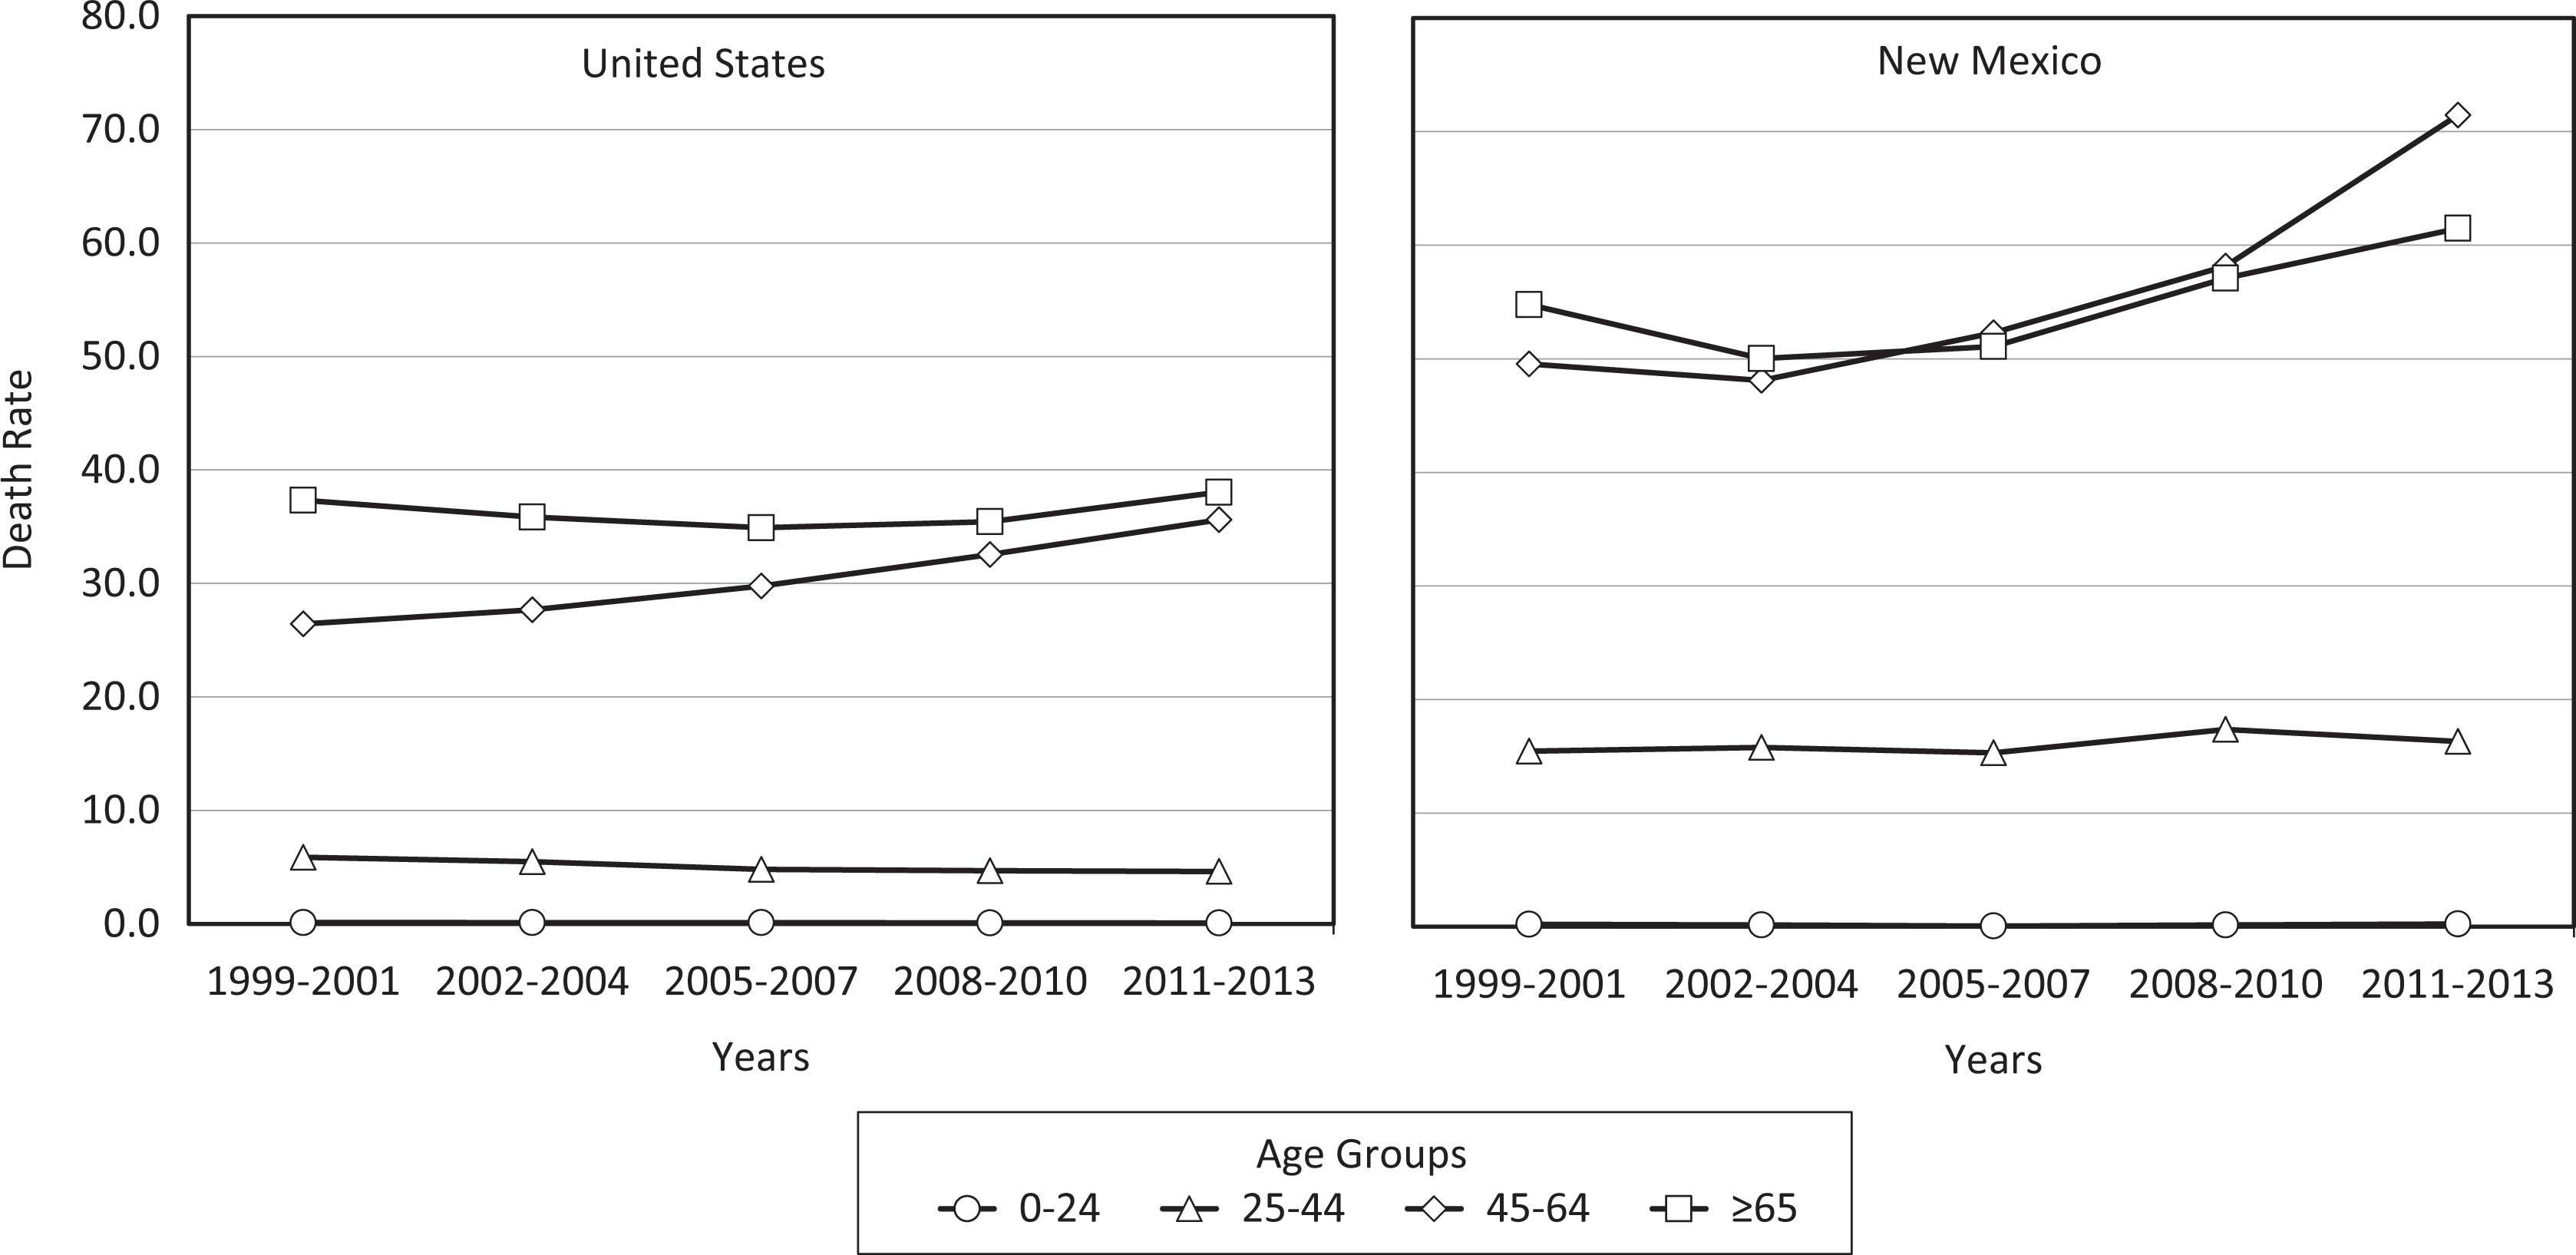
Age-adjusted death rates of chronic liver disease, by age group, United States and New Mexico, 1999-2013. Death rates are age-adjusted to the 2000 US standard population, calculated as average annual death rates during 3-year periods from 1999-2013, and reported as deaths per 100 000 population.
In New Mexico and the United States, men had higher CLD death rates than women in all 3 racial/ethnic categories and for all 5 periods (Figure 4). In addition, in New Mexico and the United States, American Indian/Alaska Native and Hispanic men and women had higher CLD death rates than non-Hispanic white men and women during all 5 periods.
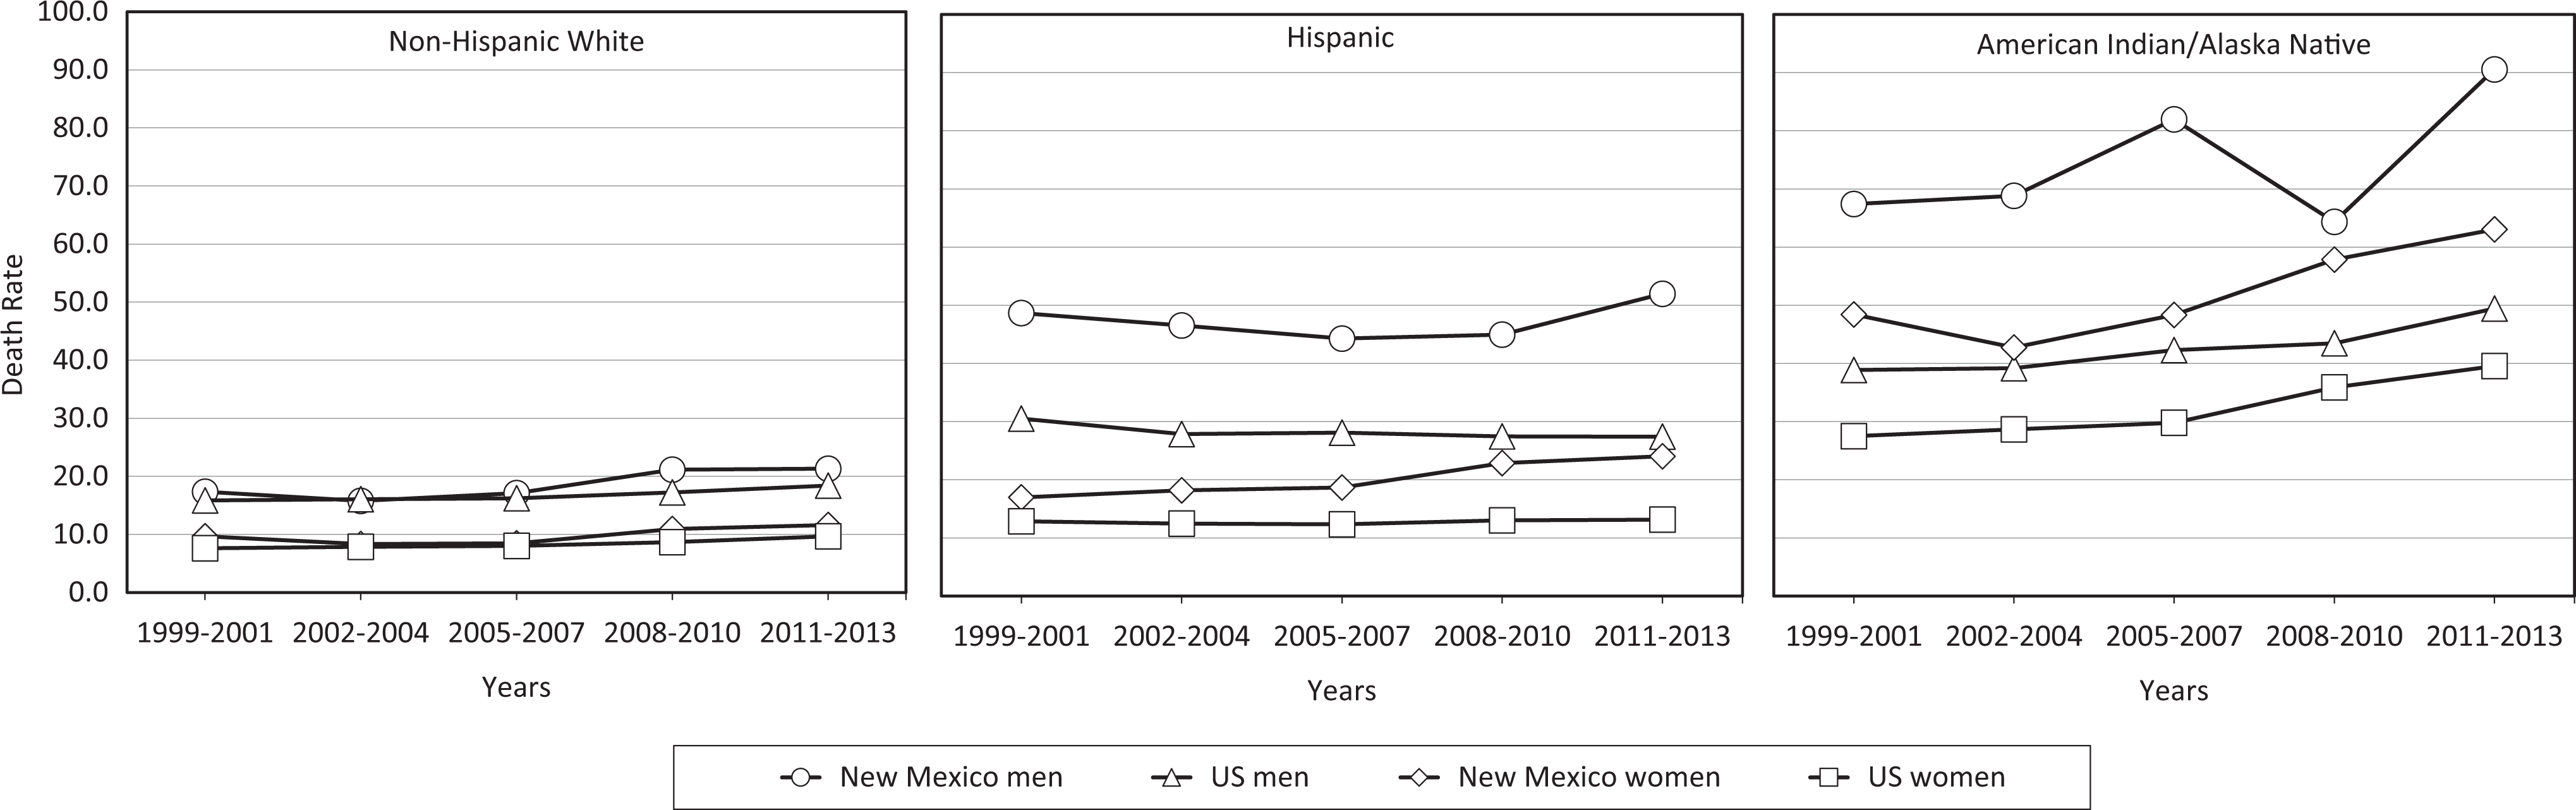
Age-adjusted death rates of chronic liver disease, by race/ethnicity and sex, United States and New Mexico, 1999-2013. Death rates are age-adjusted to the 2000 US standard population, calculated as average annual death rates during 3-year periods from 1999-2013, and reported as deaths per 100 000 population. Death rates for Asians, Pacific Islanders, and African Americans are not shown because of small numbers (cell size ≤10 people) in New Mexico.
CLD death rates per 100 000 population increased from 1999-2001 to 2011-2013 for both American Indian/Alaska Native men (by 34.4%, from 67.4-90.6) and women (by 30.2%, from 48.4-63.0) in New Mexico, and for both American Indian/Alaska Native men (by 27.0%, from 38.9-49.4) and women (by 43.6%, from 27.5-39.5) in the United States (Figure 4). Among Hispanic men, the CLD death rate per 100 000 population increased from 1999-2001 to 2011-2013 in New Mexico (by 7.0%, from 48.6-52.0) but decreased in the United States (by 10.2%, from 30.5-27.4). Among Hispanic women, the CLD death rate per 100 000 population increased from 1999-2001 to 2011-2013 in New Mexico (by 42.0%, from 16.9-24.0) and in the United States (by 2.3%, from 12.8-13.1). CLD death rates during these periods also increased among non-Hispanic white men in New Mexico (by 22.4%, from 17.4-21.3) and the United States (by 15.7%, from 15.9-18.4), as well as among non-Hispanic white women in New Mexico (by 19.6%, from 9.7-11.6) and the United States (by 27.6%, from 7.6-9.7).
Discussion
Whereas typical surveillance methods for CLD mortality use only deaths caused by alcoholic liver disease and cirrhosis, 4 our expanded definition of CLD mortality included deaths caused by viral hepatitis and other diseases of the liver, including portal hypertension, fatty liver disease, and hepatorenal syndrome. We based the use of this expanded definition on the fact that deaths of people with these other diagnoses are historically and almost entirely due to complications of liver disease. 18 We also based it on the notion that including these other diagnoses, particularly viral hepatitis, in the definition of CLD mortality is important for accurately estimating the true burden of CLD. 19 Indeed, several studies suggest that most CLD deaths are not accounted for when the more limited NCHS definition for CLD mortality is used. For example, one study of 1979-2008 data compared clinical records with death records and found that the NCHS definition of CLD would have accounted for only 27.2% of CLD deaths. 2 Another study of deaths from October 1999–September 2000 found that when medical charts and medical examiner records were examined, the NCHS definition of CLD had a sensitivity of only 36%. 20
Furthermore, the ICD-10 code (K70) for alcoholic liver disease is typically the only code used to track alcohol-attributable CLD deaths in surveillance, including when National Institute on Alcohol Abuse and Alcoholism definitions are used. 4,8 However, many CLD deaths caused by conditions such as biliary cirrhosis, unspecified cirrhosis, fatty liver disease, portal hypertension, chronic hepatitis, and unspecified liver disease are also attributable to alcohol to some degree. 21,22 Our study found that the alcohol-attributable CLD death rate for the United States was 7.7 deaths per 100 000 population for 2011-2013, which was 34% higher than the rate reported by the National Institute on Alcohol Abuse and Alcoholism for 2013 (5.1 deaths per 100 000 population). 4 The CLD death rate for the United States may have been higher in our study because we included CLD deaths in which a fraction was considered to be attributable to alcohol. To our knowledge, the use of ARDI to estimate the impact of alcohol on all CLD deaths has not previously been reported. And yet, despite our use of the ARDI estimates, it is possible that we underestimated the impact of alcohol, because although deaths caused by viral hepatitis were not classified as alcohol-attributable, excessive alcohol use and hepatitis C infection do frequently co-occur. 23
Our results also highlight certain racial/ethnic disparities in CLD mortality data. For example, we found that in 2011-2013, American Indian/Alaska Native men in New Mexico had a CLD death rate that was more than 4 times higher than that of non-Hispanic white men in New Mexico. Historically, national CLD surveillance reports have not provided separate CLD death rates for American Indian/Alaska Natives. 4 Our results underscore the importance of developing CLD prevention activities for the American Indian/Alaska Native population. Furthermore, although death records have been used to estimate CLD death rates in this group, relying on this approach alone may underestimate both American Indian/Alaska Native CLD death rates and the disparity in these rates between American Indian/Alaska Native men and women and non-Hispanic white men and women. For example, one study linked 1999-2009 death records to Indian Health Service clinical records and reported that the use of death records from the NCHS alone led to the underreporting of CLD mortality among American Indian/Alaska Natives. 24 Accurate CLD mortality surveillance data, stratified by race/ethnicity, are needed to better inform and tailor prevention measures for the diverse populations affected by CLD. The high CLD death rates that we found among American Indian/Alaska Natives suggest that in states such as New Mexico, with large American Indian/Alaska Native populations, a focus on primary, secondary, and tertiary prevention of CLD, tailored to this group, is warranted.
We also found disparities in CLD mortality by sex. In both New Mexico and the United States, and in all 3 racial/ethnic groups, men had higher CLD death rates than women, suggesting a possible benefit to focusing CLD prevention efforts on men. However, we also found that CLD death rates in women, particularly American Indian/Alaska Native women, in both New Mexico and the United States, rose rapidly during 2008-2010 and 2011-2013. These findings, combined with the fact that women with alcoholic liver disease may progress more rapidly to fibrosis than men and have persistent fibrosis even after abstaining from alcohol, 25 suggest that a robust CLD prevention campaign for women would also be warranted. And, as with our results on racial/ethnic disparities, our findings demonstrate the potential benefits of having demographically stratified data on CLD mortality for strategic planning.
In addition, our results suggest that some states may particularly benefit by focusing attention on prevention efforts that target the excessive alcohol consumption that contributes to alcohol-attributable CLD. Increasing the price of alcoholic beverages through alcohol tax increases may be particularly effective in reducing rates of death caused by cirrhosis. A study published in 2002 estimated that a $1 increase in the distilled spirits tax would lower cirrhosis death rates by 5.4% to 10.8%. 26 Another study found alcohol screening and brief interventions to be effective in reducing chronic or heavy drinking among at-risk drinkers. 27 Moreover, decreasing alcohol outlet density (ie, the number and concentration of physical locations in a geographic area that sell alcohol to the public) may decrease CLD death rates. 28 Last, providing access to affordable treatment for CLD and hepatitis C is a tertiary prevention strategy that would likely reduce CLD mortality.
Limitations
This study had several limitations. First, the results could have been influenced by inaccuracies or biases in the reporting of causes of death on death certificates (eg, underascertainment or underreporting of hepatitis C; over- or underattribution of alcohol as a cause), particularly if the inaccuracies were systematic, such as by race/ethnicity. For example, a study published in 2004 demonstrated that increases in hepatitis C death rates from 1990-1998 coincided with concurrent decreases in alcohol-attributable death rates, but this decrease was likely because of better testing for hepatitis C rather than a real change in mortality. 19 Second, the ARDI application used for our study relied on pooled risk estimates obtained from large systematic reviews of the scientific literature to develop the state-based fractions. Also, alcohol-attributable fractions were not available by race/ethnicity. Consequently, the fractions we used could have under- or overestimated the impact of alcohol on mortality in New Mexico or on certain racial/ethnic groups. Last, our results may not be generalizable to other states or to countries outside of the United States.
Conclusions
This study demonstrated the ability to use alcohol-attributable fractions to create more comprehensive and possibly more accurate data on CLD mortality. State-level, demographically stratified data on CLD mortality may help to increase awareness of CLD mortality and to guide prevention efforts involving this serious public health problem.
Footnotes
Acknowledgments
The contents of this article are solely the responsibility of the authors and do not necessarily represent the official views of the Centers for Disease Control and Prevention or the US Department of Health and Human Services.
Declaration of Conflicting Interests
The authors declared no potential conflicts of interest with respect to the research, authorship, and/or publication of this article.
Funding
The authors disclosed receipt of the following financial support for the research, authorship, and/or publication of this article: This publication was supported by Cooperative Agreement No. NU58DP006050, funded by the Centers for Disease Control and Prevention.