
Abstract
Objectives:
The objectives of this study were to (1) determine the impact of a 1-year elementary school physical activity intervention on changes in teacher-reported school-based physical activity time and (2) assess the relationship between these changes and changes in student aerobic capacity.
Methods:
HealthMPowers, a nonprofit organization, provided a multicomponent physical activity intervention to 3479 students in 39 schools in Georgia during 2013-2014. HealthMPowers administered a survey to faculty members before (August 2013) and after (May 2014) the intervention to measure student physical activity times. The organization collected pre- and post-intervention Progressive Aerobic Cardiovascular Endurance Run (PACER) laps (a measure of aerobic capacity that awards 1 lap for each completed 20-meter lap) for 2342 fourth-grade students. We performed linear regression to determine the relationship between school-level changes in teacher-reported school-based physical activity time and student aerobic capacity.
Results:
The weekly estimated teacher-reported time in physical activity increased by 39 minutes from pre- to post-intervention: 21 minutes for recess, 17 minutes for classroom, and 1 minute for physical education. The mean number of student PACER laps increased by 3 laps from pre- to post-intervention, and 1515 of 2342 (65%) students increased the number of PACER laps completed. We observed a positive association between school-level changes in school-based physical activity time and school-level changes in PACER laps (r = 0.38; 95% confidence interval, 0.29-0.46).
Conclusions:
These findings highlight the need for more prospective research into multicomponent physical activity interventions. Rigorous testing, including randomized controlled trials of large-scale implementations, is needed to examine how these school-based interventions might be used to improve the physical activity and fitness of larger populations of children.
Physical activity is an essential factor in promoting health in childhood and later adulthood. Increased physical activity can have a substantial positive influence on numerous diseases. 1 It is inversely related to obesity; to morbidity due to coronary heart disease, stroke, cardiovascular disease, and cancer; and to all-cause mortality. 2,3 Furthermore, childhood obesity is an important risk factor for adult atherosclerosis and related diseases (eg, hypercholesterolemia and hypertension) that may develop during childhood. 4 Once these diseases are established, they can persist into adulthood.
The negative health outcomes associated with physical inactivity are often magnified by disparities in income and education. Children in households with low incomes and low parental education levels have an increased risk of obesity compared with children in households with higher socioeconomic status (SES), and children living in communities with less access to recreational facilities are less physically active and have an increased risk of obesity compared with children living in areas with greater access to facilities. 5,6 Furthermore, schools in low-SES communities often have fewer resources for physical activity than schools in higher-SES communities. 7
Yet, despite the known consequences of physical inactivity, even children without these socioeconomic barriers tend not to get enough physical activity. For example, in 2014, only 32% of children in the United States met the recommended 300-minute-per-week aerobic activity guideline. 8 In this context, schools can potentially provide an ideal environment in which to encourage children to be physically active, not only because they serve >94% of children aged 5-17, but also because a substantial portion of children’s time is spent in school. 9
School-based multicomponent physical activity interventions have been used to address low levels of childhood physical activity and fitness. 10,11 One such intervention model is the Comprehensive School Physical Activity Program (CSPAP), developed by the Centers for Disease Control and Prevention (CDC) in conjunction with the Society of Health and Physical Educators. The CSPAP multicomponent model aims to help students reach the goal of 60 minutes of daily physical activity by using 5 components: (1) quality physical education that provides appropriate instruction, opportunities for students to learn meaningful content, and student and program assessments; (2) school-based physical activity, including incorporation of physical activity into the classroom and promotion of recess; (3) before- and after-school physical activity programs; (4) family and community engagement; and (5) commitment to healthy lifestyle changes for staff members, support for staff member wellness, and training of staff members to improve the culture of physical activity in the school. 12,13 In a systematic review and meta-analysis of 14 CSPAP-type programs that incorporated 2 to 4 of these components, 11 the authors reported that these programs had a small but positive impact on daily levels of student physical activity (effect size g = 0.11; 95% confidence interval [CI], 0.03-0.19). They also noted that although the overall effect size was small, schools that incorporated more rather than fewer of the CSPAP components had larger effect sizes.
Typically, physical activity results in improved physical fitness through beneficial physiologic adaptations, which can be seen in as little as 6 weeks. 14 Aerobic capacity has been used to measure the effectiveness of physical activity intervention programs. 15 Body mass index (BMI) has also been used to assess exercise interventions, although its use for this purpose has been limited by its inability to distinguish lean muscle mass from fat mass, the substantial influence of outside factors including personal diet or nutrition programs on its levels, and the lower likelihood of observing BMI changes in children who are already not overweight and not obese. 16
The objectives of this evaluation were to (1) determine the impact of a 1-year elementary school physical activity intervention, using all 5 CSPAP components, on changes in teacher-reported school-based physical activity time and (2) assess the relationship between these changes and changes in student aerobic capacity.
Methods
We used data collected before and after a CSPAP-modeled multicomponent school-based intervention that was performed by HealthMPowers, a nonprofit organization based in Atlanta, Georgia, that promotes healthy eating and physical activity in schools using evidence-based guidelines established by CDC. Because the program evaluation did not meet the criteria of human subjects research, it did not fall under the scope of the Emory University Institutional Review Board.
Intervention Program
HealthMPowers recruited elementary schools from the central Georgia area in spring and summer 2013 and enrolled 39 low-income schools in 5 geographically diverse counties in Georgia with high proportions of students receiving free and reduced-price lunches. Our evaluation focused on the 3479 fourth-grade students from these 39 schools, because that was the first grade level for which FitnessGram data could be gathered. 17
HealthMPowers implemented the intervention at these 39 schools during the 2013-2014 school year; August 2013 was considered pre-intervention and May 2014 was considered post-intervention. As part of the intervention, HealthMPowers provided >20 hours of training to school representatives in August and November 2013 and February 2014 and furnished technical support, program and curriculum resources, equipment and tracking devices, and external evaluation services to the schools. Two to 3 representatives from each school (ie, administrators, physical education teachers, and classroom teachers) completed a baseline survey (August) of current physical activity practices in their school, reviewed the results, developed a personalized action plan to increase physical activity among their students, and completed another survey of physical activity practices at the end of the intervention (May).
CSPAP components and the elements of this intervention that addressed them included the following: Physical education: strategies to emphasize moderate to vigorous physical activity Physical activity during school: classroom exercise DVDs, classroom physical activity integration strategies and activities, pedometer math games, morning announcements, recess games and reminders, and an emphasis on not taking away recess as a punishment Physical activity before school: the Build Our Kids’ Success before-school program, exercise sequence creation worksheets, and walking and pedometer games Family and community engagement: take-home educational materials and physical activity resources Staff member wellness: individualized health training, pedometer challenges, and challenges to catch teachers practicing healthy behaviors (Table 1)
Elements of a physical activity intervention,a by Comprehensive School Physical Activity Programb (CSPAP) component, at 39 elementary schools, Georgia, 2013-2014
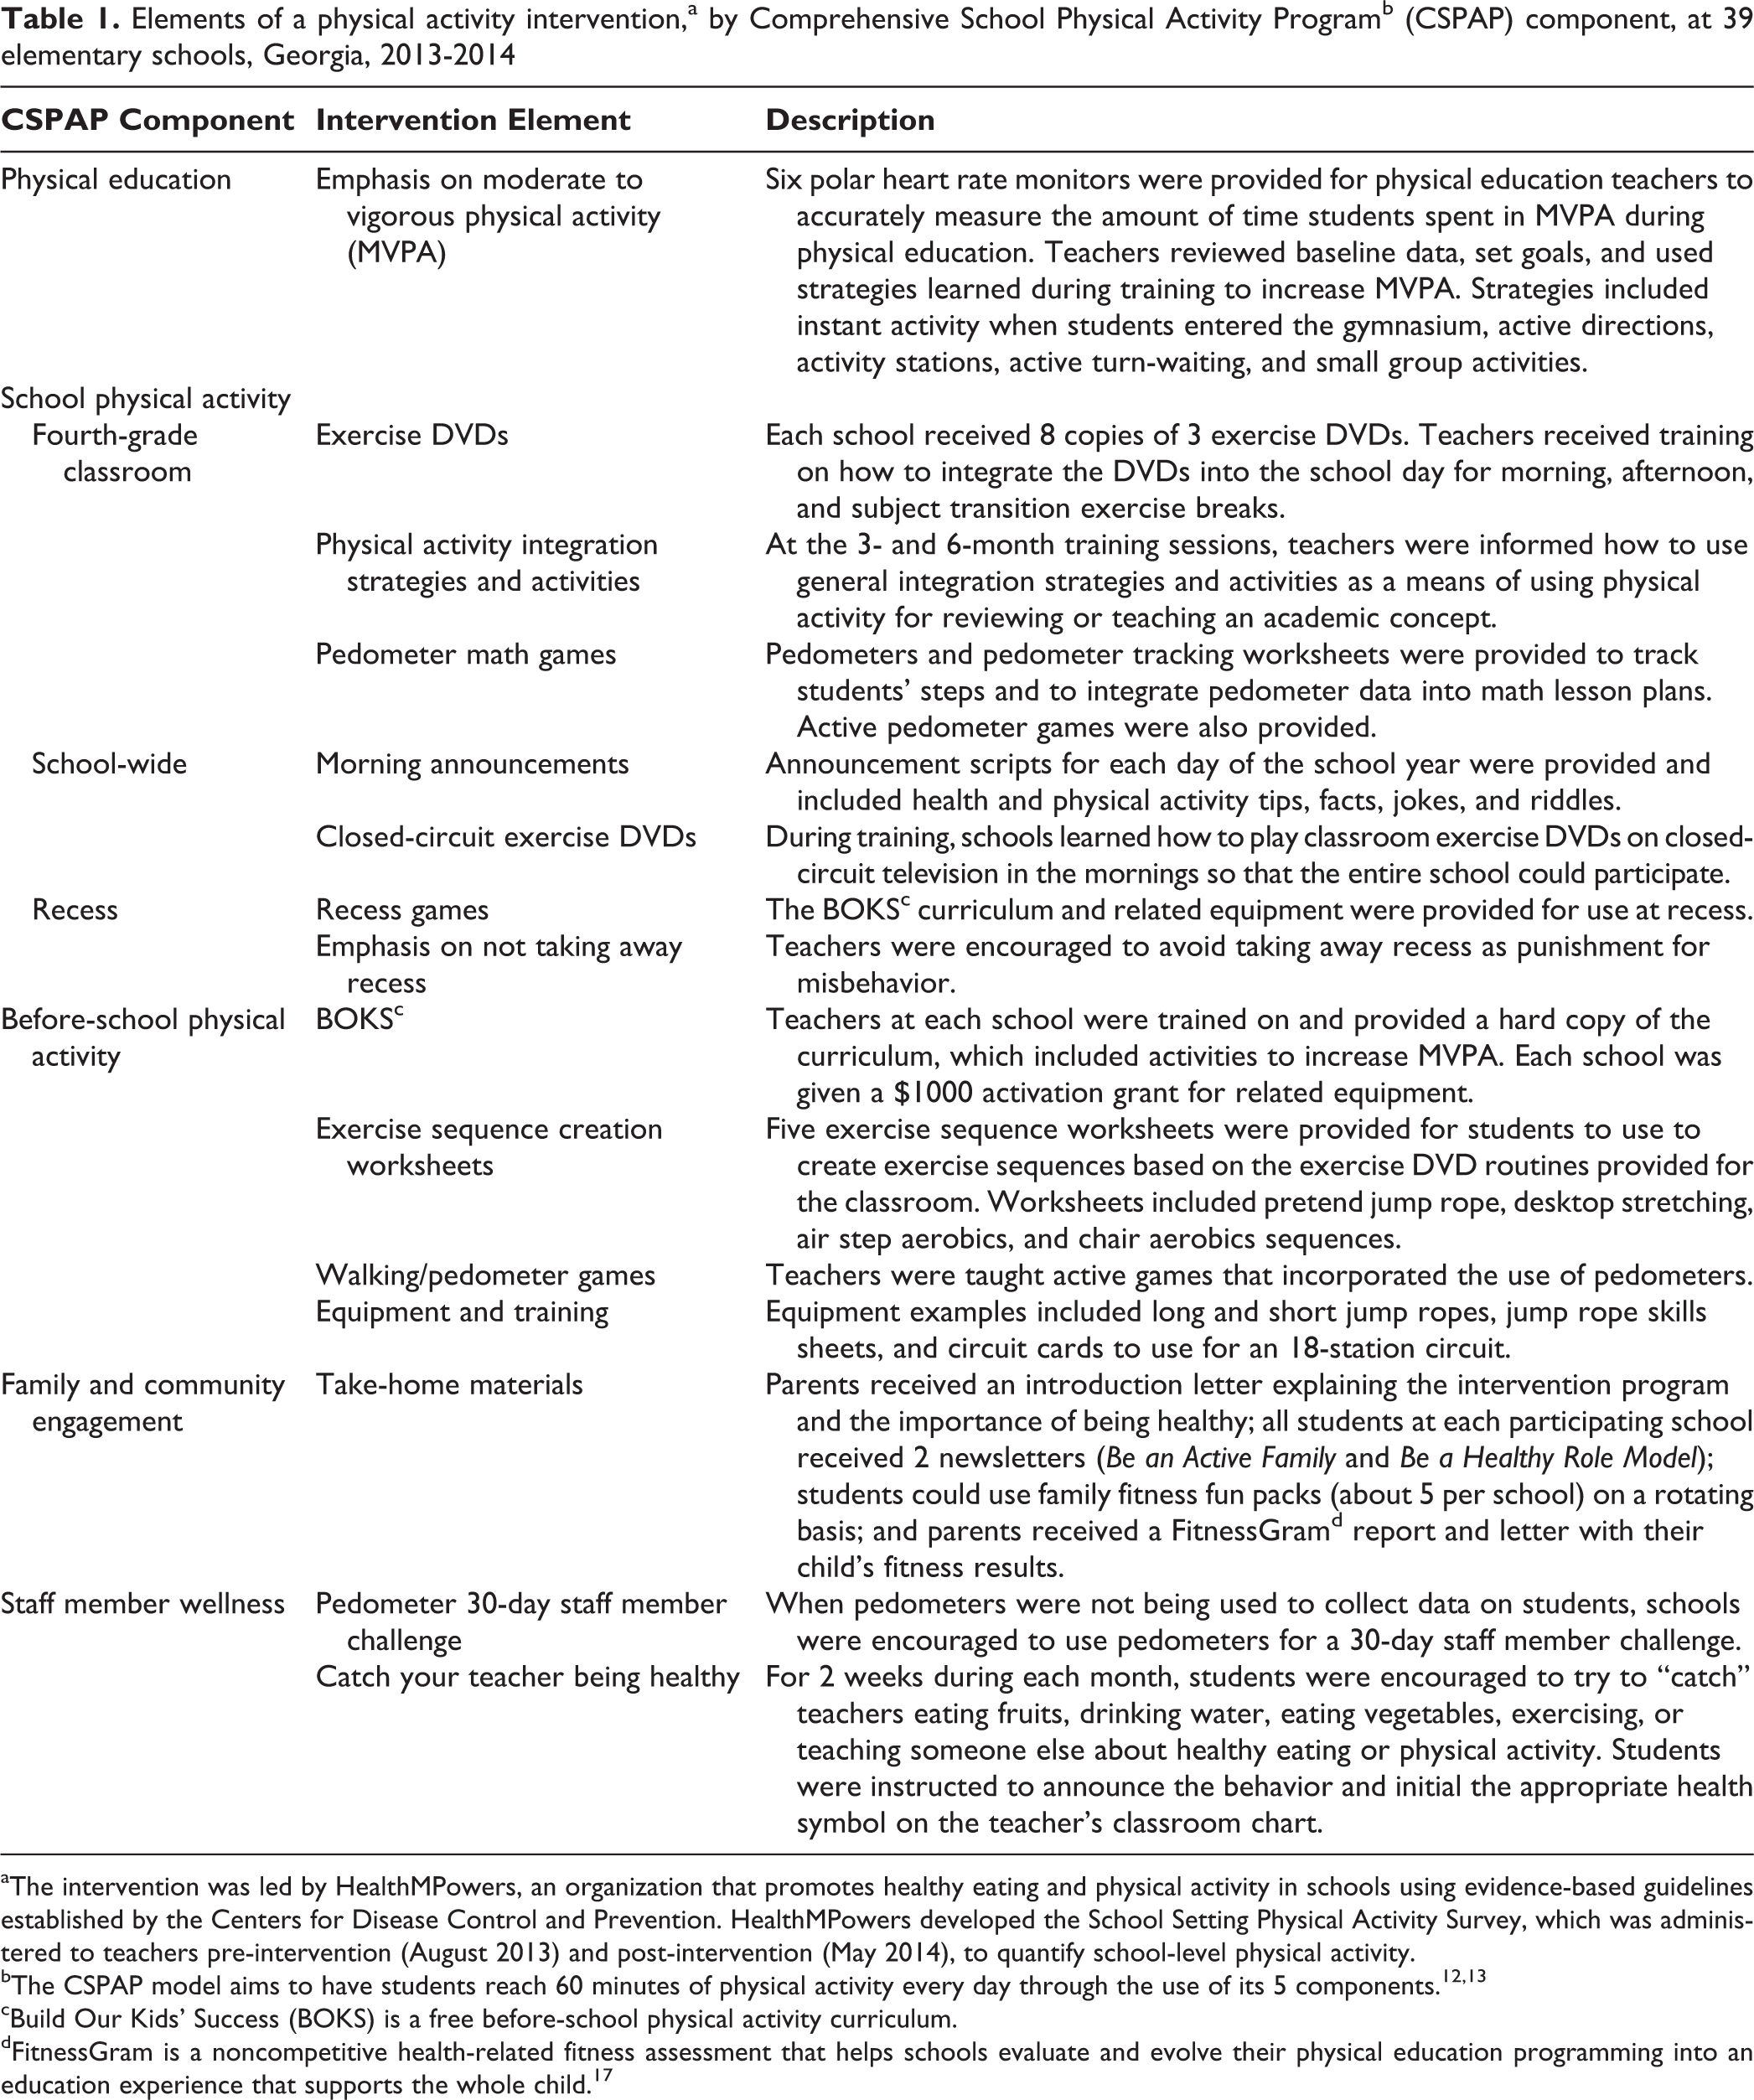
aThe intervention was led by HealthMPowers, an organization that promotes healthy eating and physical activity in schools using evidence-based guidelines established by the Centers for Disease Control and Prevention. HealthMPowers developed the School Setting Physical Activity Survey, which was administered to teachers pre-intervention (August 2013) and post-intervention (May 2014), to quantify school-level physical activity.
bThe CSPAP model aims to have students reach 60 minutes of physical activity every day through the use of its 5 components. 12,13
cBuild Our Kids’ Success (BOKS) is a free before-school physical activity curriculum.
dFitnessGram is a noncompetitive health-related fitness assessment that helps schools evaluate and evolve their physical education programming into an education experience that supports the whole child. 17
As part of the intervention, equipment (eg, jump ropes with skill sheets, exercise DVDs, pedometers, and morning announcement scripts) were given to each school.
Data Collection and Preparation
School demographic data
We collected both school enrollment figures and free and reduced-price lunch rates from the Georgia Department of Education. 18,19 We placed schools into enrollment categories based on the total number of students enrolled at the school; categories were arranged in 200-student increments. We also divided the schools into socioeconomic categories, using as a proxy the proportion of students receiving free or reduced-price lunches, with categories arranged in 20% increments. We used National Center for Education Statistics Urban-Centric Locale Codes, which describe geographic status based on an urban continuum, to categorize schools as city, suburb, town, or rural. 20
School-level survey data
We administered the School Setting Physical Activity Survey to school staff members pre-intervention (August 2013) and post-intervention (May 2014). (The survey is available from HealthMPowers upon request.) We contacted nonresponders by telephone or email to remind them to complete the survey.
The survey assessed all 5 CSPAP targets, although the analysis in our evaluation focused primarily on the responses concerning the first 3 components: physical education, physical activity during school, and physical activity before and after school. An administrator, physical education teacher, and fourth-grade classroom teacher from each school completed an online version of the survey, and HealthMPowers staff members determined the best response to each question from each school. Fourth-grade classroom teachers reported on recess frequency (0-5 days per week) and duration (0 to ≥30 minutes per session), classroom physical activity duration (0 to ≥16 minutes per day), and parts of the day that physical activity was incorporated into the classroom. Physical education teachers reported on physical education frequency (days per week) and duration (minutes per session) as well as the availability of before- and/or after-school physical activity programs (ie, start, end, between lessons, part of lessons, before/after lunch). Survey response options were in categorical ranges (eg, 20-29, 30-39).
To calculate these categorical survey results, we needed to convert the categorical ranges into single numerical values. We did so by using the midpoint of the range in each category (eg, for the 40- to 49-minute category, we used 44.5 minutes for our calculations). For categories with no upper limit, we used half of the range of the adjacent category (eg, for the ≥50-minute category, the adjacent category was 40-49 minutes, so we used the formula [49-40] / 2 = 4.5; thus, for the ≥50-minute category, we used 54.5 minutes for our calculations).
Once we converted these categorical ranges to single numerical values, we then calculated weekly physical activity time during recess and physical education by multiplying frequency (days per week) by duration (minutes per session). We also calculated weekly classroom physical activity time by multiplying daily minutes of classroom physical activity by 5 (days per week). We then added the weekly physical activity times for recess, physical education, and classroom to estimate total weekly physical activity time. Finally, we subtracted the pre-intervention total weekly physical activity estimates from the post-intervention estimates to determine the changes in weekly physical activity during the intervention.
Student-level fitness data
We assessed student physical fitness before and after the intervention using the Progressive Aerobic Cardiovascular Endurance Run (PACER) component of the FitnessGram assessment, an aerobic capacity test recommended for elementary school-aged children. 15 The PACER test is a multistage shuttle run in which the participant completes a series of 20-meter sprints as the pace is incrementally increased each minute. The test is complete when the student fails to complete the 20-meter lap in the allotted time for 2 attempts. One lap is awarded for each completed 20-meter lap. 21 The Healthy Fitness Zone range for 10-year-old girls is 7 to 41 laps and for 10-year-old boys is 23 to 61 laps. 17
Physical education teachers administered the PACER test and also measured height and weight to calculate BMI (ie, [mass in kg]/[height in m] 2 ) for each student. We compared the height and weight measurements obtained by teachers with those obtained by independent trained reporters and found a difference of only 0.3% between the results, suggesting that the teachers’ measurements were reliable. We also collected data on student demographic characteristics, including date of birth and sex.
Of the 3479 fourth-grade students exposed to the intervention, we collected data on 2880 (83%) students pre-intervention (during September and October) and post-intervention (during May). Of these, we excluded 538 students because of missing information, unspecified sex, or incomplete alternate aerobic capacity test, leaving 2342 (67%) students from 34 schools who had complete PACER data that we could use for our analysis.
Student age, height, weight, and sex were required to calculate BMI percentiles based on CDC-specific growth charts. BMI percentiles were categorized as underweight (BMI <5th percentile), normal weight (BMI 5th to <85th percentile), overweight (BMI 85th to <95th percentile), and obese (BMI ≥95th percentile). 22 We excluded 356 students because of implausible height or weight data (ie, BMI <10 or >50 kg/m2), unspecified sex, unspecified date of birth, or implausible pre- to post-intervention percentile changes (eg, change exceeded ±3 standard deviations [SDs]). As a result, 2524 of the 2880 (73%) students with complete PACER data from 36 schools had complete BMI data that we could use for our analysis.
Statistical Methods
We reported descriptive statistics (frequency and percentage of schools) for school enrollment, geographic categorization, and SES (free and reduced-price lunch).
We determined the weekly teacher-reported total number of physical education, recess, and classroom physical activity minutes for each of the 39 schools pre- and post-intervention. We combined these results and reported single pre- and post-intervention means and SDs for total, physical education, recess, and classroom physical activity minutes for all schools. We then calculated the changes in these physical activity times (from pre-intervention to post-intervention) and the frequency and percentage of schools that increased, maintained, or decreased physical activity during this period. We also reported descriptive statistics (ie, frequency and percentage of schools falling into various categorical ranges) for the teacher-reported time in physical activity during recess, in the classroom, during physical education, and before or after school.
We calculated pre- and post-intervention means and SDs for the PACER laps, BMIs, and BMI percentiles for all students with complete data. We then calculated the changes in PACER laps, BMIs, and BMI percentiles (from pre-intervention to post-intervention) and the frequency and percentage of students who increased, maintained, or decreased fitness using these measures.
We assessed whether school-level changes in teacher-reported school-based physical activity times were associated with school-level changes in student PACER laps. To determine the changes in school-level PACER laps, we calculated the mean change in student PACER laps for each school. We grouped the teacher-reported time in physical activity into categorical ranges; to prepare the data for linear regression, we converted the categorical data to continuous data using the bootstrap methodology. 23 We first assumed that the physical activity minutes-per-time range would be uniformly distributed during the reported range (eg, actual minutes within the 40- to 49-minute range were between 40 and 49 minutes, with the real time being any possible value in that range). We then simulated estimated “actual minutes” within that range. To account for estimating a continuous variable from categorical data, we replicated our simulation 1000 times. We ran a linear regression analysis on each of the 1000 iterations of the change in teacher-reported school-based physical activity and change in school-level PACER laps. We reported the mean correlation coefficient of the 1000 iterations and the 95% CI. We used SAS version 9.4 for all statistical analyses. 24
Results
Of the 39 schools, 23 (59%) had 401 to 600 students, 6 (15%) had 200 to 400 students, 7 (18%) had 601 to 800 students, and 3 (8%) had ≥801 students. Sixteen schools were in a city, 14 were rural, 6 were in a suburb, and 3 were in a town. Thirty-one schools had ≥61% of their students receiving free or reduced-price lunch (Table 2).
Demographic characteristics of 39 elementary schools involved in a physical activity intervention, Georgia, 2013-2014a
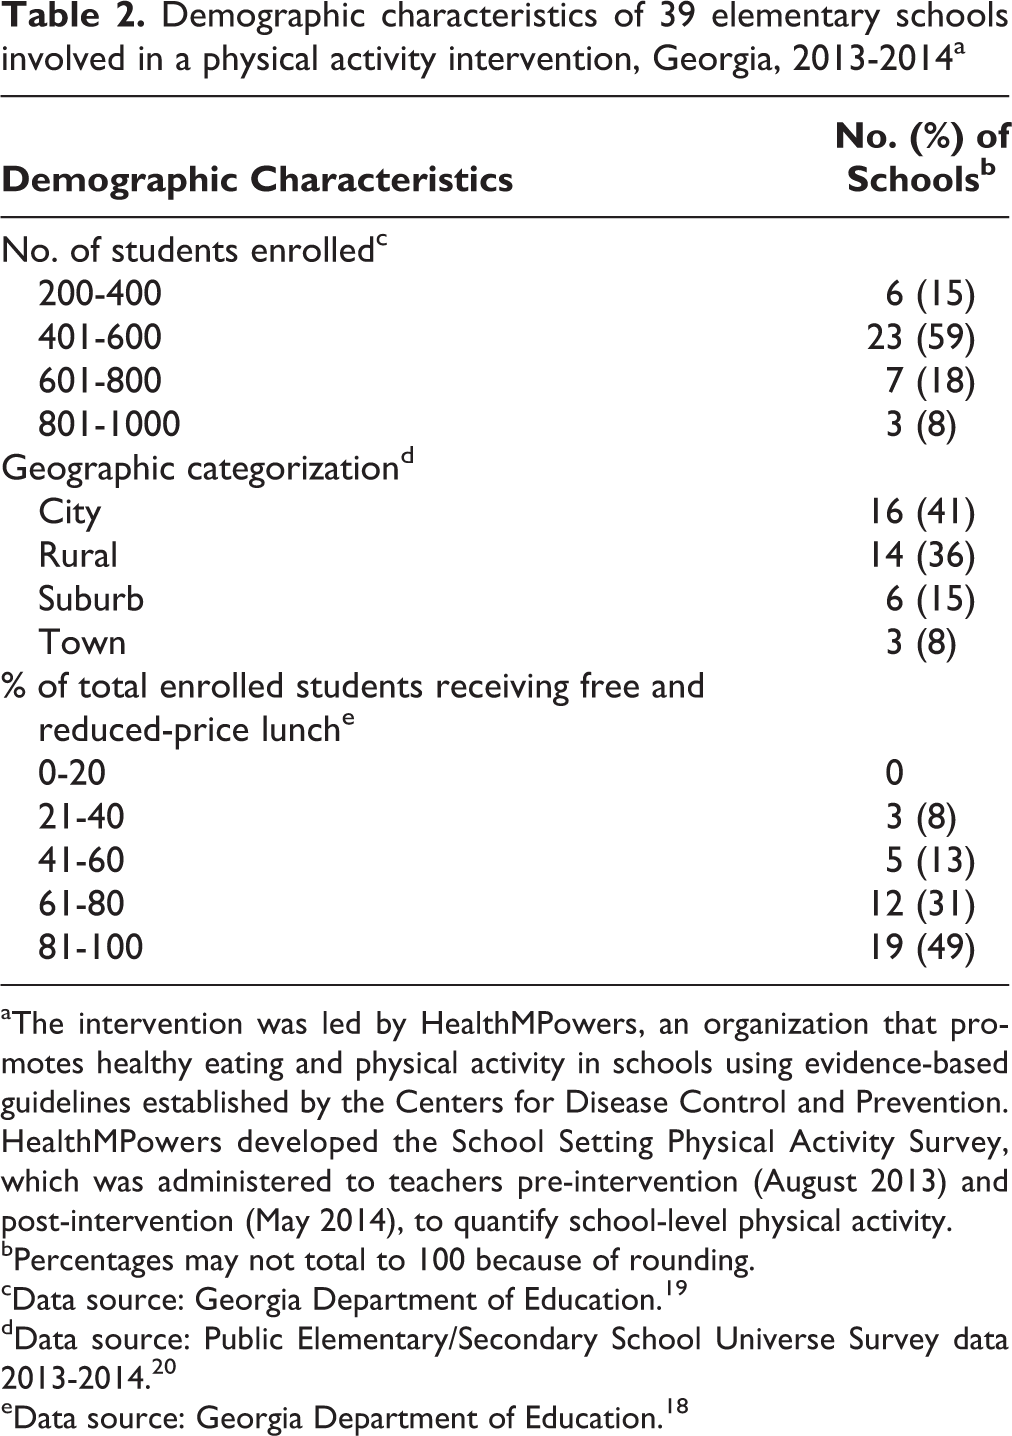
aThe intervention was led by HealthMPowers, an organization that promotes healthy eating and physical activity in schools using evidence-based guidelines established by the Centers for Disease Control and Prevention. HealthMPowers developed the School Setting Physical Activity Survey, which was administered to teachers pre-intervention (August 2013) and post-intervention (May 2014), to quantify school-level physical activity.
bPercentages may not total to 100 because of rounding.
cData source: Georgia Department of Education. 19
dData source: Public Elementary/Secondary School Universe Survey data 2013-2014. 20
eData source: Georgia Department of Education. 18
The mean estimated total weekly teacher-reported time in physical activity increased by 39 minutes from pre- to post-intervention, including by 21 minutes in recess, 17 minutes in the classroom, and 1 minute in physical education. Of the 39 schools, 23 (59%) increased, 10 (26%) decreased, and 6 (15%) maintained the mean estimated total teacher-reported time in physical activity. By location of physical activity, 18 (46%) schools reported increased and 8 (21%) reported decreased recess time, 16 (41%) reported increased and 7 (18%) reported decreased classroom physical activity time, and 5 (13%) reported increased and 30 (77%) reported no change in physical education time (Table 3).
School-level estimated weekly time spent in school-based physical activity and changes in school-based physical activity before and after a physical activity interventiona in 39 elementary schools, Georgia, 2013-2014
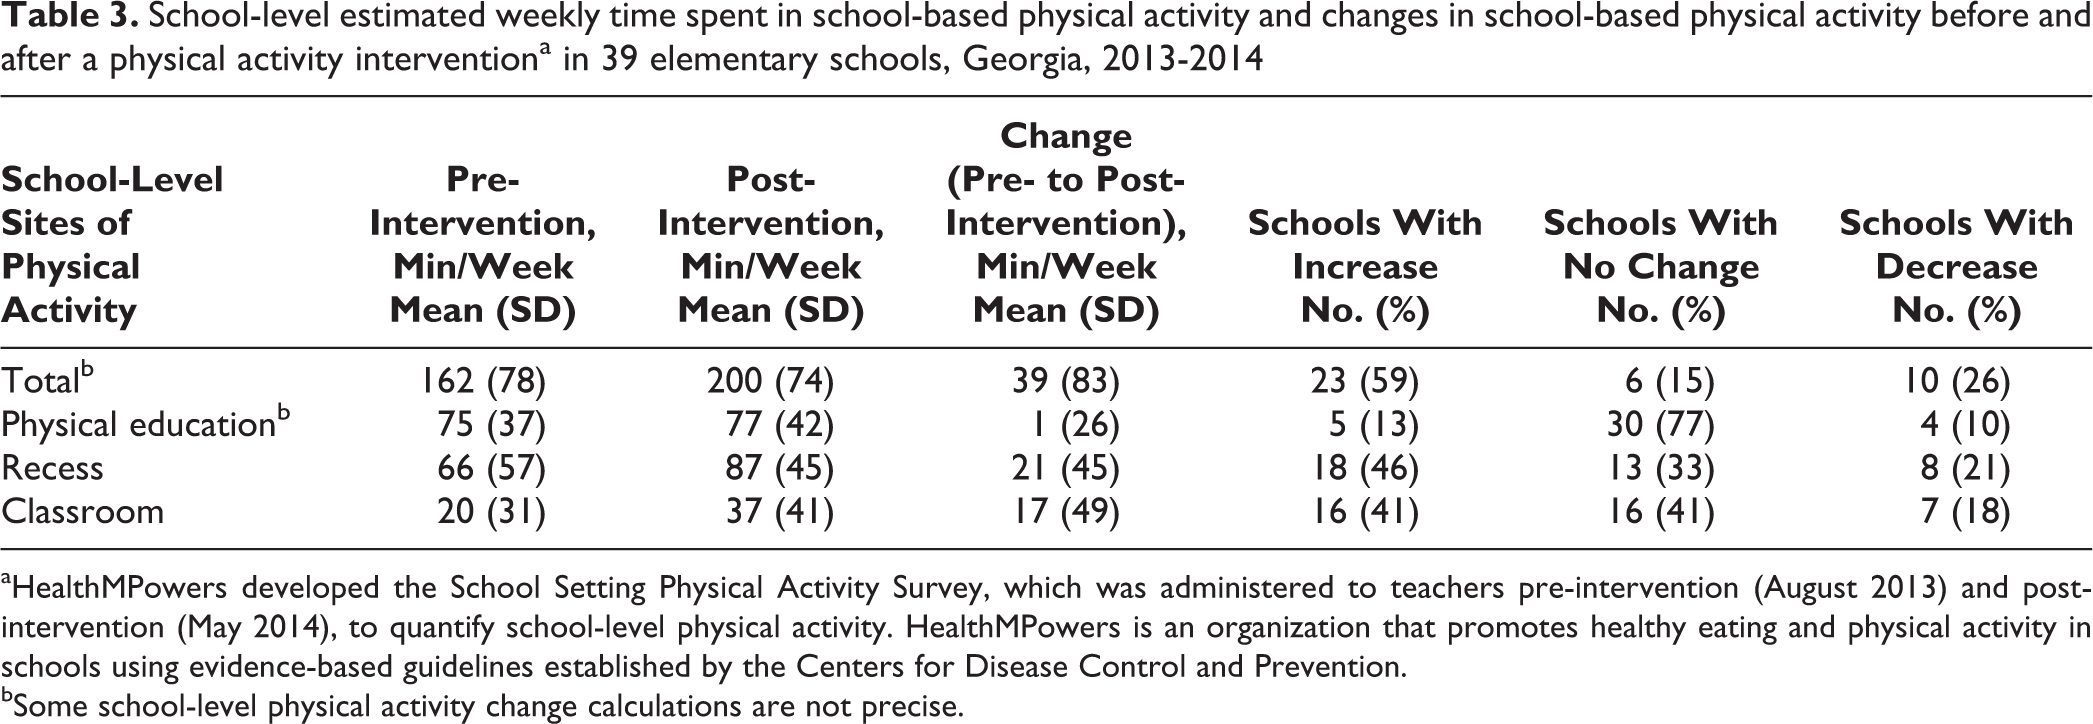
aHealthMPowers developed the School Setting Physical Activity Survey, which was administered to teachers pre-intervention (August 2013) and post-intervention (May 2014), to quantify school-level physical activity. HealthMPowers is an organization that promotes healthy eating and physical activity in schools using evidence-based guidelines established by the Centers for Disease Control and Prevention.
bSome school-level physical activity change calculations are not precise.
The mean number of student-level PACER laps increased from 21 laps pre-intervention to 24 laps post-intervention. Of the 2342 students with complete PACER data, 1515 (65%) increased and 614 (26%) decreased the number of PACER laps completed (Table 4). Of the 2524 students with complete BMI data, the BMI of 1433 (57%) students decreased and of 951 (38%) students increased; however, the overall mean student-level BMI did not change.
School-level estimated changes in PACERa scores and BMI levels before and after a physical activity interventionb in 39 elementary schools, Georgia, 2013-2014
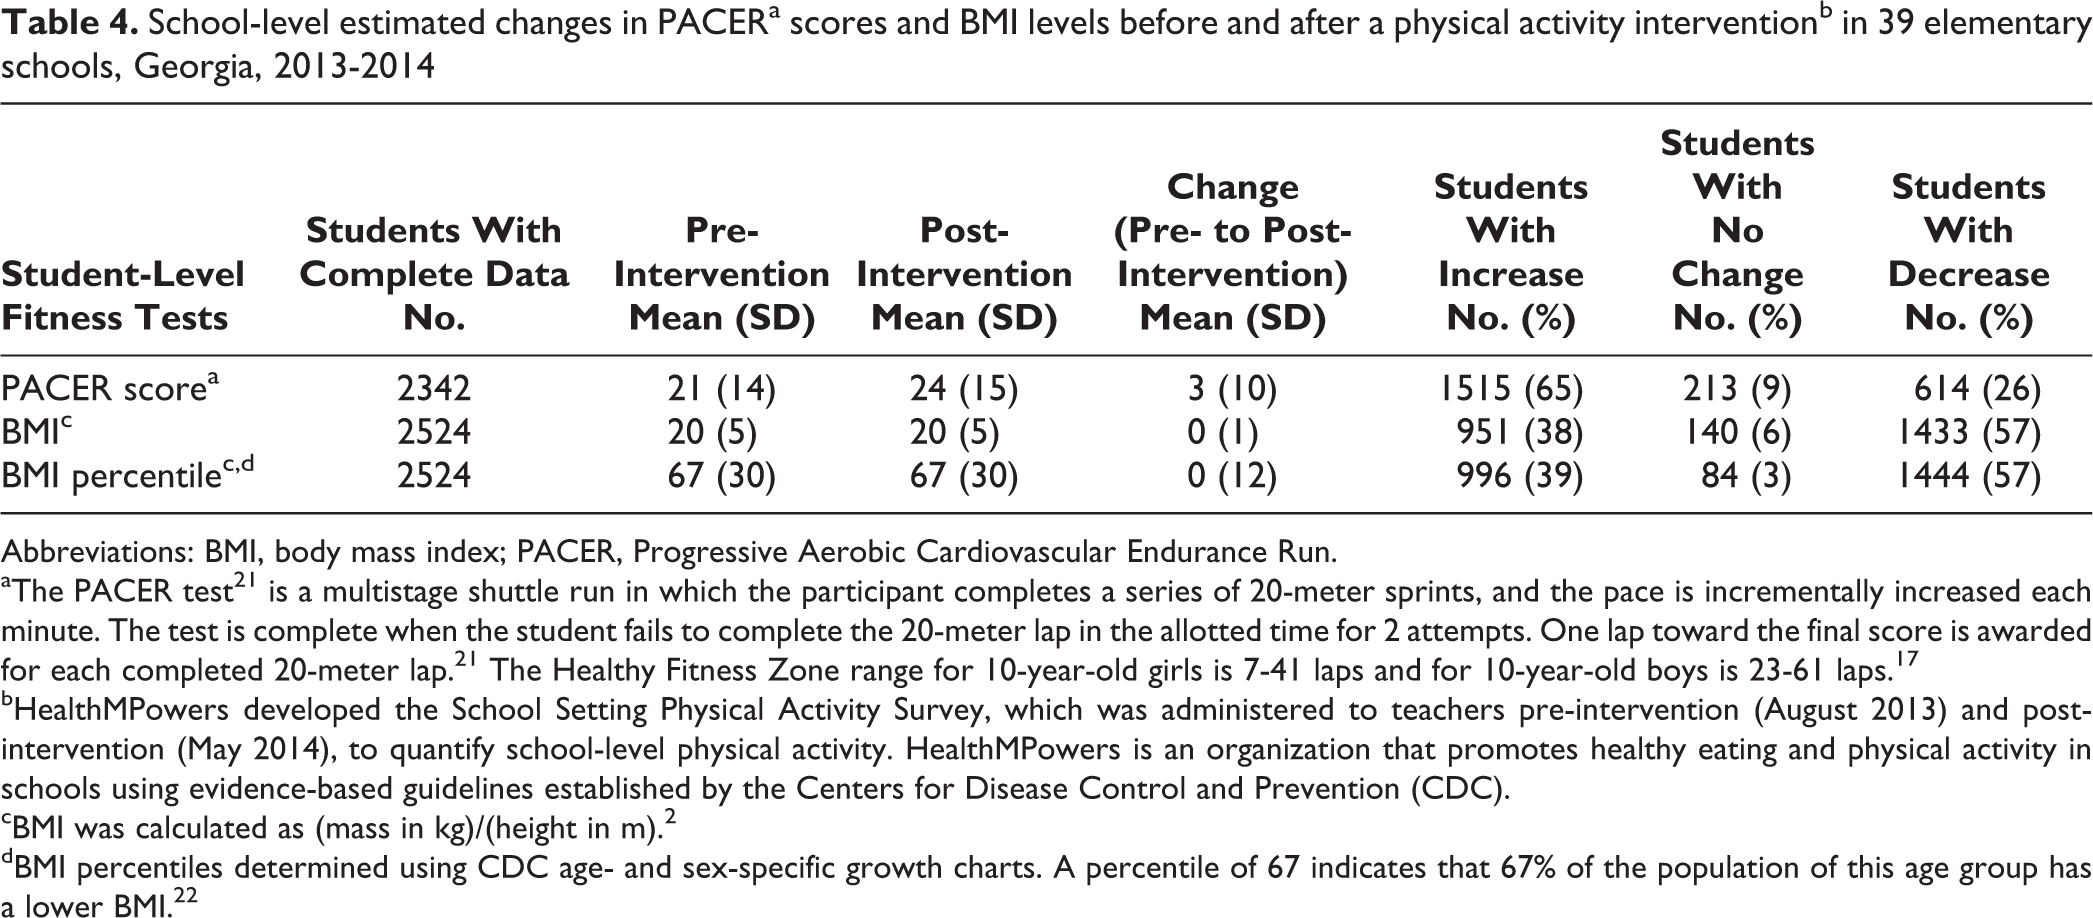
Abbreviations: BMI, body mass index; PACER, Progressive Aerobic Cardiovascular Endurance Run.
aThe PACER test21 is a multistage shuttle run in which the participant completes a series of 20-meter sprints, and the pace is incrementally increased each minute. The test is complete when the student fails to complete the 20-meter lap in the allotted time for 2 attempts. One lap toward the final score is awarded for each completed 20-meter lap.21 The Healthy Fitness Zone range for 10-year-old girls is 7-41 laps and for 10-year-old boys is 23-61 laps.17
bHealthMPowers developed the School Setting Physical Activity Survey, which was administered to teachers pre-intervention (August 2013) and post-intervention (May 2014), to quantify school-level physical activity. HealthMPowers is an organization that promotes healthy eating and physical activity in schools using evidence-based guidelines established by the Centers for Disease Control and Prevention (CDC).
cBMI was calculated as (mass in kg)/(height in m).2
dBMI percentiles determined using CDC age- and sex-specific growth charts. A percentile of 67 indicates that 67% of the population of this age group has a lower BMI.22
In response to the intervention, many schools incorporated classroom physical activity throughout the school day. Notably, 19 (49%) schools added physical activity to the start of the day, and 15 (38%) schools added physical activity between lessons. In addition, the number of schools reporting a before-school program increased from 10 (26%) pre-intervention to 26 (67%) post-intervention, whereas the number of schools reporting an after-school program actually dropped from 14 (36%) to 8 (21%) (Table 5).
School-based physical activity frequency, duration, and program offerings, before and after a physical activity intervention,a in 39 elementary schools, Georgia, 2013-2014
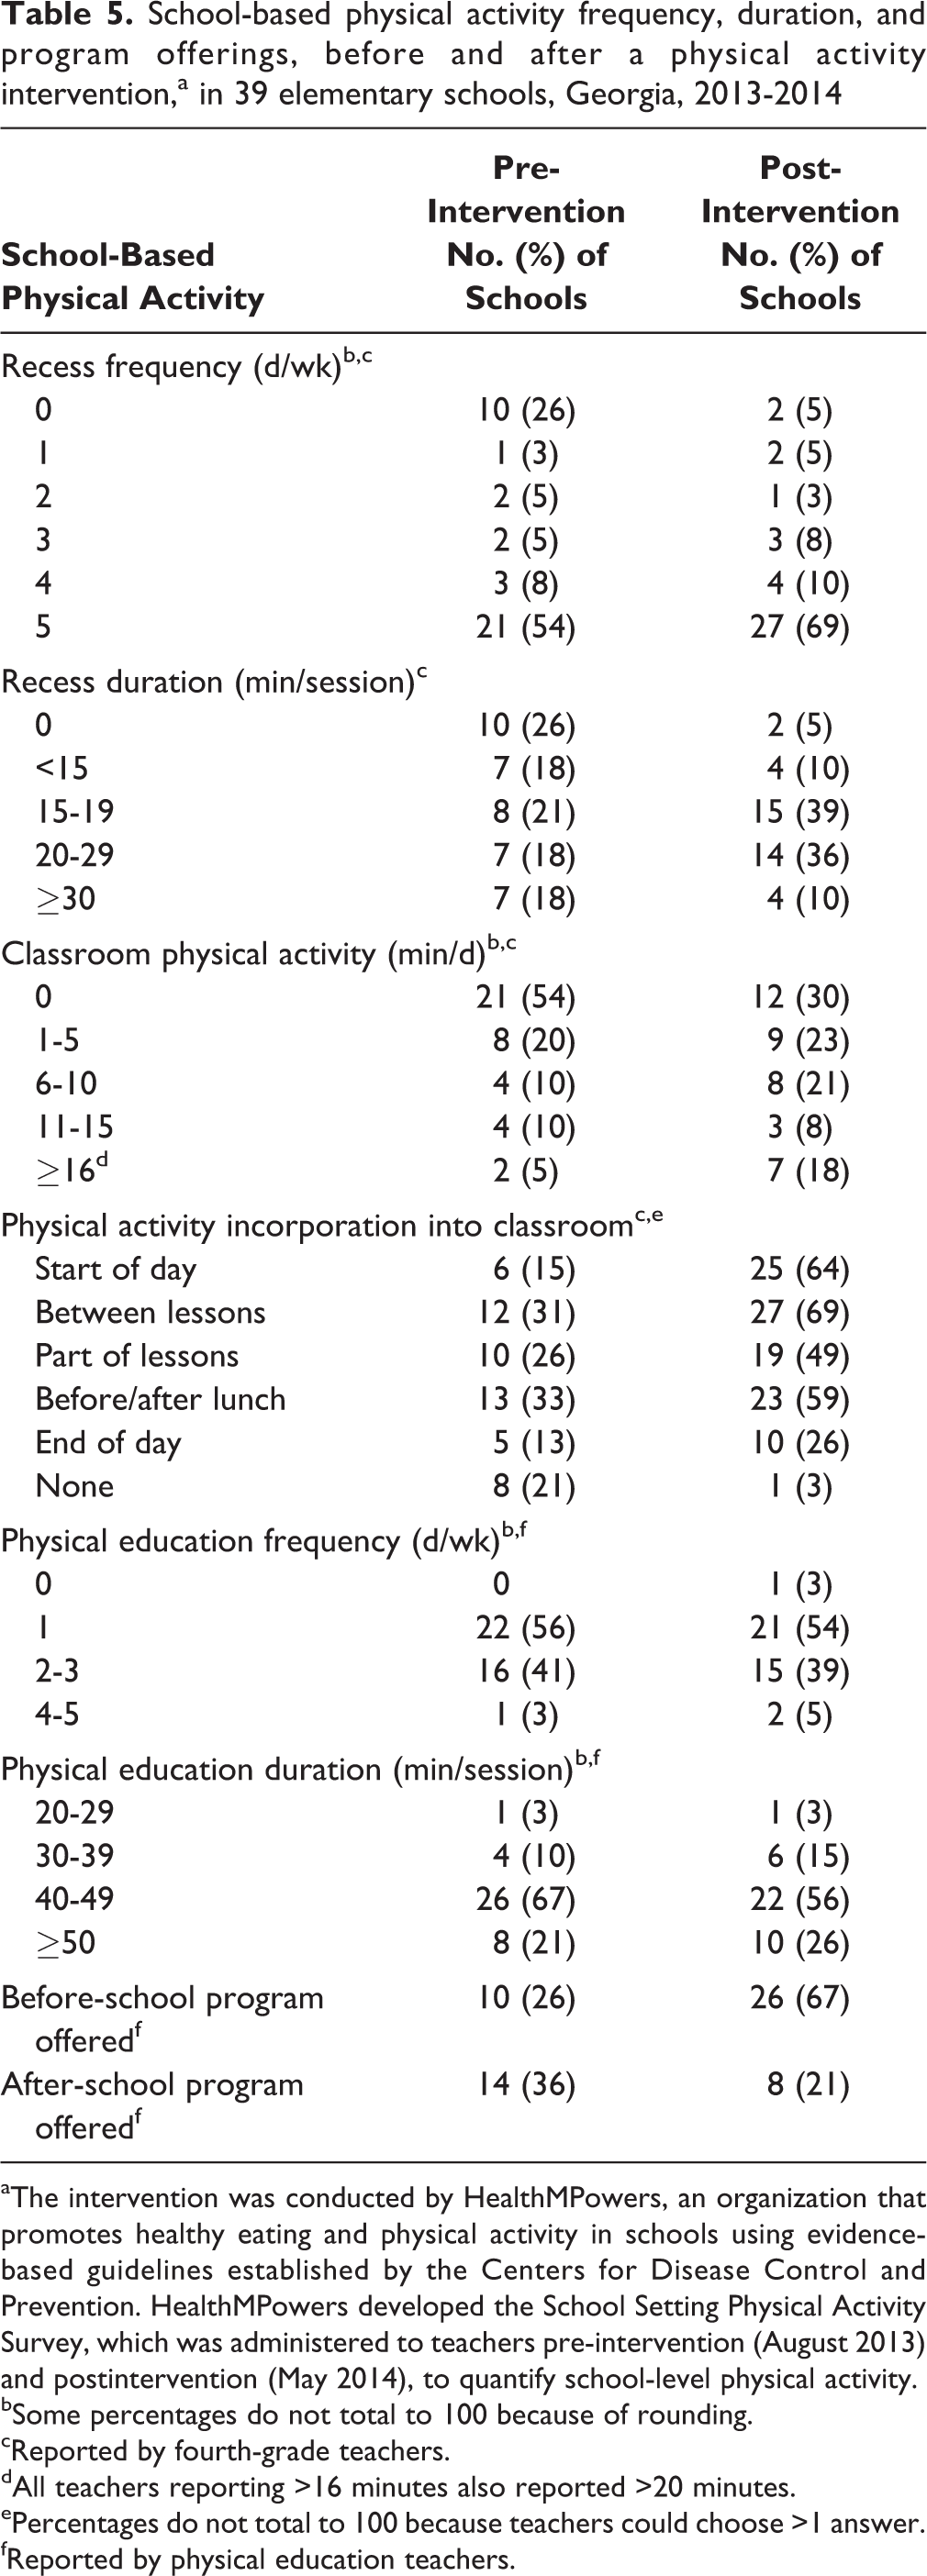
aThe intervention was conducted by HealthMPowers, an organization that promotes healthy eating and physical activity in schools using evidence-based guidelines established by the Centers for Disease Control and Prevention. HealthMPowers developed the School Setting Physical Activity Survey, which was administered to teachers pre-intervention (August 2013) and postintervention (May 2014), to quantify school-level physical activity.
bSome percentages do not total to 100 because of rounding.
cReported by fourth-grade teachers.
dAll teachers reporting >16 minutes also reported >20 minutes.
ePercentages do not total to 100 because teachers could choose >1 answer.
fReported by physical education teachers.
Finally, we identified a positive association between school-level changes in school-based physical activity time and school-level changes in PACER laps as a measure of aerobic capacity (r = 0.38; 95% CI, 0.29-0.46).
Lessons Learned
Implementation of the HealthMPowers program in geographically diverse, socioeconomically challenged schools in Georgia resulted in school-level increases in teacher-reported school-based physical activity time and student-level increases in aerobic capacity. The school-level increases occurred in total school-based physical activity time as well as in the subsets of recess and classroom physical activity time; however, the SDs of these changes were relatively large. Nevertheless, these positive school-level changes in total school-based physical activity time were associated with improvements in school-level PACER laps, suggesting that children who were offered more school-based physical activity tended to have improved aerobic capacity. Taken together, these results appear to support the use of multicomponent school-based physical activity interventions for children to increase their physical activity and improve their physical fitness.
We observed an increase in before-school physical activity programs and a decrease in after-school physical activity programs. Many children in these schools arrived early to school, and we speculate that before-school programs represented an untapped opportunity in many of these schools. It is likely that, with new resources for before-school programs, some schools switched from after-school to before-school programs. On a related note, we observed increases in recess and classroom physical activity times but no substantial changes in physical activity times during physical education. Classroom teachers may have had the ability to modify their schedules to provide more opportunities for physical activity during recess and classroom times but not during physical education. The intervention also did not focus directly on increasing physical education time but instead on increasing the amount of physical activity during physical education class that was at moderate to vigorous levels. These findings suggest that increasing physical education time might require structural curriculum or schedule changes or the involvement of additional faculty members, both of which may be difficult to achieve in many schools.
Student-level PACER scores also improved post-intervention, although the SDs for these changes were relatively large. Consequently, we could only draw limited conclusions when looking solely at the student-level PACER data. However, we did find a positive association between school-level changes in PACER laps and changes in total school-based physical activity times, suggesting that children who were offered more school-based physical activity tended to improve their aerobic capacity. Using another measure of fitness, we found that BMIs and BMI percentiles decreased in more than half of students post-intervention. However, the mean BMI and BMI percentile for the group as a whole did not change substantially as a result of the intervention. This latter result was anticipated, not only because BMI may be influenced by other factors (eg, diet) but also because nonobese students (for whom BMI was not expected to change) were included in the evaluation. 16
Strengths and Limitations
This study had several strengths. First, although our analysis of post-intervention changes primarily focused on only 3 components, the intervention involved all 5 components of the CSPAP model. This intervention may be unique, given that a systematic review and meta-analysis of CSPAP-modeled interventions to increase physical activity reported that none of the 14 studies analyzed had implemented all 5 components in their interventions. 11 Second, it included a large number of schools with low SES across urban and rural settings. Socioeconomically challenged neighborhoods tend to have less access to physical activity opportunities and disproportionately higher risks for negative health outcomes compared with schools in more affluent neighborhoods. 5,6 Yet, despite these barriers confronted by low-SES school districts, we found that increases in school-based physical activity and student aerobic capacity could be achieved with a multicomponent intervention.
This evaluation also had several limitations. First, the study had no general population control group, so we were unable to mitigate the risk of historical bias, which could have occurred during the intervention period in the form of other interventions or initiatives outside of the HealthMPowers intervention. Second, given that this intervention involved a single group, we were unable to rule out the possibility of regression to the mean, which may have affected some of our results. Third, the survey used in the intervention had not previously been validated; as such, we could not assess how well the survey actually measured what it was purported to measure. Fourth, we were unable to objectively assess how the components of the intervention were implemented at each school, thereby introducing the possibility of variability among schools, which may have affected our results. Finally, we were unable to account for other sports or activities, which may have affected changes in student aerobic capacity during the intervention.
Conclusions
We found improvements in school-based physical activity and student aerobic capacity after the use of a CSPAP-modeled physical activity intervention in students at geographically diverse, socioeconomically challenged elementary schools in Georgia. These findings in a relatively small population of students highlight the need for more prospective research into multicomponent physical activity interventions. Rigorous testing, including randomized controlled trials of large-scale implementations, is needed to examine how these school-based interventions might be used to increase the physical activity and improve the physical fitness of larger populations of children.
Footnotes
Acknowledgments
The authors thank the Blue Cross Blue Shield of Georgia Foundation for its support; HealthMPowers, Kate Hovan, and Gigi O’Shea for implementing the intervention; and Mike Metzler and Andy Doyle for collecting and evaluating data.
Declaration of Conflicting Interests
The author(s) declared no potential conflicts of interest with respect to the research, authorship, and/or publication of this article.
Funding
The author(s) disclosed receipt of the following financial support for the research, authorship, and/or publication of this article: Blue Cross Blue Shield of Georgia Foundation provided funding for implementation of the intervention.