
Abstract
Objectives:
Policies that increase household income, such as the earned income tax credit (EITC), have shown reductions on risk factors for child maltreatment (ie, poverty, maternal stress, depression), but evidence is lacking on whether the EITC actually reduces child maltreatment. We examined whether states’ EITCs are associated with state rates of hospital admissions for abusive head trauma among children aged <2 years.
Methods:
We conducted difference-in-difference analyses (ie, pre- and postdifferences in intervention vs control groups) of annual rates of states’ hospital admissions attributed to abusive head trauma among children aged <2 years (ie, using aggregate data). We conducted analyses in 14 states with, and 13 states without, an EITC from 1995 to 2013, differentiating refundable EITCs (ie, tax filer gets money even if taxes are not owed) from nonrefundable EITCs (ie, tax filer gets credit only for any tax owed), controlling for state rates of child poverty, unemployment, high school graduation, and percentage of non-Latino white people.
Results:
A refundable EITC was associated with a decrease of 3.1 abusive head trauma admissions per 100 000 population in children aged <2 years after controlling for confounders (P = .08), but a nonrefundable EITC was not associated with a decrease (P = .49). Tax refunds ranged from $108 to $1014 and $165 to $1648 for a single parent working full-time at minimum wage with 1 child or 2 children, respectively.
Conclusions:
Our findings with others suggest that policies such as the EITC that increase household income may prevent serious abusive head trauma.
Abusive head trauma (AHT) is a leading form of fatal child maltreatment among young children. 1 Survivors often have serious long-term impairments. Most victims are <2 years of age, with peak incidence occurring between 9 and 20 weeks of age. AHT prevention has primarily focused on providing parents of newborns with information about infant crying and the dangers of violent infant shaking. 2 Although such efforts initially yielded promising results, 3 subsequent evaluation failed to show reductions in AHT incidence. 4
Compared with educational efforts, policies have better potential to reach broader segments of the population and have sustainable impacts on reducing child maltreatment. 5 In particular, socioeconomic policies can address the underlying social determinants of health (or fundamental causes) of abuse. 6 For example, policies that increase household income, such as the earned income tax credit (EITC), have led to reductions in risk factors for child maltreatment (ie, poverty, maternal stress, depression), but evidence is lacking on whether the EITC actually reduces child maltreatment. 7 Policies that increase household income might reduce child maltreatment by improving parents’ ability to provide children’s basic needs (eg, food, shelter, medical care) and pay for adequate child care, thereby improving parents’ health or behaviors, reducing the mental strain of survival, and improving family relations. In turn, these policies may support parents’ capacity to engage in nurturing parenting behaviors.
The federal EITC, introduced in 1975, provides income support to low-income workers, especially those with children, and has been shown to increase employment, especially among single parents, and reduce poverty among the working poor. 8 Twenty-six states and the District of Columbia have enacted their own EITCs; they vary in their funding amounts and whether or not they are refundable. 9
In addition to reducing poverty among working families, 8 the EITC is associated with reductions in infant mortality 10 and low birth weight, 11,12 reduced rates of maternal smoking during pregnancy, 11,12 reduced maternal stress and mental health problems, 13 increased health insurance coverage, 10,14 improvements in the home environment, 15,16 improved school performance 17 and behavior, 15,16 and reductions in accidents and unintentional injuries among children. 15 Although 1 study found no associations between states’ EITCs and child maltreatment, the researchers acknowledged that shifts in definitions may have decreased the reliability of the data used as their outcome (National Child Abuse and Neglect Data System). 18 We used an alternative data source—hospital admissions for nonfatal AHT among children aged <2 years—to examine the association between EITCs and child abuse. We hypothesized that EITC would be associated with reductions in AHT rates, given its association with reductions in maternal stress and mental health problems, which are known risk factors of child abuse. 19
Methods
We constructed a state-level panel data set and conducted difference-in-difference analyses of states’ annual data (ie, aggregate data) among states with and without a state EITC from 1995 to 2013. Difference-in-difference analyses compare the mean change in an outcome in the intervention group before and after a policy change (first difference) with that in a control group with no policy change (second difference).
Data
For our dependent variable, we used the publicly available State Inpatient Databases (SIDs) from the Healthcare Cost and Utilization Project (HCUP). 20 Data sharing with HCUP is voluntary, and not all states share their data with HCUP. SIDs were available for 14 states with EITCs and 13 states without EITCs. We tabulated annual state rates of AHT per 100 000 children aged <2 years. Our numerator corresponded to cases of nonfatal hospital admissions identified in the SIDs each year among children aged <2 years. We identified cases using the International Classification of Diseases and External Cause of Injury diagnosis codes indicated in the Centers for Disease Control and Prevention definitions for definite and probable AHT. 21 Our denominator was the yearly population of children aged <2 years. 22
We coded our independent variable, the EITC, as “1” in states without the EITC, “2” in states with a nonrefundable EITC (ie, tax filer gets credit only for any tax owed), and “3” in states with a refundable EITC (ie, tax filer gets money even if taxes are not owed). Coding the EITC into these 3 categories allowed us to compare the effects of a nonrefundable EITC and refundable EITC with no EITC. Using the actual amount refunded or saved would not have captured this difference.
States enacted the EITC in different years (Table 1). 23 For example, Arizona did not have an EITC during the study period; Maine did not have an EITC from 1995 to 2000 but had a nonrefundable EITC from 2001 to 2013; and Oregon did not have an EITC from 1995 to 1997 but had a nonrefundable EITC from 1998 to 2006 and a refundable EITC from 2007 to 2013. The varying state schedule of EITC enactment allowed us to conduct the difference-in-difference analysis to investigate the impact of the EITC on AHT admission rates.
Average and range of refunds or tax savings for EITCs (in 2015 dollars) for single parents working full-time at minimum wage with 1 or 2 children, 27 states,a 1995-2013
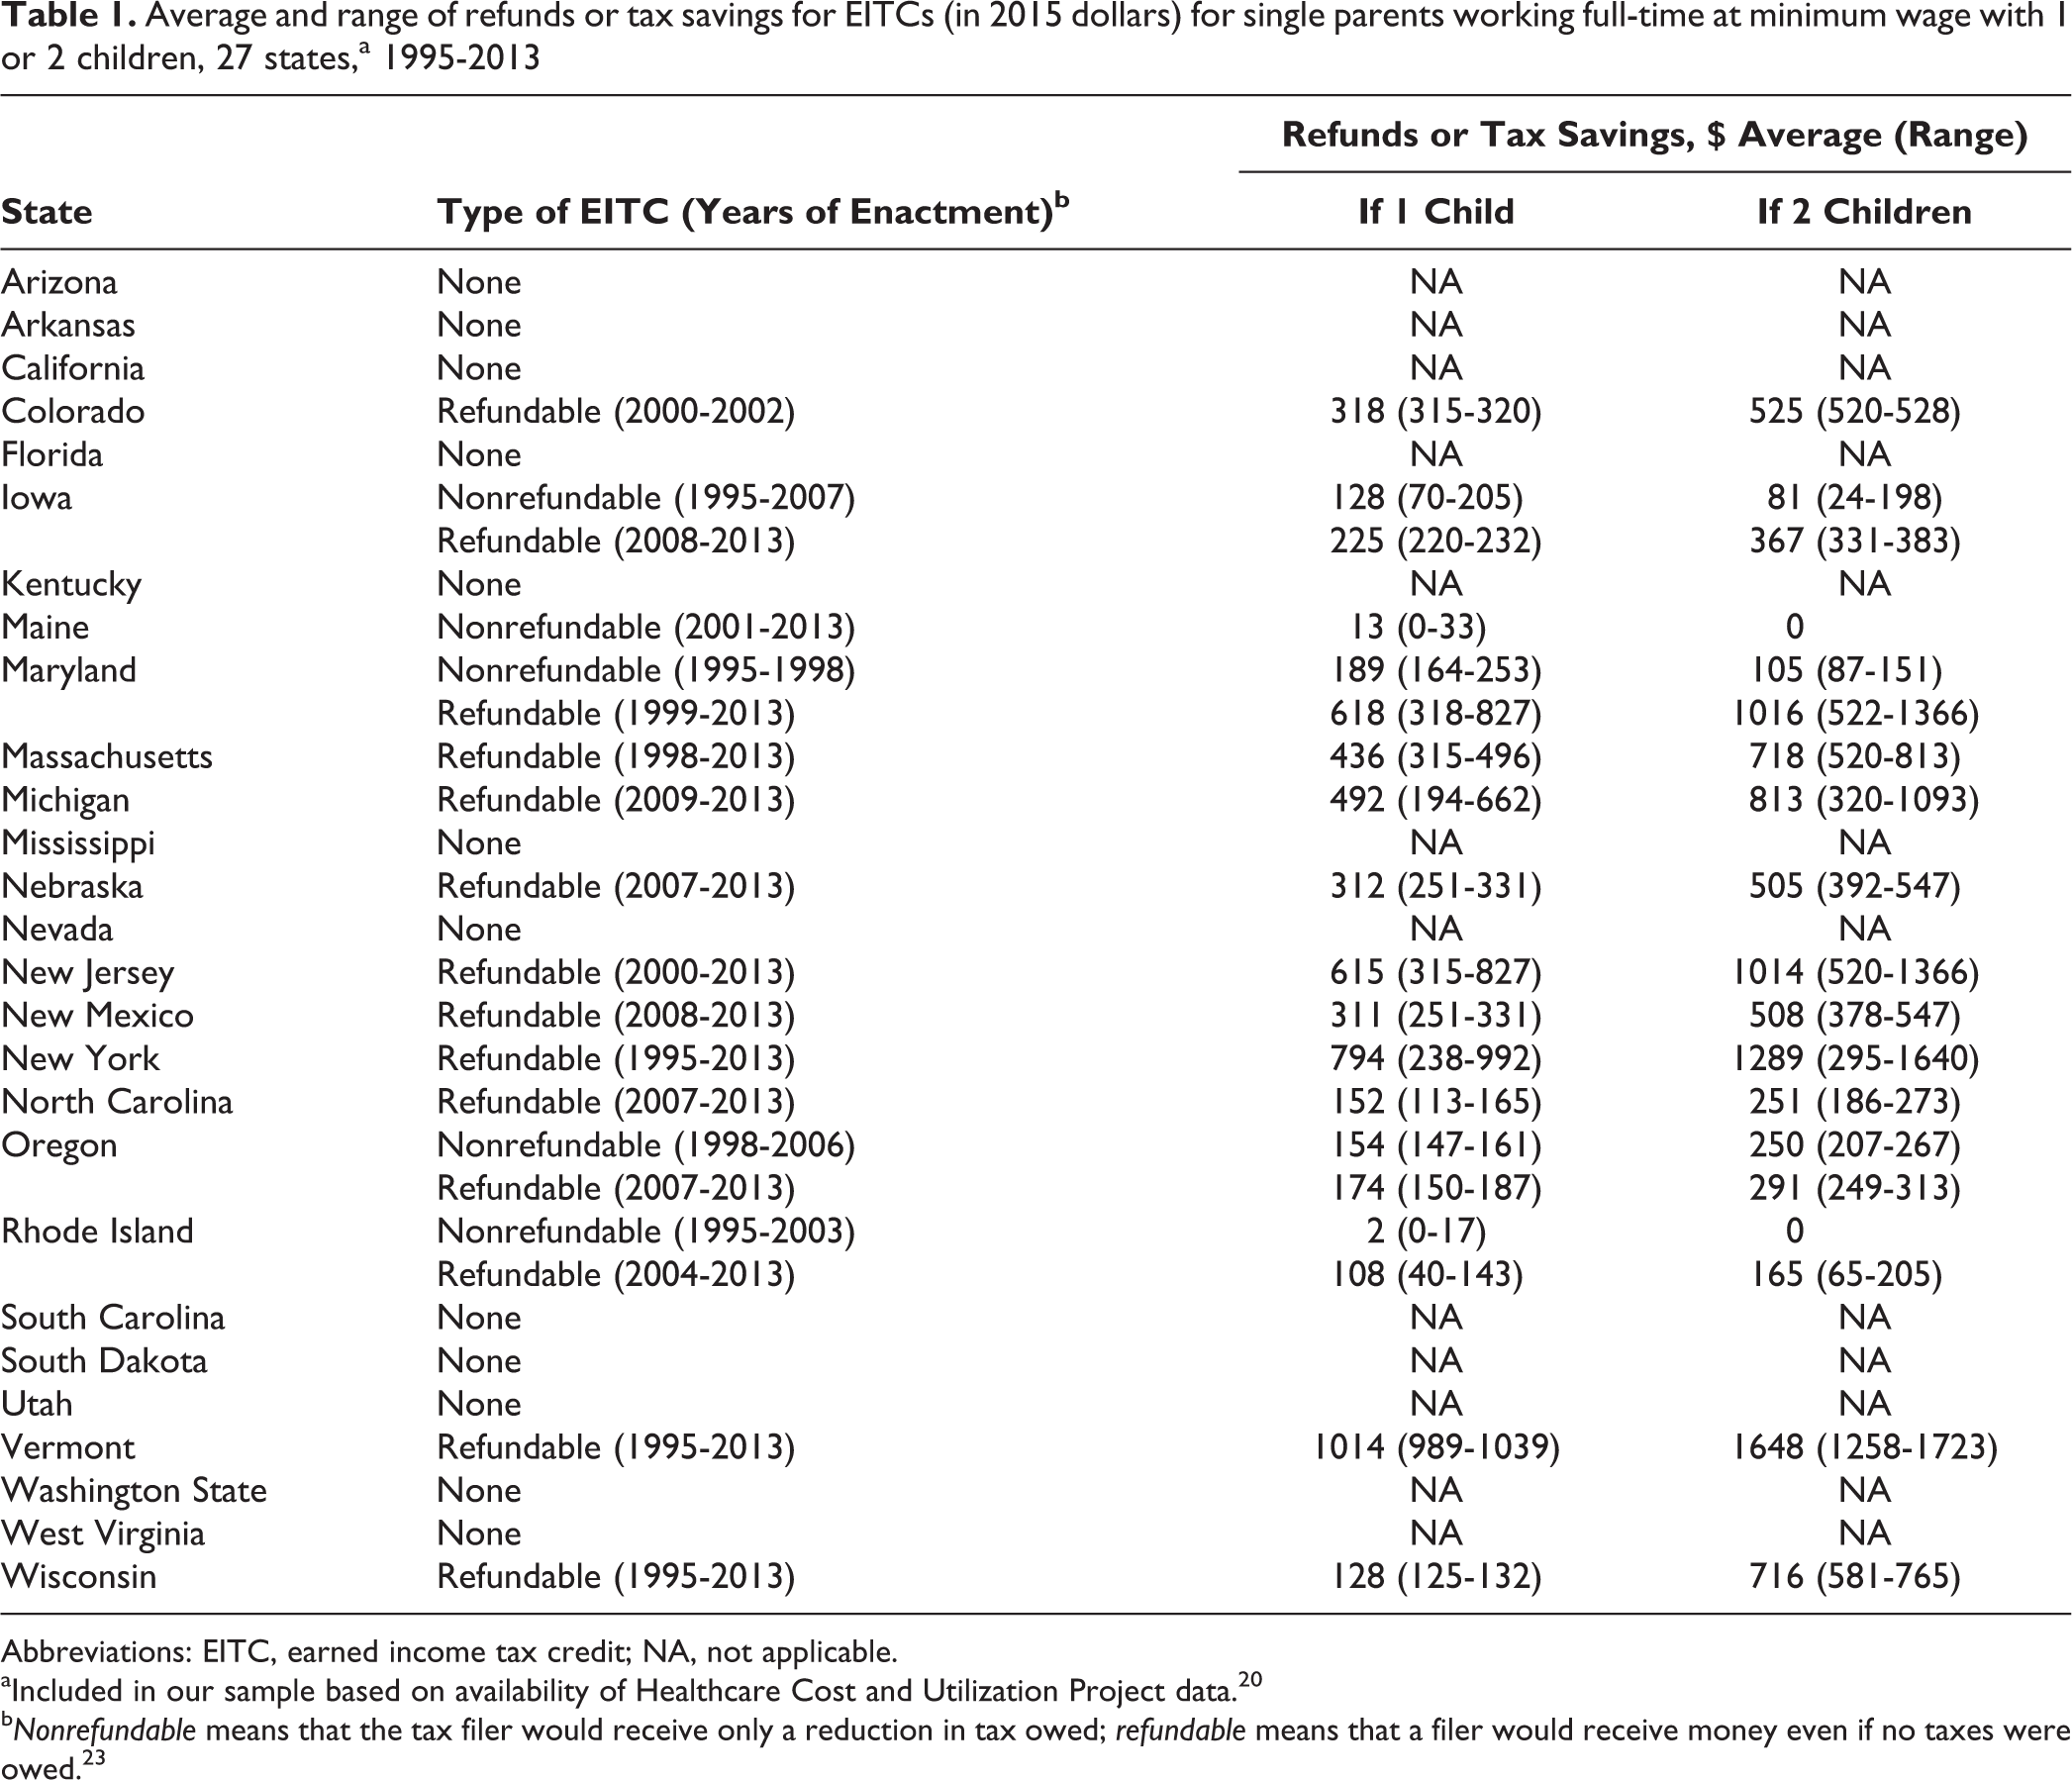
Abbreviations: EITC, earned income tax credit; NA, not applicable.
aIncluded in our sample based on availability of Healthcare Cost and Utilization Project data. 20
bNonrefundable means that the tax filer would receive only a reduction in tax owed; refundable means that a filer would receive money even if no taxes were owed. 23
We also calculated the annual tax refund or savings that a single parent with 1 child and a single parent with 2 children would receive in each state if he or she worked full-time at minimum wage. This calculation allowed us to compare the magnitude of the refund or savings across states while taking into account minimum wage variations across states and time. 24 We converted the refund or savings amount to 2015 US dollars to account for inflation. We chose single parents because the EITC has the greatest impact on single-parent households. 8
Statistical Analysis
The final sample consisted of 380 observations (where an observation was a state-year pair) from 27 states during 1995-2013. This sample was not a strongly balanced panel data set, because not all states had the same years of data included. Overall, states had an average of 14 years of data, an average of 4 years of preintervention data for states with a refundable EITC, and an average of 0.8 years of preintervention data for states with a nonrefundable EITC. We examined the strength and direction of the association between the EITC and AHT in unadjusted and adjusted models. We conducted the difference-in-difference analyses including the state and year dummy variables as fixed effects. In the unadjusted model, we ran ordinary least squares regressions with fixed effects using Stata version 14 25 that included the EITC policy variable, state dummy variables to capture time-invariant state-specific characteristics, and year dummy variables to control for time effects common to all states. In the adjusted model, we added the percentage of non-Latino white population, 26 the percentage of the population aged ≥25 who graduated from high school, 26 the states’ yearly unemployment rate, 27 and child poverty rates 28 as covariates. For unadjusted and adjusted models, we clustered standard errors at the state level. Using a 2-tailed t test, we considered P < .05 to be statistically significant.
Results
The state rates of AHT per 100 000 children aged <2 years ranged from 0 in Utah in 1998 to 67.3 in Rhode Island in 2002 (Table 2). States’ refundable EITC was associated with a decrease of 3.1 AHT admissions per 100 000 children aged <2 years (95% CI, –6.4 to 0.3; P = .07; Table 3). This decrease amounted to a 13% reduction in AHT admissions. After controlling for percentage of non-Latino white population, high school graduation, unemployment rates, and childhood poverty, the results were unchanged. Having a nonrefundable EITC was not associated with AHT admission rates.
Abusive head trauma rates per 100 000 children aged <2 years, by state and year,a 27 states,b 1995-2013
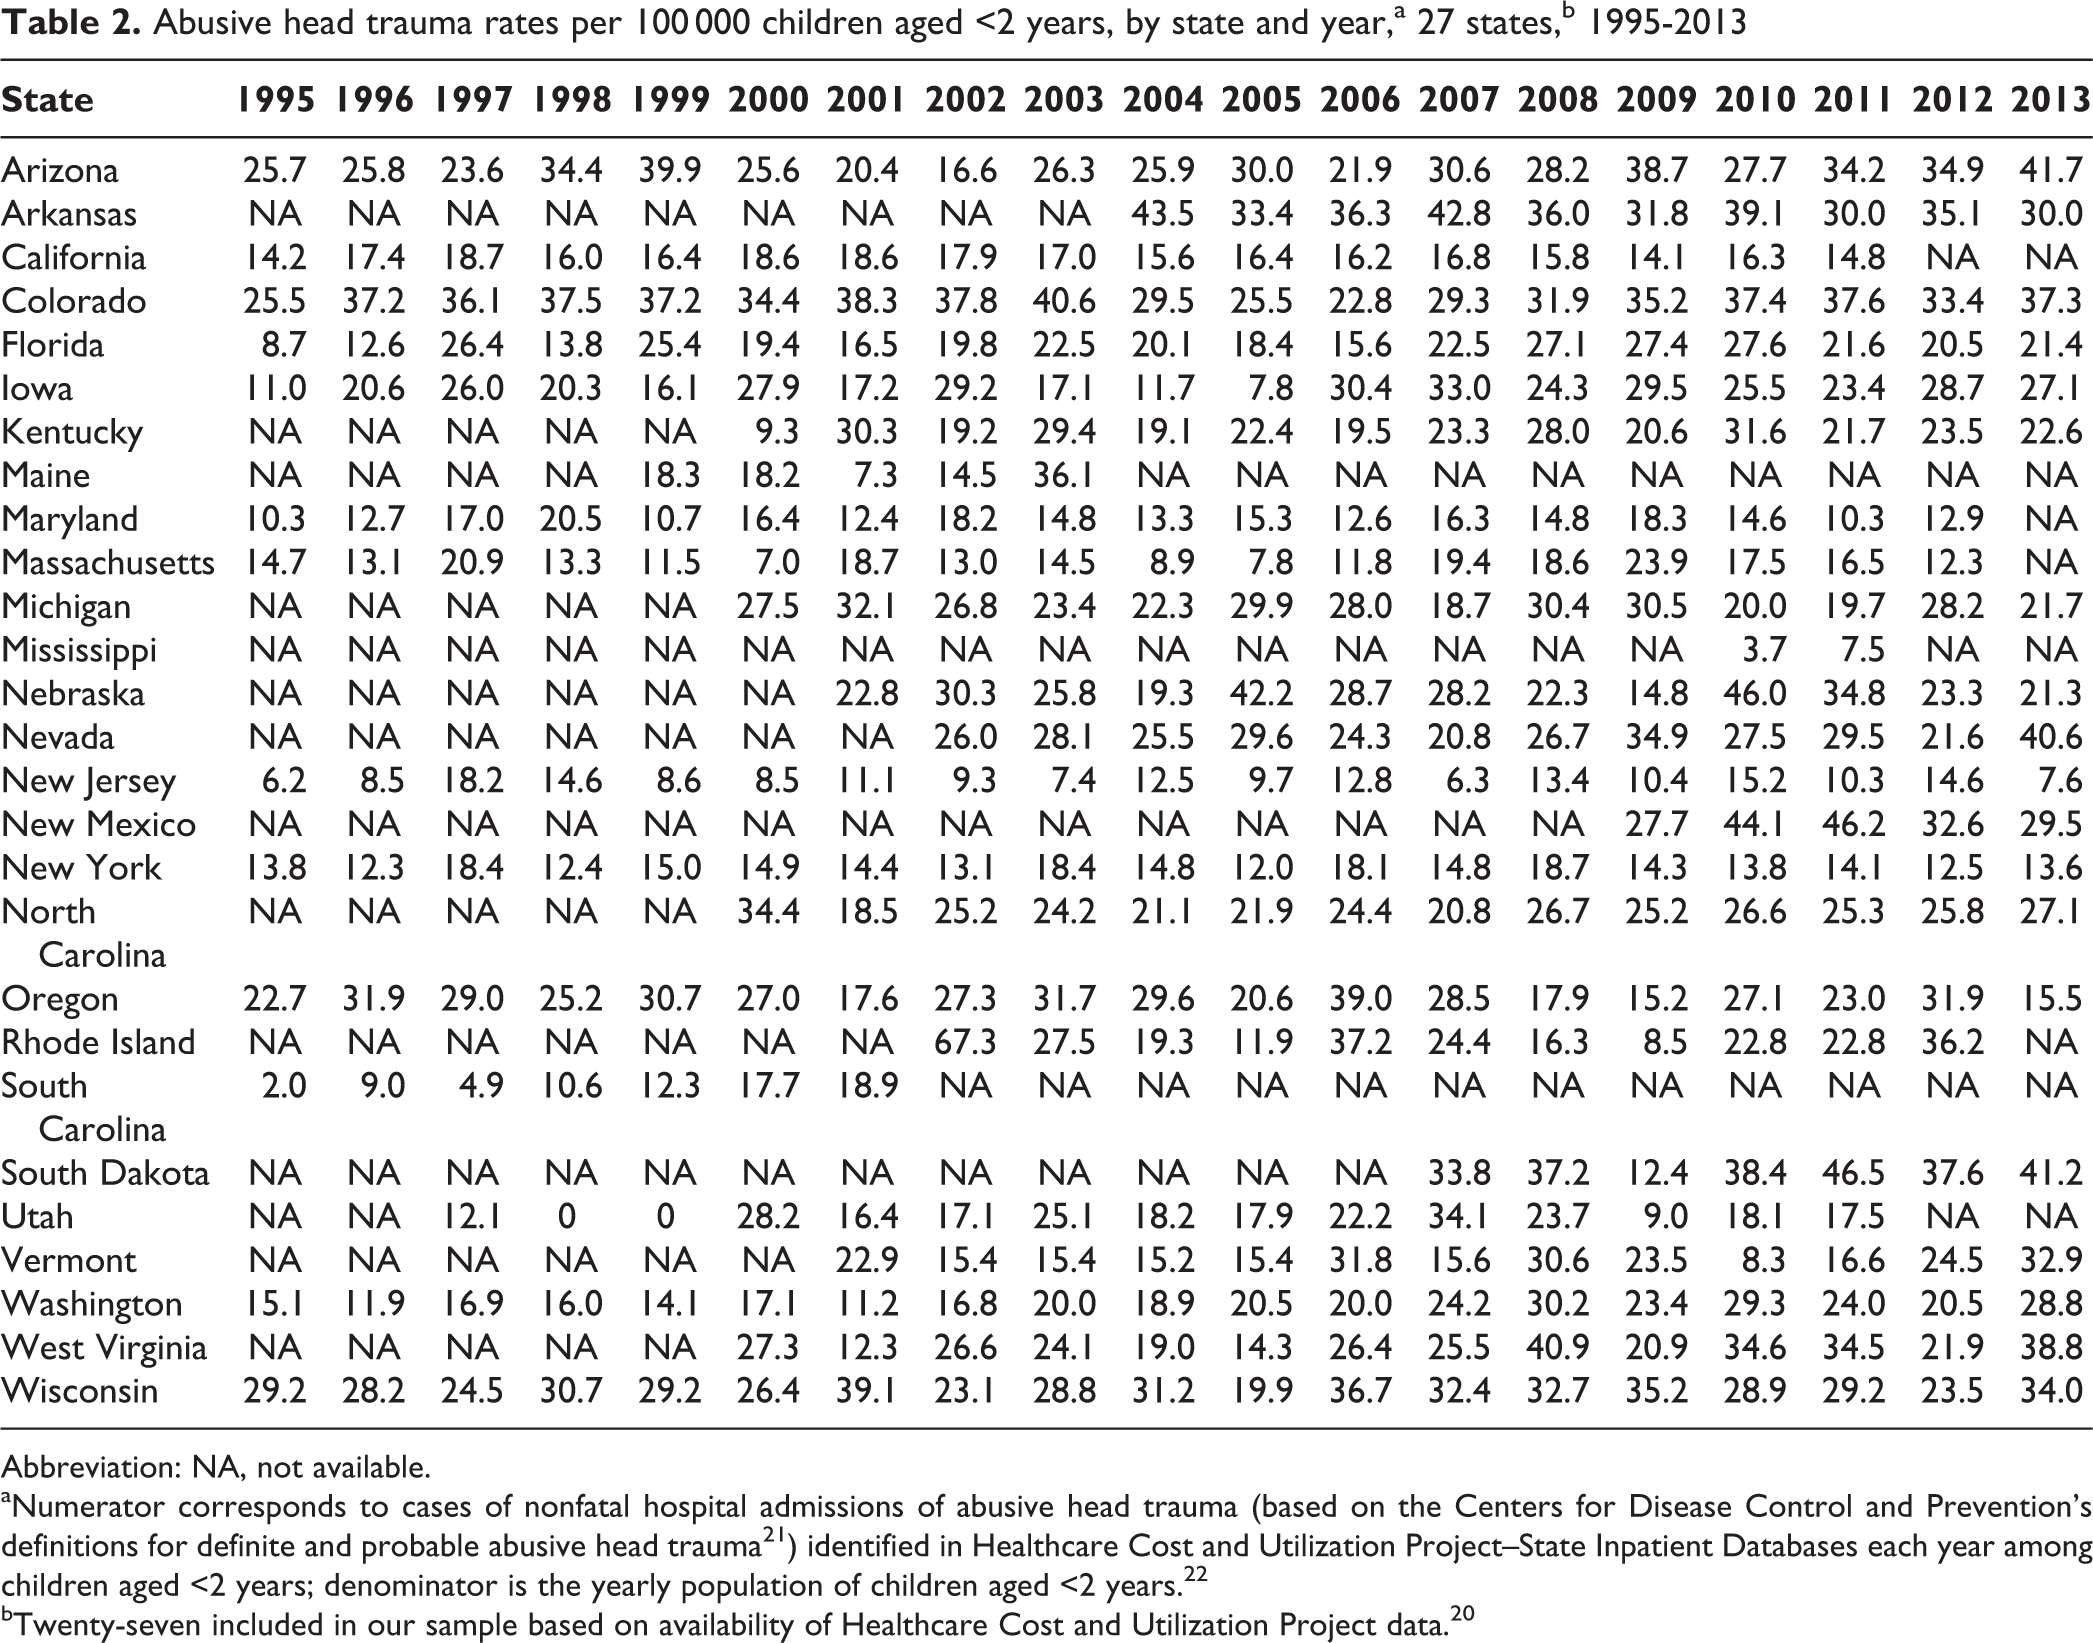
Abbreviation: NA, not available.
aNumerator corresponds to cases of nonfatal hospital admissions of abusive head trauma (based on the Centers for Disease Control and Prevention’s definitions for definite and probable abusive head trauma 21 ) identified in Healthcare Cost and Utilization Project–State Inpatient Databases each year among children aged <2 years; denominator is the yearly population of children aged <2 years. 22
bTwenty-seven included in our sample based on availability of Healthcare Cost and Utilization Project data. 20
Difference-in-difference analyses of the effect of the EITC on abusive head trauma admissions, State Inpatient Databases,a Healthcare Cost and Utilization Project, United States, 1995-2013
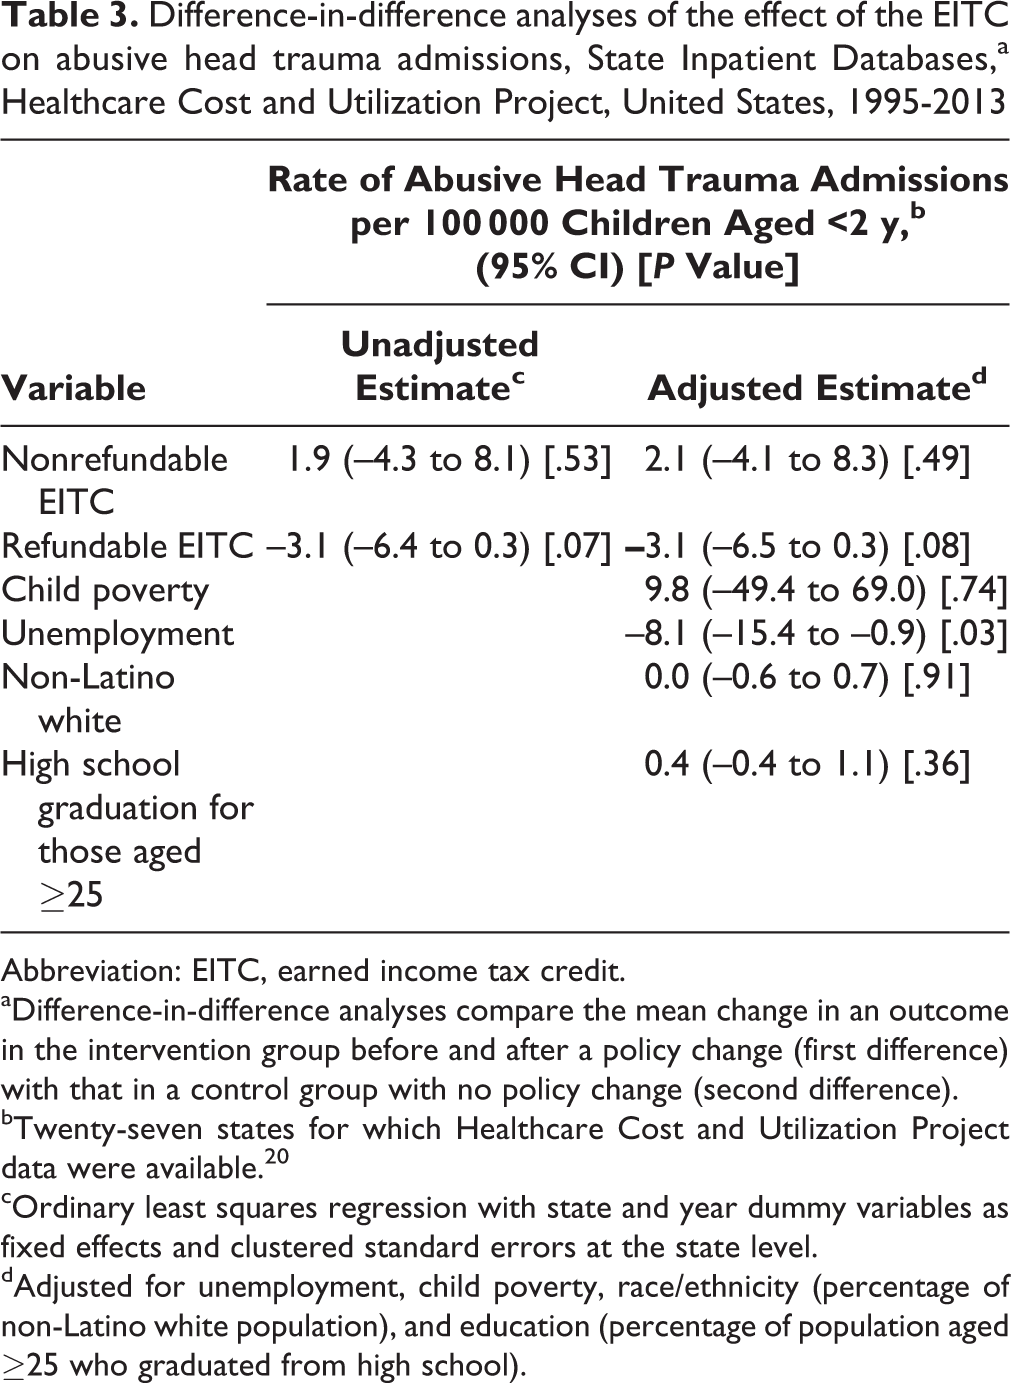
Abbreviation: EITC, earned income tax credit.
aDifference-in-difference analyses compare the mean change in an outcome in the intervention group before and after a policy change (first difference) with that in a control group with no policy change (second difference).
bTwenty-seven states for which Healthcare Cost and Utilization Project data were available. 20
cOrdinary least squares regression with state and year dummy variables as fixed effects and clustered standard errors at the state level.
dAdjusted for unemployment, child poverty, race/ethnicity (percentage of non-Latino white population), and education (percentage of population aged ≥25 who graduated from high school).
In states with refundable EITCs, tax refunds ranged from $108 to $1014 for a single parent working full-time at minimum wage with 1 child and from $165 to $1648 for a single parent working full-time at minimum wage with 2 children (Table 1). In states with nonrefundable EITCs, tax savings ranged, on average, from <$2 to $189 for a single parent working full-time at minimum wage with 1 child and from $0 to $250 for a single parent working full-time at minimum wage with 2 children.
Discussion
Our difference-in-difference analyses showed that a refundable EITC was associated with a decrease in AHT admissions in children aged <2 years, even after controlling for child poverty, education, unemployment, and race/ethnicity, but a nonrefundable EITC was not. Although the association did not reach statistical significance (P = .08), this trend toward reductions in AHT for refundable EITCs was observed despite some refunds being as low as $108 and averaging just higher than $400. A lack of association for nonrefundable EITCs may be explained by the smaller average amounts or the insufficient number of preintervention data points. Furthermore, because the EITC is only for employed people, it does not benefit families that are disconnected, for various reasons, from the employment sector and that may be at greater need of income support than those employed. Stronger and more widespread economic supports may be associated with larger effects.
Our findings are consistent with the findings of other studies. In a 1997-1998 statewide randomized controlled trial (n = 13 067), an increase in income of $1260 to $2160 per year for families in the intervention group was associated with a 10% reduction in child maltreatment. 29 Another difference-in-difference analysis found that an increase of $2080 per year in income was associated with a 10% reduction in child maltreatment. 30 In both studies, the increase in income was much greater than what we found with the refundable EITC (averaging $400 per year). In addition to the larger amounts of money, in the 2 studies that showed statistically significant decreases in child maltreatment associated with increased income, the income was spread out over the year instead of received in a lump sum, as with the EITC. Both the smaller amount and the lump sum might explain our nonstatistical significance for the EITC.
Increased income may lead to reductions in child abuse in several ways. First, the EITC is associated with decreased stress and mental health problems, both of which are risk factors for abuse and neglect. Decreased stress may also lead to a decrease in dysfunctional modes of coping, such as substance use or abuse, which is also a risk factor for child abuse. 19 Increased income could help parents afford a better child care arrangement or, as others have suggested, prevent mothers’ from repartnering with someone who is not the child’s biological father. 31 Father surrogates are associated with an increased risk for abuse 32 and are the second-most frequent perpetrators of AHT. 2 Finally, having increased income may reduce cognitive load. 33 High cognitive load (ie, the mental load imposed on an individual by a task, such as figuring out how to pay the rent) drains mental resources from other tasks, 34 such as the processing of information and cognitions related to social stimuli. As a result, high cognitive load can change how we perceive and react to social stimuli, such as an infant crying (the most common trigger for AHT 2 ). Cognitive load can also interfere with inhibitory cues (eg, empathy, foreseeing negative consequences) that could help people refrain from abusive behavior. 35 High cognitive load impedes impulse control 36 and increases the likelihood of aggressing an innocent person (eg, the child) as a result of being provoked in another setting (eg, by an intimate partner or employer) and not being able or willing to respond to this provocation. 37
These findings are supported by several of the study’s strengths. First, we used a difference-in-difference design to compare pre- and postchanges in states with EITCs with a control group without EITCs. This design is recommended for policy evaluation. 38 Second, the use of state fixed effects in our models controlled for unobserved factors that did not change during the study period and could have resulted in different levels of maltreatment across states even if no real differences existed. To the extent that these factors were fixed during our time series, inclusion of state fixed effects eliminated this bias. The inclusion of year effects controlled for secular trends. We also controlled for several time-varying confounders.
This study also had several limitations. First, our analyses were limited to AHT inpatient admissions and did not examine, for example, AHT diagnosed in other clinical settings or AHT mortality; as such, reported findings may underestimate the potential effects of the EITC on reducing AHT or be biased if rates of hospital admissions decreased because fatal AHT increased during this period. Second, administrative coding in hospital records may underestimate true AHT prevalence, although the International Classification of Diseases codes used have shown a sensitivity of 92% and a specificity of 96% for hospital admissions. 39 Third, the sample of 27 states included in this comparison was limited by data availability in SIDs. Although more than half of the states were included in this sample and all census regions were represented, the included states may differ from those excluded in ways that may limit the study’s generalizability to excluded states. Fourth, measured confounding at the state and individual levels, as well as other concurrent changes in policies or unmeasured differences that are changing at the same time as the EITC, might lead to incorrectly attributing effects to the EITC when these effects might be due to these other factors.
Finally, drawing causal conclusions about the effects of the EITC on child abuse is challenging because families were not randomly assigned and not all eligible families file for the EITC. For example, in 2013, the percentage of eligible families not filing for the EITC ranged from 16% in Hawaii to 28% in the District of Columbia. 40 It is likely that those who file differ systematically from those who do not file in ways that could be associated with child maltreatment. However, including families that may not have claimed the EITC would be akin to an intent-to-treat analysis, which provides a more conservative estimate of the effect size. Analysis of the EITC at the individual or family level and factoring out other financial supports would facilitate more robust conclusions about the EITC’s impact on AHT.
Despite these limitations, our findings provide promising evidence that refundable EITC policies are associated with reductions in the rate of AHT hospital admissions. Given the high health, economic, and societal costs of AHT, 41 this evidence suggests new possibilities for the prevention of AHT.
Footnotes
Authors’ Note
The findings and conclusions in this article are those of the authors and do not necessarily represent the official position of the Centers for Disease Control and Prevention.
Declaration of Conflicting Interests
The authors declared no potential conflicts of interest with respect to the research, authorship, and/or publication of this article.
Funding
The authors received no financial support for the research, authorship, and/or publication of this article.