
Abstract
Objective:
We investigated data from US public health laboratories funded through the Centers for Disease Control and Prevention’s Tuberculosis Elimination and Laboratory Cooperative Agreement to document trends and challenges in meeting national objectives in tuberculosis (TB) laboratory diagnoses.
Methods:
We examined data on workload and turnaround time from public health laboratories’ progress reports during 2009-2013. We reviewed methodologies, laboratory roles, and progress toward rapid detection of Mycobacterium tuberculosis complex through nucleic acid amplification (NAA) testing. We compared selected data with TB surveillance reports to estimate public health laboratories’ contribution to national diagnostic services.
Results:
During the study period, culture and drug susceptibility tests decreased, but NAA testing increased. Public health laboratories achieved turnaround time benchmarks for drug susceptibility tests at lower levels than for acid-fast bacilli smear and identification from culture. NAA positivity in laboratories among surveillance-reported culture-positive TB cases increased from 26.6% (2355 of 8876) in 2009 to 40.0% (2948 of 7358) in 2013. Public health laboratories provided an estimated 50.9% (4285 of 8413 in 2010) to 57.2% (4210 of 7358 in 2013) of culture testing and 88.3% (6822 of 7727 in 2011) to 94.4% (6845 of 7250 in 2012) of drug susceptibility tests for all US TB cases.
Conclusions:
Public health laboratories contribute substantially to TB diagnoses in the United States. Although testing volumes mostly decreased, the increase in NAA testing indicates continued progress in rapid M tuberculosis complex detection.
Strengthening public health laboratories is a principal component of improving the overall structure of a national laboratory system to support improved health outcomes and preparedness activities. 1 Public health laboratories at all levels investigate, communicate, detect, and monitor wide-ranging health threats, including genetic disorders among newborns, biologic threat agents, and infectious diseases (eg, influenza, sexually transmitted diseases, and tuberculosis [TB]). 2 TB is an infectious disease that has serious public health consequences and for which control and mitigation require core laboratory functions and full involvement of the public health laboratory system.
TB is caused by members of the Mycobacterium tuberculosis complex (MTBC). In 2013, the reported number of TB cases (9582) declined by 3.6%, and the case rate (3.0 cases per 100 000 population) decreased by 4.3% from 2012. 3 However, after 2 decades of annual declines, TB incidence in the United States has leveled off at approximately 3.0 new cases per 100 000 population annually since 2013; in 2015, the reported number of TB cases increased to 9563 from 9421 in 2014, 4 indicating that TB is a substantial national public health threat in the United States as it is abroad. 5 Rapid diagnosis and treatment of people with active TB disease are crucial to stop transmission. 6 Delays in TB diagnosis prevent patients from receiving therapy, thereby hindering public health control efforts. Active TB disease can be diagnosed by chest radiograph or clinical judgment, 6,7 but because TB disease can be difficult to diagnose clinically, additional tests beyond medical examinations are required, including acid-fast bacilli (AFB) smear microscopy, nucleic acid amplification (NAA) testing, and mycobacterial culture and identification. 5 Therefore, a responsibility to provide rapid results to aid diagnosis lies with the laboratory community.
In the United States, TB laboratory services are provided by public and private laboratories. 8 As part of an initiative to strengthen the public health response to TB in the mid-1980s, the Centers for Disease Control and Prevention’s (CDC’s) Division of Tuberculosis Elimination began funding, in part, essential elements of TB programs through the Tuberculosis Elimination and Laboratory Cooperative Agreement in 1985. 9 The public health TB laboratory component of funding, which is focused on laboratory strengthening, encourages recipients to (1) ensure the availability of reliable and timely laboratory services; (2) use recommended methodologies for detection, identification, and susceptibility testing for MTBC; (3) monitor, assess, and use local data to guide decisions on testing algorithms, services, and business practices; and (4) collaborate with partners to ensure optimal use of laboratory services and timely flow of information.
Prompt high-quality testing is essential for TB diagnosis. Measurable TB laboratory goals, described in 1993, were developed to define the readiness of US public health laboratories to respond to the resurgence of TB. 10 These goals, which were the original driver for metrics in the public health TB laboratory component of the cooperative agreement, were focused on implementation of what was, at the time, state-of-the-art technologies. Few studies have examined the quantity and quality of TB diagnostic services in the United States based on these recommendations. 11 –14
The objective of this study was to update our understanding of the scope, role, and challenges of TB testing performed by US public health laboratories. We examined trends in TB laboratory practices, workload, and performance indicators from public health laboratories’ self-reported data, which were provided annually for 2009-2013. We also analyzed measurable evidence of the importance of effective and efficient delivery of TB laboratory services in the public health sector.
Methods
The 58 public health laboratories supported by the cooperative agreement are in all 50 US states, 5 large cities (Houston, Texas; San Francisco, California; Philadelphia, Pennsylvania; New York City; Washington, DC), 2 counties (Los Angeles and San Diego, California), and Puerto Rico. During 2009-2013, public health laboratories self-reported data on methods, workloads, and turnaround time. We based workload data on all 58 laboratories, and we based turnaround time and method data on 57 laboratories because 1 laboratory used another public health laboratory for testing.
Data on workload included the total number of clinical specimens processed (eg, sputum), the number of patients for whom a clinical specimen was processed, the number of patient cultures that tested positive for MTBC, the number of patients for whom MTBC drug susceptibility tests (DSTs) were performed, the number of patient specimens tested directly with NAA, and the number of patients testing positive for MTBC by NAA. We defined turnaround time as the percentage of results achieved within the recommended time frames. 10 With the submitted data, we calculated the percentage of patients testing culture positive for MTBC, testing NAA positive for MTBC, and confirmed with MTBC in 48 hours.
To estimate the degree to which public health laboratories contribute to the overall national level of TB diagnostic testing among culture-confirmed TB cases in the United States, we compared public health laboratory testing volumes with information reported in the national TB surveillance report. 15 We compared the number of MTBC-positive patient NAA test results and MTBC-positive culture results in public health laboratories with the number of total culture-confirmed TB cases from US surveillance reports. We measured the proportion of DSTs performed in public health laboratories by comparing the number of DSTs performed in public health laboratories with that of total surveillance-reported TB cases that had a DST reported.
Data on public health laboratory testing methods included analysis of the use of CDC and Clinical and Laboratory Standards Institute–approved methodologies, 16,17 such as performing AFB smear with fluorochrome stain, automated broth system for culture, rapid methods (eg, high-performance liquid chromatography or deoxyribonucleic acid probes for identification from culture), and use of NAA testing for direct detection of MTBC.
Data on turnaround time included the percentage of specimens received in the public health laboratory within 1, 2, and 3 calendar days of collection; the percentage of AFB smear results reported by the laboratory within 1, 2, and 3 calendar days of specimen receipt; the percentage of MTBC isolates identified within 21 calendar days of receipt; the percentage of DST results reported by the laboratory to the clinician or provider within 28 days of receipt; and the number of patients for whom a positive NAA test was reported by the laboratory within 48 hours of specimen receipt. We calculated aggregate turnaround times based on averages of self-reported individual laboratory percentages of results within recommended time frames based on the 1993 CDC TB laboratory recommendations. 10
We categorized public health laboratories into tiers based on the volume of clinical specimens received each year: tier 1, ≤2000 specimens per year; tier 2, 2001 to 6000 specimens; and tier 3, ≥6001 specimens. To analyze DST turnaround times, we dichotomized laboratories into those performing <50 DSTs per year and those performing ≥50 DSTs per year (the recommended minimum number of DSTs per year needed to maintain proficiency 18 ). We included in the analysis self-reported statistics on aggregate workload and turnaround time, selected self-reported data stratified by public health laboratory testing volume, and comparisons of laboratory data with the National TB Surveillance System. 17 We used Microsoft Excel to evaluate descriptive statistics and SPSS (version 21.0) 19 and R software 20 to calculate correlations and compare means.
Because no human subjects were involved in this study, CDC National Center for HIV/AIDS, Viral Hepatitis, STD, and TB Prevention determined that institutional review board approval was not required.
Results
Workload Volumes, NAA Usage, and MTBC Positivity
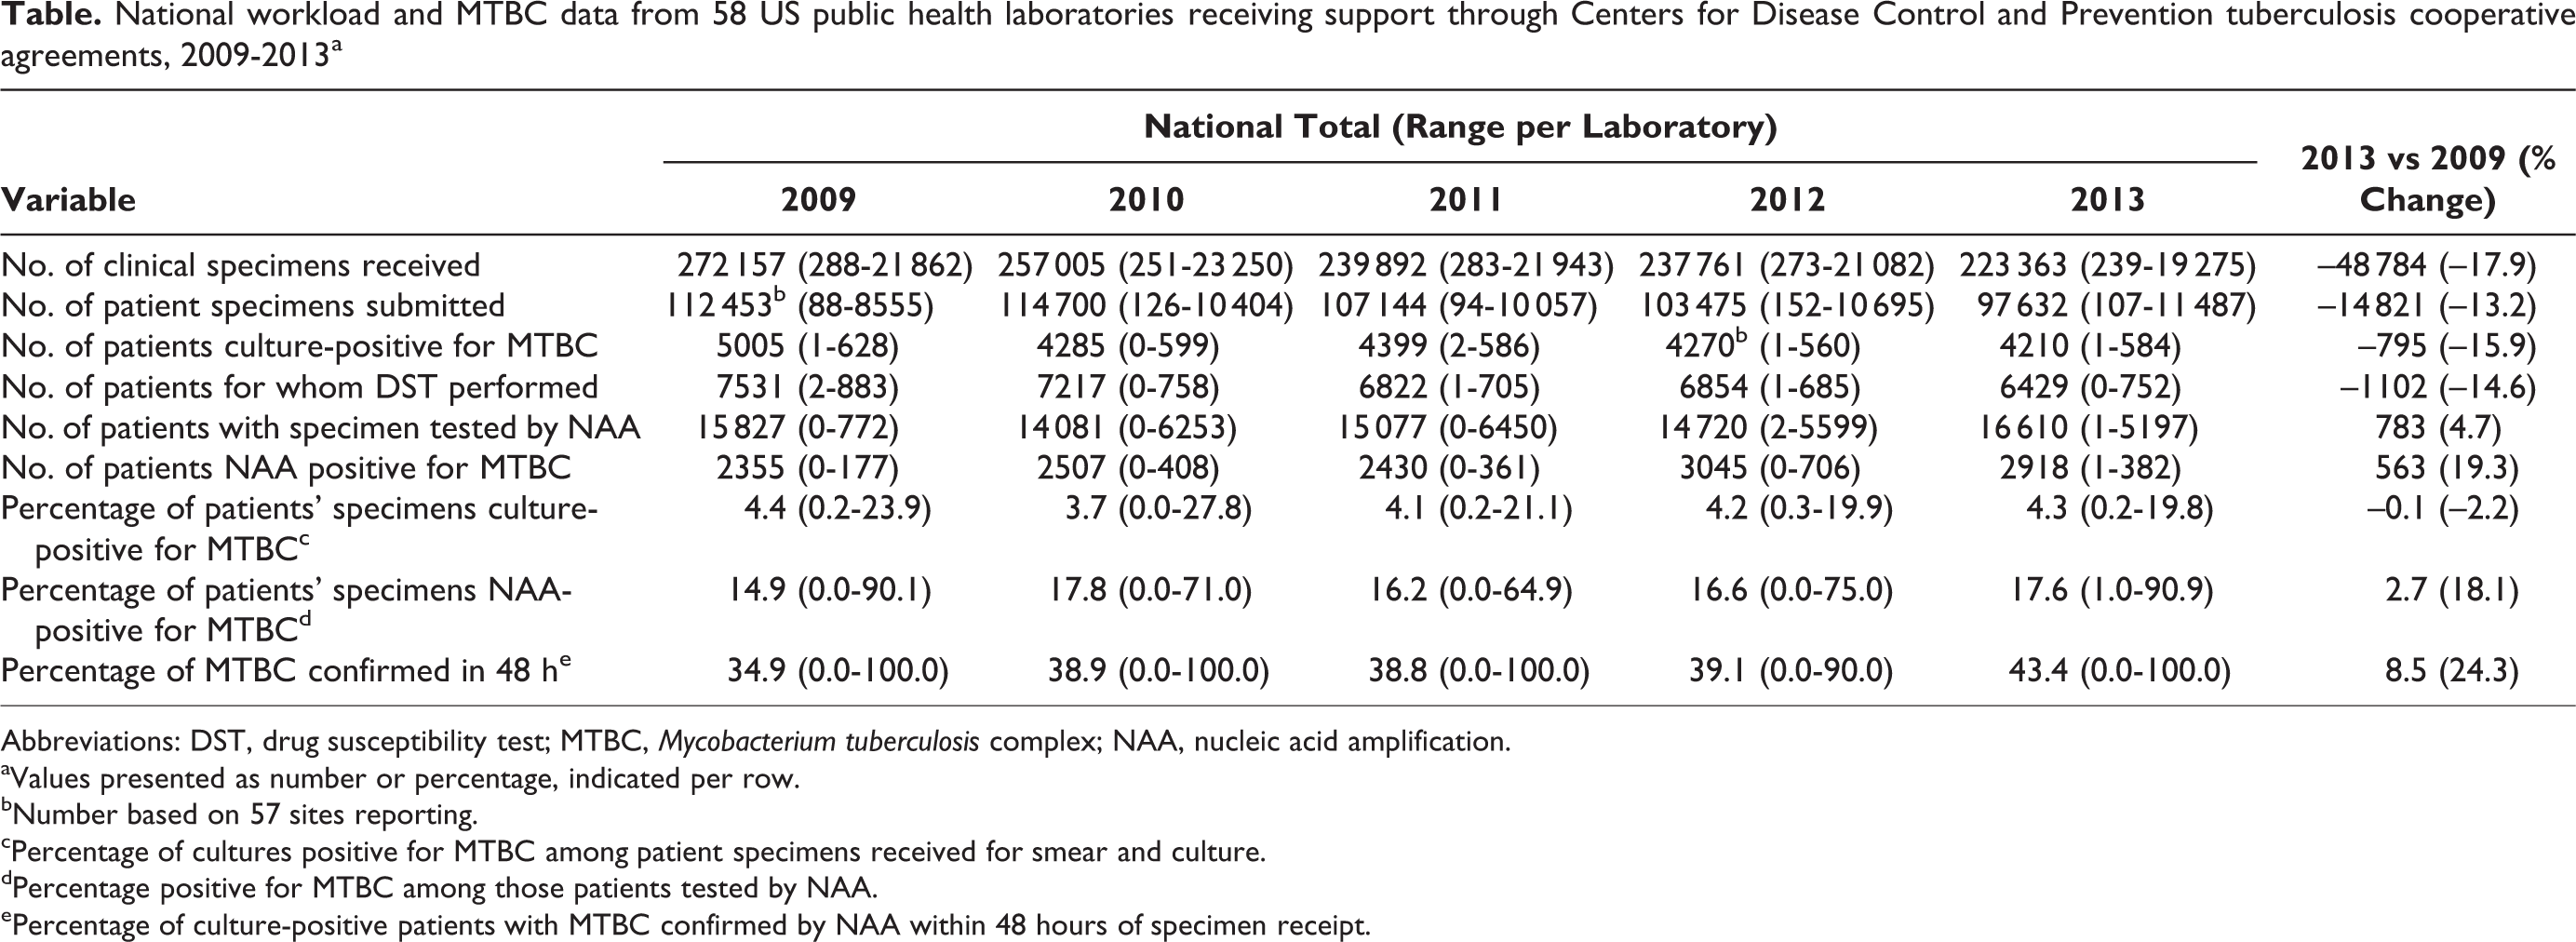
Testing volumes for the number of specimens and the number of patients decreased during the study period, but NAA testing increased. We found the largest decreases in the variables of total specimens received (–17.9%, from 272 157 in 2009 to 223 363 in 2013) and patients testing positive for MTBC by culture (–15.9%, from 5005 in 2009 to 4210 in 2013). Testing volumes in individual laboratories also decreased; for example, the number of laboratories processing <1000 specimens per year increased from 7 in 2009 to 10 in 2013. Ranges and distribution of testing volumes in each test category indicated pronounced interlaboratory variability among jurisdictions. In 2013, for example, 15 laboratories tested <20 MTBC isolates for drug susceptibility, and only 3 laboratories tested >500 isolates for drug susceptibility. We found similarly broad ranges for numbers of NAA tests and DSTs performed (Table).
National workload and MTBC data from 58 US public health laboratories receiving support through Centers for Disease Control and Prevention tuberculosis cooperative agreements, 2009-2013a
Abbreviations: DST, drug susceptibility test; MTBC, Mycobacterium tuberculosis complex; NAA, nucleic acid amplification.
aValues presented as number or percentage, indicated per row.
bNumber based on 57 sites reporting.
cPercentage of cultures positive for MTBC among patient specimens received for smear and culture.
dPercentage positive for MTBC among those patients tested by NAA.
ePercentage of culture-positive patients with MTBC confirmed by NAA within 48 hours of specimen receipt.
We also noted a 19.3% increase in the number of patient samples testing positive for MTBC by NAA (from 2355 in 2009 to 2918 in 2013) and a 4.7% increase in the total volume of NAA tests performed (from 15 827 in 2009 to 16 610 in 2013). Furthermore, the use of NAA testing that accompanied AFB smear and culture increased; the proportion of patient specimens submitted for smear and culture that also had an NAA test increased from 13.3% (14 950 of 112 401) in 2009 to 17.0% (16 610 of 97 632) in 2013. The percentage of patients who were confirmed as having TB disease within 48 hours of specimen receipt by using NAA testing increased from 34.6% (1641 of 4743) in 2009 to 43.4% (1753 of 4041) in 2013. The overall proportion of MTBC culture positivity for each year of the 5-year period was consistent (range, 3.7%-4.5%); however, variability among individual laboratories ranged from 0.0% to 27.8% of culture-positive patients. Stratification of culture positivity by testing volume of laboratory (tiers 1-3) revealed that laboratories with lower testing volumes typically had higher culture-positive proportions than laboratories with higher testing volumes (Figure 1).
Mycobacterium tuberculosis complex (MTBC) culture positivity in cooperative agreement–supported US public health laboratories, by testing volume of laboratory, 2009-2013. Positivity refers to the percentage of patient specimens processed that were culture positive for MTBC. Tier 1, ≤2000 specimens per year; tier 2, 2001-6000 specimens; tier 3, ≥6001 specimens. n = the number of public health laboratories within each tier.
Comparisons With US Surveillance Reports
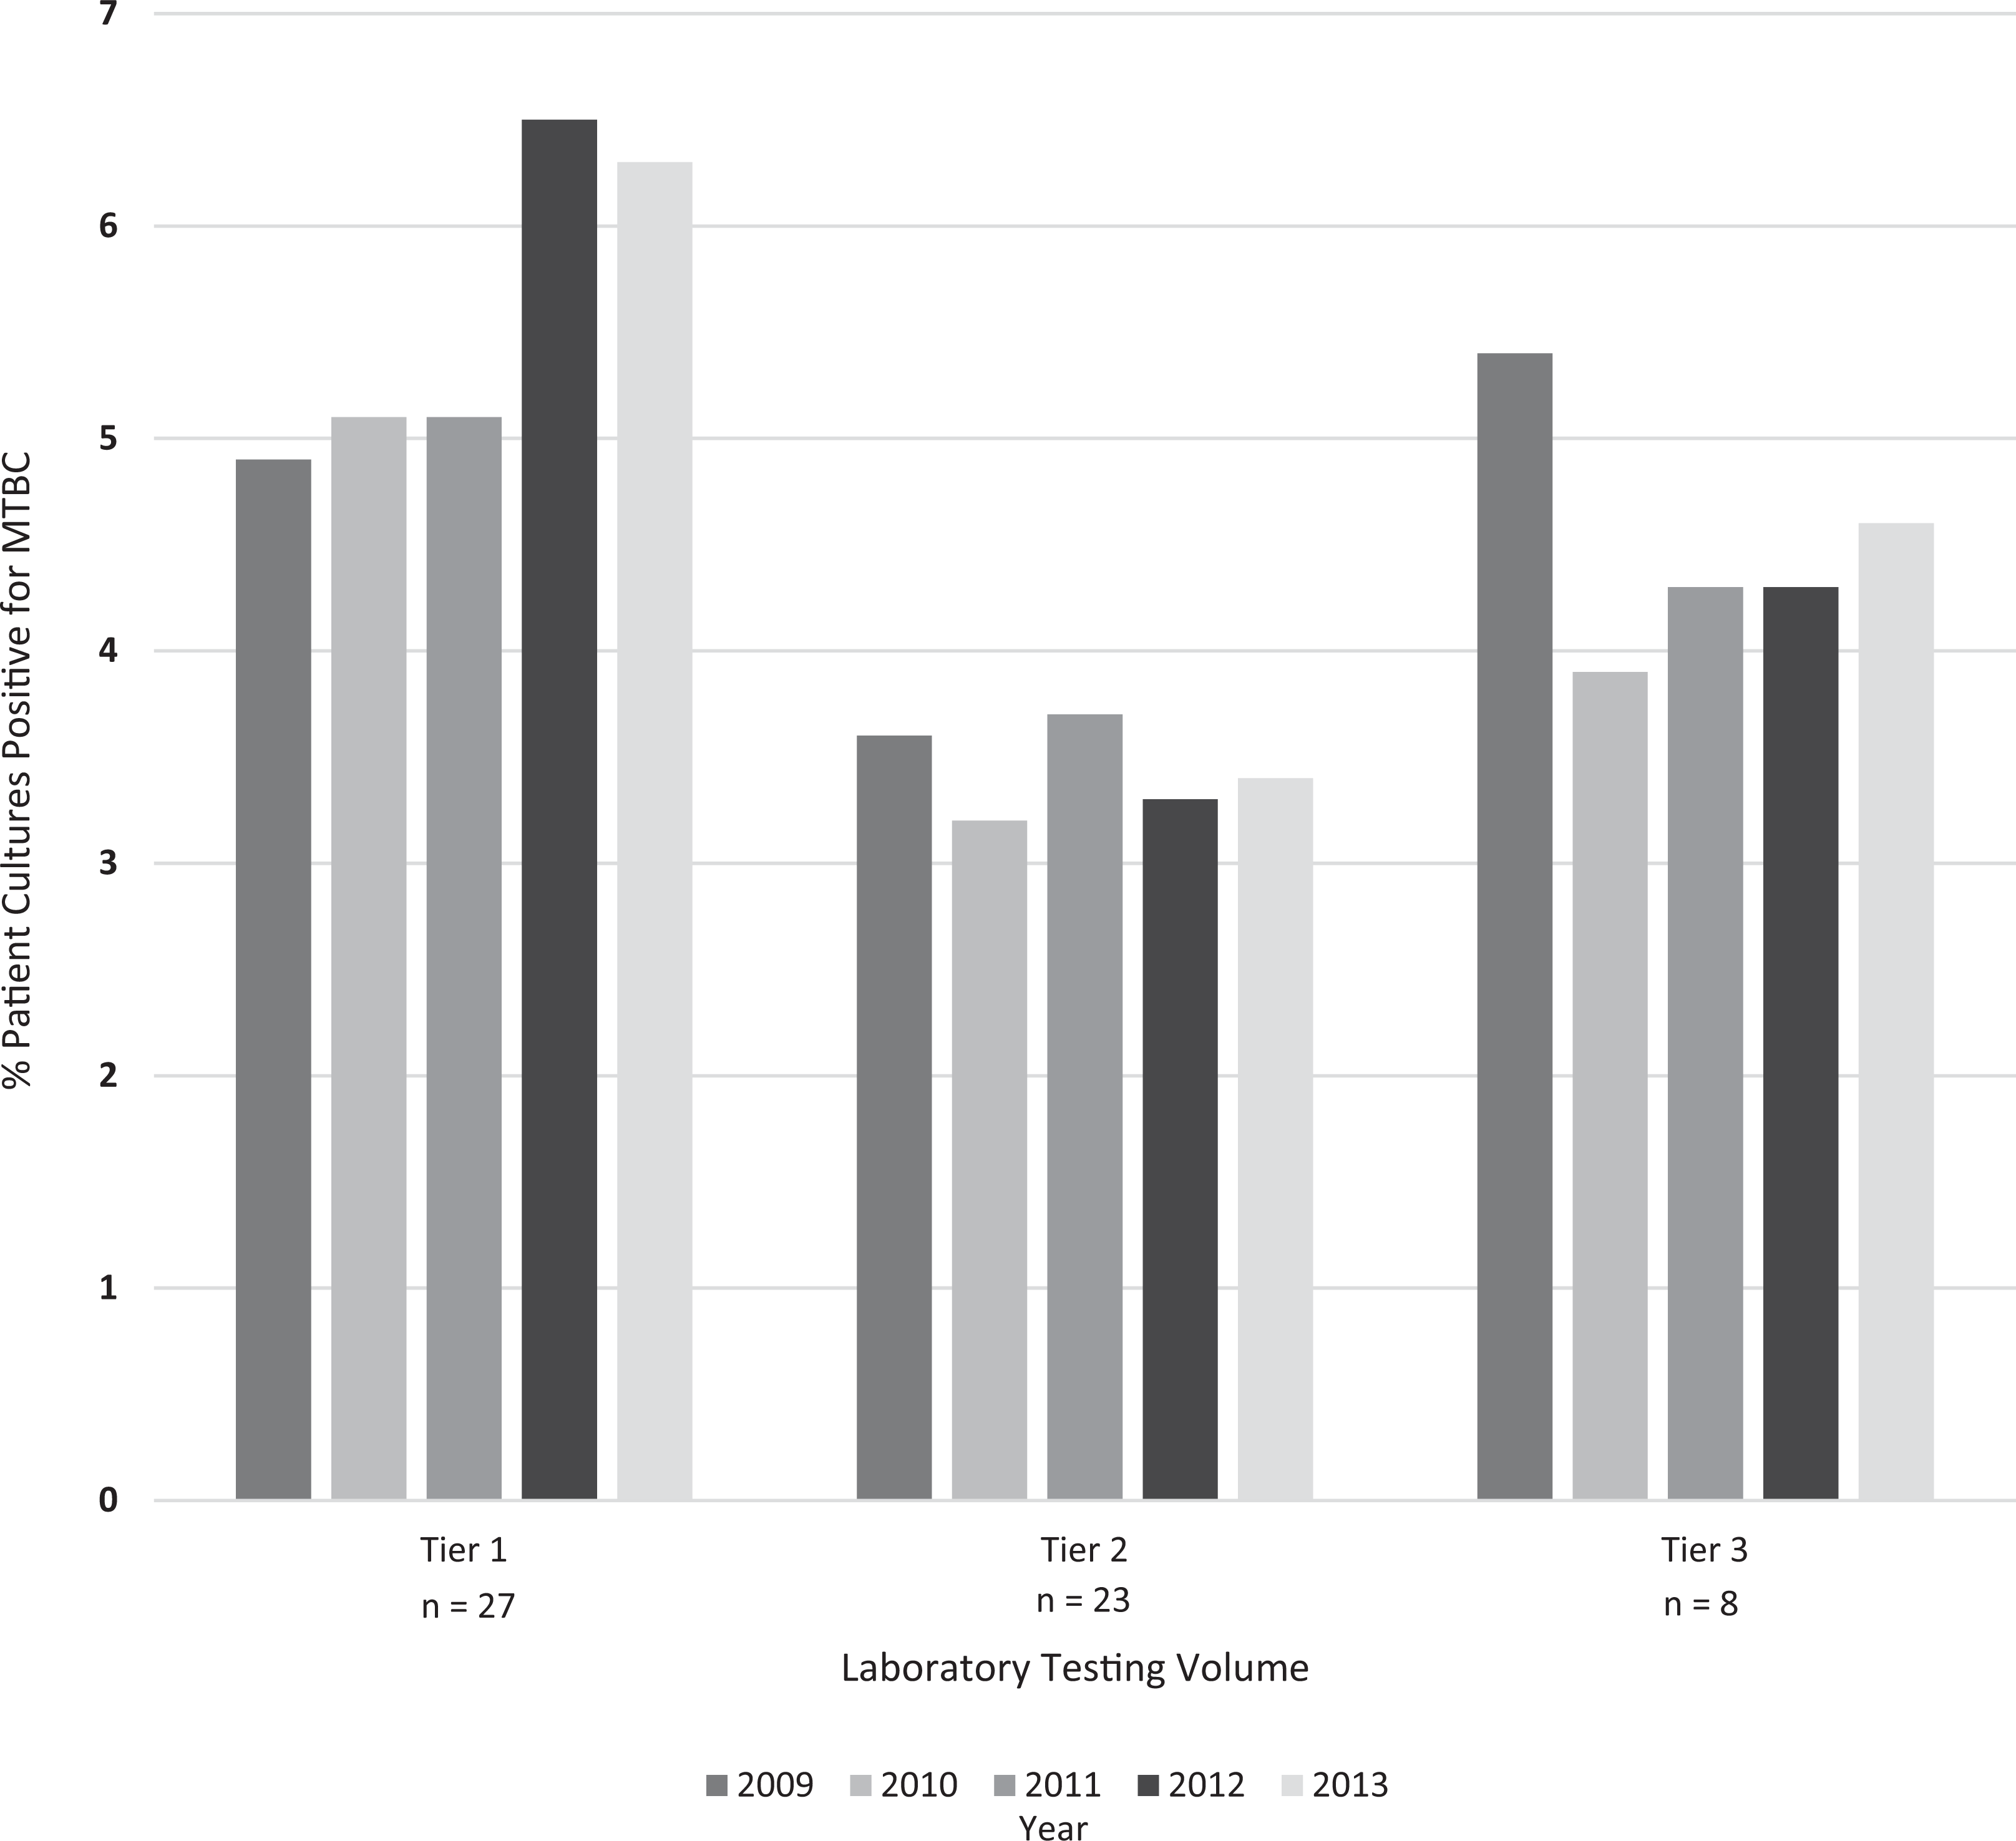
Public health laboratories consistently provided slightly more than half (range, 50.9%-57.1%) of all culture and identification testing and were responsible for most DSTs (range, 88.3%-94.4%) for reported culture-confirmed TB cases. The proportion of NAA positivity in public health laboratories among TB cases increased from 26.5% (2355 of 8876) in 2009 to 40.0% (2948 of 7358) in 2013 (Figure 2).
Trends in percentages of culture tests, drug susceptibility tests (DSTs), and nucleic acid amplification (NAA) testing performed in cooperative agreement–supported US public health laboratories, 2009-2013. All denominators were obtained from US tuberculosis surveillance reports. For percentage culture performed in public health laboratories, denominators were the number of reported culture-confirmed Mycobacterium tuberculosis complex cases; numerators were the number of unique patients positive for M tuberculosis complex by culture in public health laboratories. For percentage of DSTs performed in public health laboratories, denominators were the number of reported culture-confirmed M tuberculosis complex cases that had DSTs performed; numerators were the number of unique patient DSTs performed in public health laboratories. For percentage NAA performed in public health laboratories, denominators were the number of reported culture-confirmed M tuberculosis complex cases; numerators were the number of unique patients with NAA-positive tests in public health laboratories.
Public Health Laboratory Testing Methods
Of the 57 public health laboratories performing all or some mycobacteriology testing in-house, we found no changes in the use of fluorochrome staining methods for AFB smear (56 of 57 laboratories); all public health laboratories performing culture used automated broth systems for inoculation of AFB cultures and rapid methods for initial identification of mycobacteria from growth in culture. During 2009, 54 of 57 public health laboratories performed DSTs in-house by using an automated broth-based system; 3 laboratories referred testing to another laboratory. Those that described anti-TB drug panels (n = 51) indicated testing all first-line anti-TB drugs recommended at that time (isoniazid, rifampin, and ethambutol). In 2013, 55 of 57 laboratories used automated broth-based DST systems, 1 laboratory performed first-line DSTs by means of agar proportion, and 1 laboratory used a manual broth-based system. In 2013, all but 3 public health laboratories tested the 4 recommended drugs (isoniazid, rifampin, ethambutol, and pyrazinamide). In 2009, 5 public health laboratories did not offer access to NAA testing; however, by 2013, all 58 public health laboratories either performed testing in house (n = 55) or referred requests to another laboratory (n = 3).
Turnaround Times
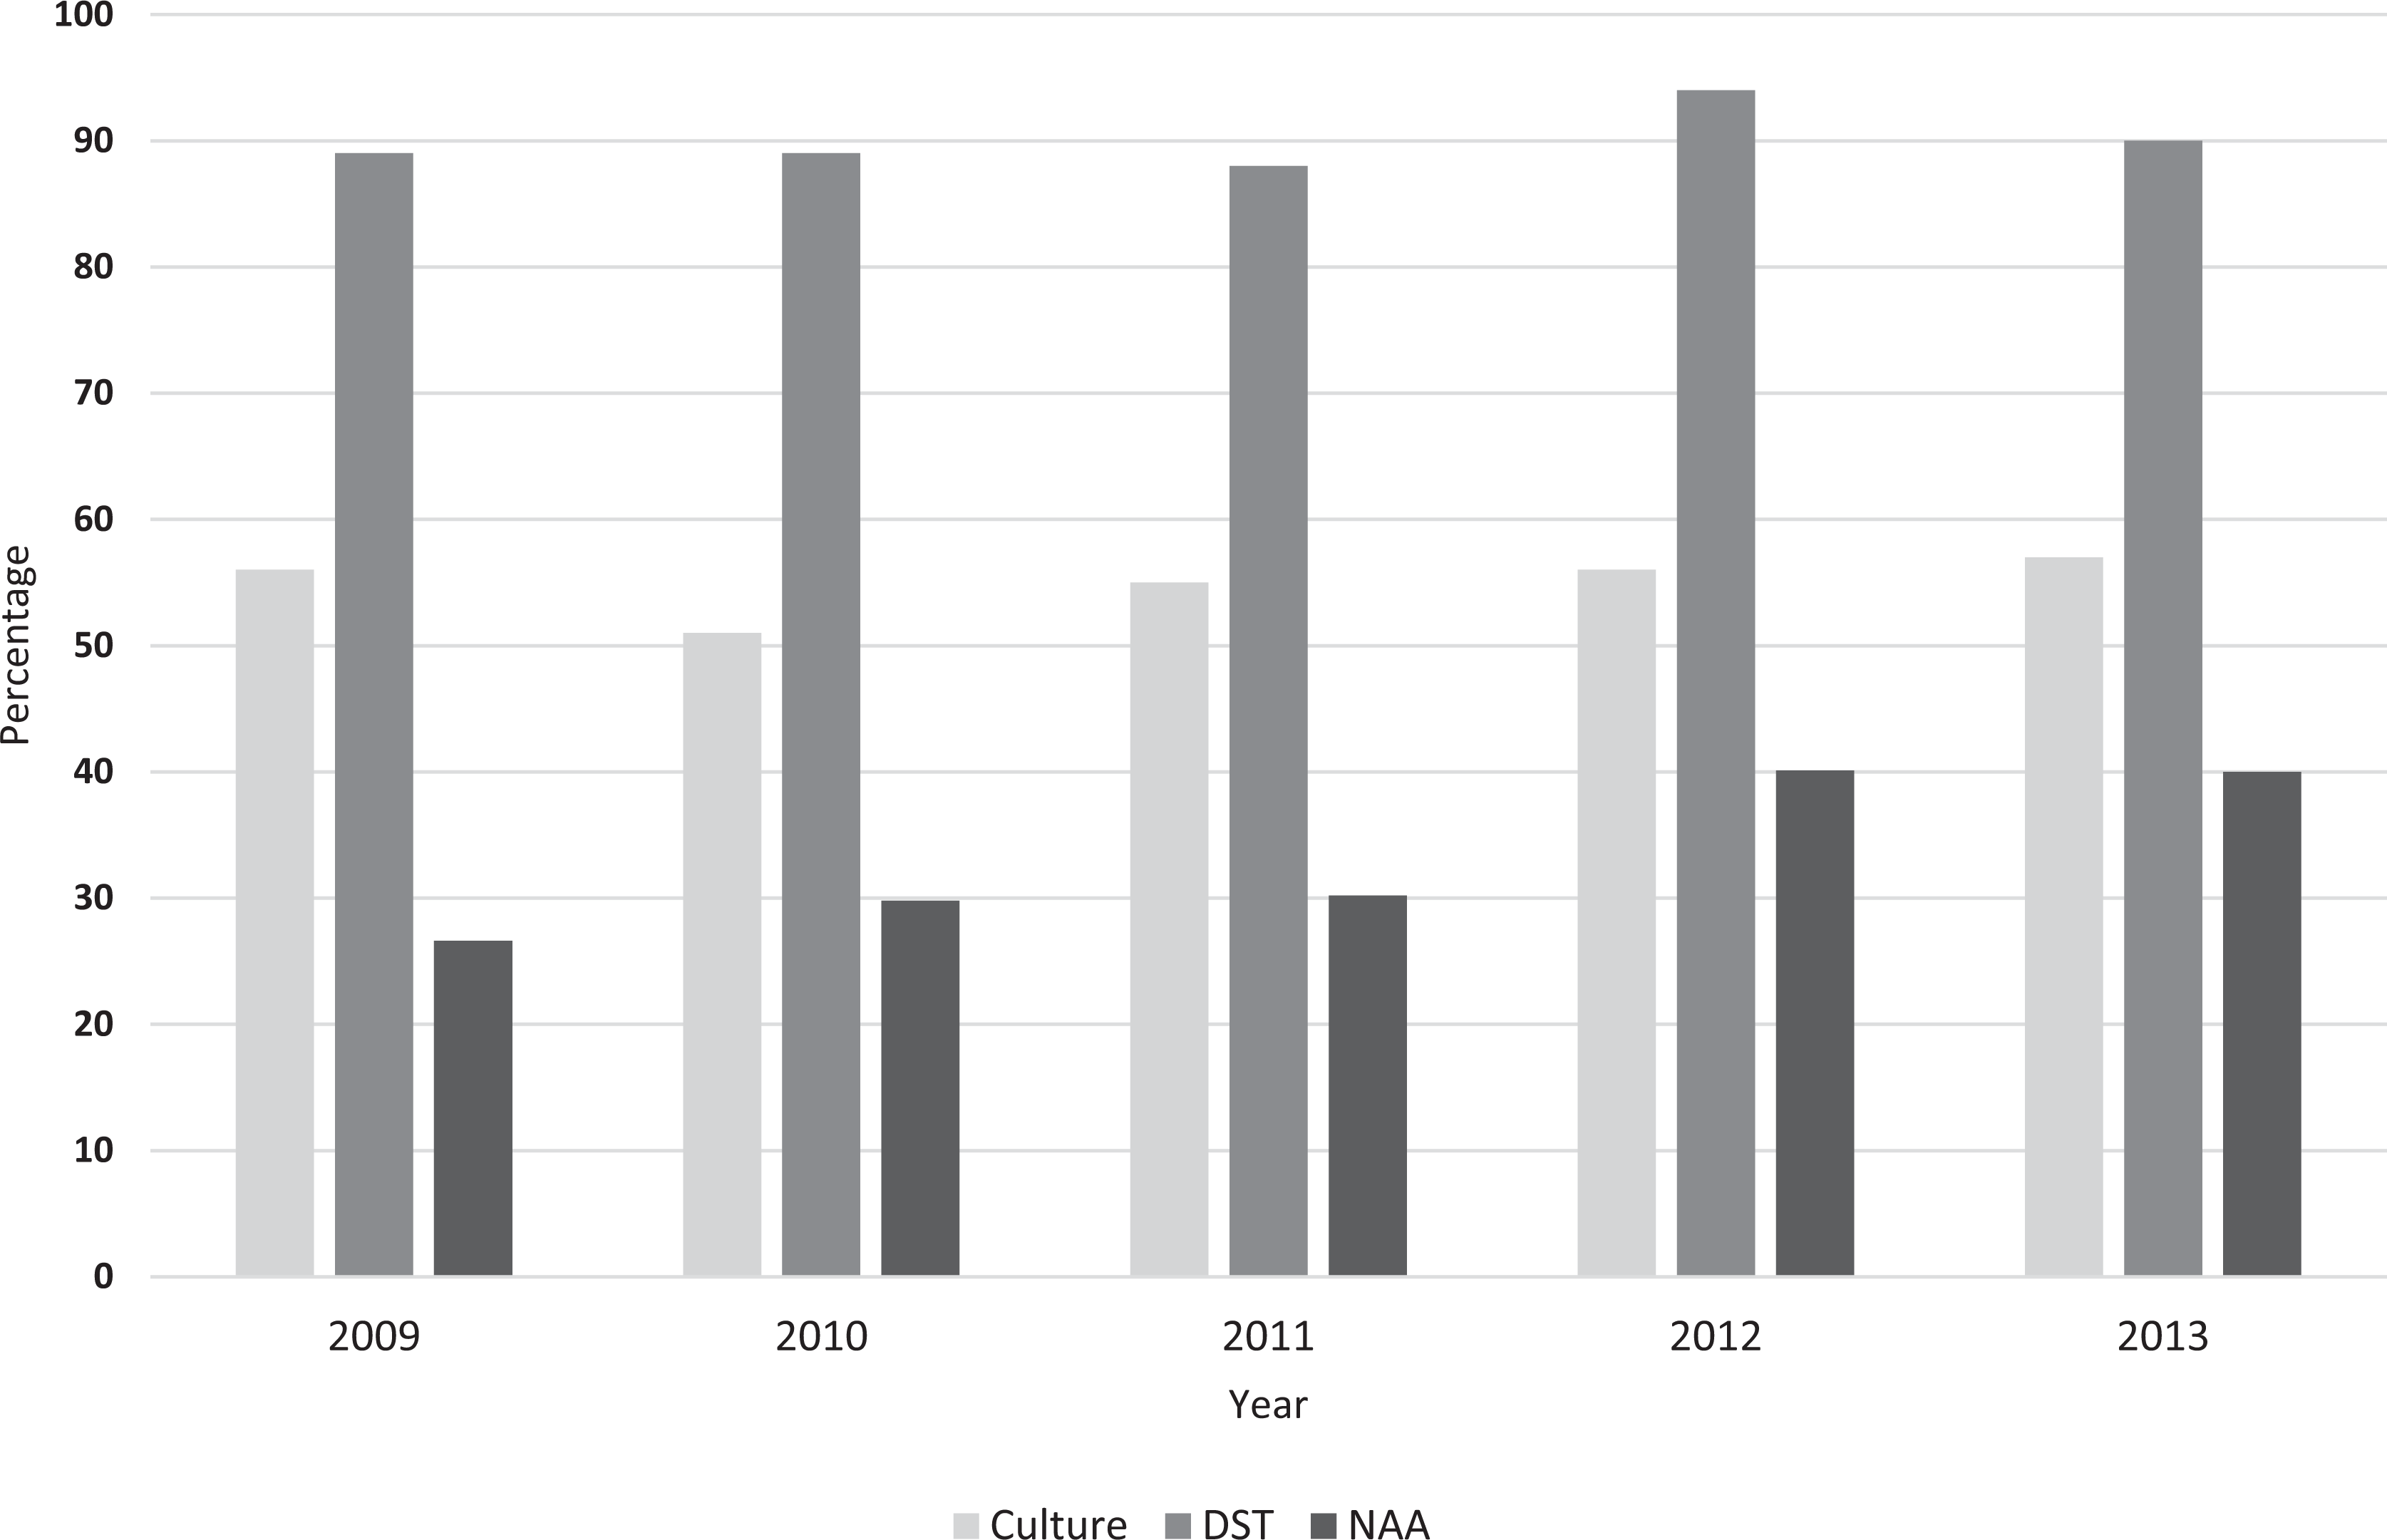
Public health laboratories met the turnaround time benchmark for AFB smear results within 1 day of specimen receipt at high levels (average of 87%-89% of results meeting benchmark); however, public health laboratories met the turnaround time benchmark for DST results within 28 days (average of 49%-60% of results meeting benchmarks) at lower levels. We did not observe significant trends for any turnaround time benchmark from 2009 through 2013. Furthermore, analysis of turnaround times stratified by laboratory testing volume (tiers 1-3) did not reveal any associations. Laboratories performing <50 DSTs per year were less likely than laboratories performing ≥50 DSTs per year to meet the DST turnaround time benchmark, but only for 2009 and 2013. Achievement of the turnaround time benchmark for specimen receipt in the laboratory within 1 day of specimen collection was significantly higher for local public health laboratories (86%-88%) than for state public health laboratories (38%-43%) for all 5 years. Differences in other turnaround time measures between local and state public health laboratories were not significant (Figure 3).
Turnaround time trends from US public health laboratory self-reported data, 2009-2013. All turnaround times are measured from the date of receipt in the laboratory, with the exception of specimen receipt, which is measured from date of collection. Percentages designate the average percentage of specimens or results obtained within the time frames indicated. Local indicates city or county public health laboratory; state indicates state public health laboratory. Abbreviation: MTBC, Mycobacterium tuberculosis complex.
Discussion
Our analysis revealed that US public health laboratory testing volumes for AFB smear, culture, and DSTs decreased yearly during 2009-2013. This decrease mirrors overall annual national decreases in numbers of active TB cases reported in the United States. 17 The only testing category that did not have a decrease in volume was use of NAA testing to detect MTBC in clinical samples: this testing increased annually from 2009 to 2013.
US public health laboratories provide various roles in their jurisdictions. Some function as the only mycobacteriology testing resource in a state or region and thus receive clinical specimens from widely varying patient sources. Other public health laboratories serve in a mixed capacity, receiving specimens from a narrow group of clients (eg, patients visiting TB clinics) or receiving cultured isolates from clinical and hospital laboratories. Some public health laboratories process few clinical patient specimens but serve primarily as reference laboratories: these public health laboratories might receive isolates and inoculated media from other laboratories within their jurisdiction. This variation in roles might be indicated by the broad range of MTBC culture positivity observed across public health laboratories and is reflected in an inverse association between testing volumes and MTBC culture positivity. High-volume laboratories often had MTBC culture positivity proportions <1%, whereas some low-volume laboratories had much higher proportions of MTBC culture positivity, indicating that, although these laboratories might have few MTBC-positive patients, they report a higher proportion of positive results than laboratories with higher testing volumes. The potential occurrence of false-positive cultures can affect this measurement. 21 Monitoring culture positivity to detect false-positives is encouraged. 22 Ranges of testing volumes among public health laboratories also varied considerably, which might indicate variable roles that public health laboratories play in their jurisdictions.
For 2009-2013, we observed no discernible changes in turnaround times for AFB smear, identification, or DSTs among public health laboratories, as measured by the percentage of specimen results reported within recommended time frames, nor did we observe any associations between turnaround times and volume-based laboratory tiers. Comparing our turnaround time data with those of older studies is difficult, because most of the older studies measured the number of laboratories able to report identification within 21 days and DSTs within 28 days and did not provide explanations for how specimen percentages were calculated. 12,13,23
A strength of our analysis was that specimen-based measurements reflect descriptions of turnaround times in a more meaningful and accurate way than those provided in earlier studies. Despite differences in measurements, decreases in turnaround times have occurred, most likely caused by changes in methodology and evolving technology. Patient management has benefited from these improvements because previous studies have documented the association between laboratory delays and delays in treatment initiation. 24,25
Early detection of active TB disease is essential in interrupting TB transmission and reducing mortality from TB. 5,26 Using NAA tests in addition to culture aids the rapid diagnosis of TB and has been advocated as a standard practice in mycobacteriology laboratories. 27 –29 Our data revealed increased uptake of NAA testing during 2009-2013, with more laboratories performing these tests in-house, which has led to more patients being tested and to increased rapid detection of MTBC. Furthermore, although culture, identification, and DST methods are performed by or accessed through referral at all public health laboratories, lack of improvements in turnaround times during 2009-2013 might indicate that growth-based methodologies and laboratory practices are no longer sufficient to produce substantial advances in turnaround times. However, the increased use of molecular NAA testing indicates that reducing turnaround times for detection of MTBC in patient specimens is achievable, and continued escalation of NAA testing will be necessary to achieve the Healthy People 2020 goal of more rapid laboratory detection of MTBC. 30
Meeting DST turnaround times has been especially challenging, and laboratory-reported difficulties have included programmatic concerns, such as staffing levels and time constraints. The slow growth rate of MTBC in culture has also been identified as an issue; therefore, the implementation of evolving molecular approaches (eg, matrix-assisted laser desorption ionization mass spectrometry, whole genome sequencing, and metagenomics) might improve turnaround times for detecting MTBC and predicting drug resistance.
Maintaining proficiency in laboratories is critical and might be achieved, in part, by ensuring adequate testing volumes (ie, ≥20 specimens per week). 16,31 Concerns arise with lower testing volumes because the technology used to identify MTBC and DST requires considerable technical expertise. This proficiency might be difficult to maintain in low-volume laboratories. The Association of Public Health Laboratories and CDC recommend that laboratories with insufficient testing volumes or those that are unable to provide accurate results quickly consider sending specimens or cultures to qualified full-service laboratories. 31,32 However, testing volume is only 1 potential indicator of proficiency. Other factors enter into the decision for a laboratory to continue mycobacteriology services, including staff expertise, dedicated quality assurance programs, and regional assessments of the need for essential services. 33 CDC and the Association of Public Health Laboratories recommend that a minimum of 50 DSTs be performed by a laboratory per year to maintain competency. 18,31 More than one-third of public health laboratories performed <50 DSTs per year during 2009-2013, with several performing this assay <20 times per year. In examining these data and analyzing information from the Association of Public Health Laboratories’ TB Laboratory Services Survey 13 and in light of anticipated declining trends in this highly complex procedure, consideration for referral of testing might be warranted.
Limitations
Our analysis had certain limitations. First, the turnaround time measurement that we used was the percentage of test results reported within a recommended time frame rather than a mean or median. This measurement might have a substantial impact for laboratories with small denominators for each benchmark. Furthermore, turnaround times are self-reported percentages, and measurements might be subject to differences in recording capabilities in laboratories. Additionally, our data analysis covered only the 58 recipients of cooperative agreement funding, a subset of all 76 public health laboratories in the United States performing TB testing. The 18 laboratories not funded by the cooperative agreement were local public health laboratories. The exact number of all laboratories (including those in private, clinical, and commercial settings) performing any aspect of TB testing is unknown, but it was estimated to be 1400 based on a list of laboratories enrolled in a mycobacteriology proficiency testing program. 13 However, many of these laboratories perform only the very basic service of AFB smear. Finally, our estimation of the contribution of public health laboratory testing to overall TB diagnoses was analyzed through different data sources, which might not reflect duplicate testing.
Conclusion
Our analysis demonstrated the high degree to which public health laboratories contribute to TB diagnoses and to testing that provides evidence of TB drug resistance in the United States. Accordingly, public health laboratories are principal partners in the recently announced National Action Plan for Combating Multidrug-Resistant Tuberculosis. 34 TB disease diagnosis is only 1 of the functions that public health laboratories provide in TB control and prevention; public health laboratories are also charged with investigating and validating new methodologies, providing confirmatory and referral testing for other laboratories, and offering consultation and interpretation of results to TB control and other submitters. These public health assurance activities might not be provided by laboratories in the private sector or in hospitals. Although hospitals provide approximately 55% of public health assessment activities related to all diagnostic and surveillance needs, hospitals are less likely than public health providers to contribute to assurance activities (eg, regular evaluations of the effects of public health services on community health status). 35 These assurance activities are achieved by ongoing and frequent communication with providers, TB health practitioners, and program officials and are vital to successful TB control.
This study provides an aggregate view of data on national workload and turnaround time from a subset of public health laboratories. Individualized data are provided to participant laboratories annually, with national data provided for comparison in a biennial aggregate report. 36 Although these data are intended primarily for local improvement of laboratory programs, understanding laboratory capacity and capability of TB testing nationally can strengthen overall laboratory testing practices and algorithms, thus increasing the rapid identification of MTBC. Future examinations of TB laboratory services should analyze workload, methodologies, and use of molecular assays as well as cost analyses. A recent evaluation of health expenditures indicated that public health programs, including public health laboratories, are experiencing a declining share of US health spending 37 ; therefore, future studies can benefit from determining which methods and algorithms will be more cost-effective and will result in the most efficient use of public funds while maintaining accurate reporting.
Footnotes
Acknowledgments
Information in this article was obtained by the Division of Tuberculosis Elimination’s Laboratory Capacity Team of the Centers for Disease Control and Prevention’s National Center for HIV/AIDS, Viral Hepatitis, STD, and TB Prevention (nonresearch domestic Funding Opportunity Announcement: Tuberculosis Elimination and Laboratory Cooperative Agreement; CDC-RFA-PS15-1501). The findings and conclusions in this article are those of the authors and do not necessarily represent the official position of the Centers for Disease Control and Prevention.
Declaration of Conflicting Interests
The author(s) declared no potential conflicts of interest with respect to the research, authorship, and/or publication of this article.
Funding
The author(s) received no financial support for the research, authorship, and/or publication of this article.