
Abstract
All local health departments in North Carolina are mandated to provide a defined set of environmental health services, yet few have the tools to understand the costs incurred in delivering these services. The objectives of this study were to (1) derive cost estimates for 2 commonly provided environmental health services—food and lodging inspections and on-site water services—and (2) explore factors that drive variations in costs, focusing on the roles of economies of scale and scope. Using data from 15 local health departments in North Carolina, we found that costs varied substantially. A bivariate analysis found evidence of economies of scale: higher volumes of services were associated with lower costs per service. Providing a greater scope of services, however, was not consistently associated with reduced costs. In-depth cost data provide public health officials with key information when deciding how to best serve their communities.
Local health departments (LHDs) in many US states are required to provide defined sets of essential public health services. In North Carolina, mandated public health services include communicable disease control and prevention, vital records, and comprehensive environmental health services (EHSs). Mandated services, however, are not always adequately funded, given generally low levels of investment in public health. 1 In North Carolina, levels of public funding for mandated services are often lower than the amount required by LHDs to provide them. North Carolina is organized as a decentralized state for public health, and local and state investments in public health services vary widely.
This study was conducted to help public health leaders in North Carolina determine the cost of adequately delivering mandated public health services. Specifically, leaders wanted to understand how much funding would be needed to produce positive effects or healthy outcomes across a state that represents the spectrum of the rural–urban continuum. Costing data are difficult to pinpoint in decentralized systems, but a closer look at 1 category of mandated services, EHSs, can provide insight into costing methods that work for public health and new ways to predict and then measure the value of public health services.
Evaluating the adequacy of funding for a public health service requires that LHDs understand the costs incurred in providing that service. 2 –4 Few LHDs in the United States have the tools to estimate the cost of providing any given service and to identify how costs vary according to the scale and scope of the service provided. 5 This lack of a detailed understanding of the costs of providing public health services can impede LHDs’ abilities to ensure that services are delivered efficiently and to generate enough revenue to cover their costs. 6,7 The objectives of this study were to (1) derive cost estimates for the 2 largest EHSs—food and lodging inspections and on-site water services—and (2) explore factors that drive variations in costs, focusing on economies of scale and scope.
Methods
We obtained data for this study with a survey 8 based on a cost-analysis tool developed for substance abuse services by RTI. 9 The survey, which was emailed to 15 LHDs in North Carolina, asked respondents—typically, the environmental health manager and the finance officer—to report detailed information on the number of EHSs provided and the costs incurred. To complete the survey, respondents used information from their agency’s accounting system and estimates from program managers for information not available in the accounting system. We collected data for fiscal year 2012 (July 1, 2011–June 30, 2012). LHDs received individual coaching as needed to help them complete the survey. To validate the data, we carefully reviewed all responses and obtained additional information and clarification through follow-up telephone calls, as needed. The study design was approved by the East Carolina University Institutional Review Board.
We supplemented survey data with secondary data from the 2013 profile study from the National Association of County and City Health Officials. 10 The sample consisted of 15 LHDs in North Carolina (from a total of 85 LHDs) serving 18 counties (from a total of 100 counties). We used a convenience sample of LHDs that were contacted through the North Carolina Practice-Based Research Network and that indicated a willingness to complete the survey. LHDs in the sample were fairly comparable with all LHDs in North Carolina, in terms of population size, total expenditures, type of jurisdiction served, and presence of a local board of health (Table 1). Because of the small sample size, we conducted only univariate and bivariate analyses. We conducted bivariate analysis to explore (1) the existence of economies of scale and scope in providing the selected EHSs and (2) variations in costs across key agency characteristics, including population size, population density, jurisdiction type, and location.
Comparison of LHDs in a survey of costing methods for environmental health services and all LHDs, North Carolina, 2012a
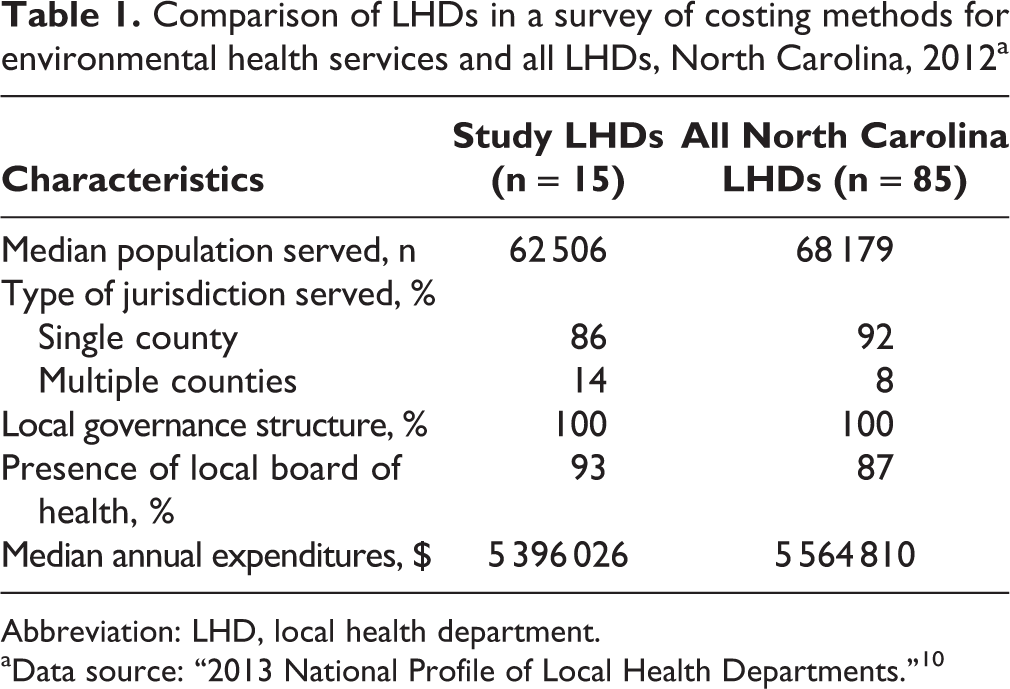
Abbreviation: LHD, local health department.
aData source: “2013 National Profile of Local Health Departments.” 10
This study estimated the full costs that LHDs incurred in providing the 2 largest EHSs: food and lodging inspections and on-site water services. Food and lodging services included, among others, conducting inspections, issuing permits, revoking permits, and investigating foodborne outbreaks. On-site water services included, among others, conducting site visits and evaluations, issuing permits, revoking permits, and investigating complaints. The full costs of a product or service included all direct and indirect costs. Direct costs included labor costs (ie, salaries and benefits for all employees involved in providing EHSs) and other direct costs (ie, space, equipment, supplies, subcontracts, travel, and other miscellaneous costs, such as utilities, insurance, and staff training). Travel costs in particular varied according to the geographic area covered by environmental health specialists. We measured indirect costs by including a service line’s use of shared, or overhead, resources. To obtain the cost per service (or unit cost), we divided total costs by total number of services provided. Services were defined in accordance with a standard set of activity codes used by all LHDs in North Carolina. We computed the total number of services as the sum of the services reported in each activity code.
Results
The average total spending per LHD for the 2 EHSs was >$700 000 in 2012. The average cost of a food and lodging inspection was $159 per service, and the average cost for on-site water services was $114 per service. Total costs and unit costs for both types of services varied widely (Table 2). LHDs that incurred lower unit costs for food and lodging inspections also tended to be more cost efficient in providing on-site water services (Pearson correlation coefficient = 0.45).
Reported costs of providing selected environmental health services at 15 local health departments, North Carolina, 2012
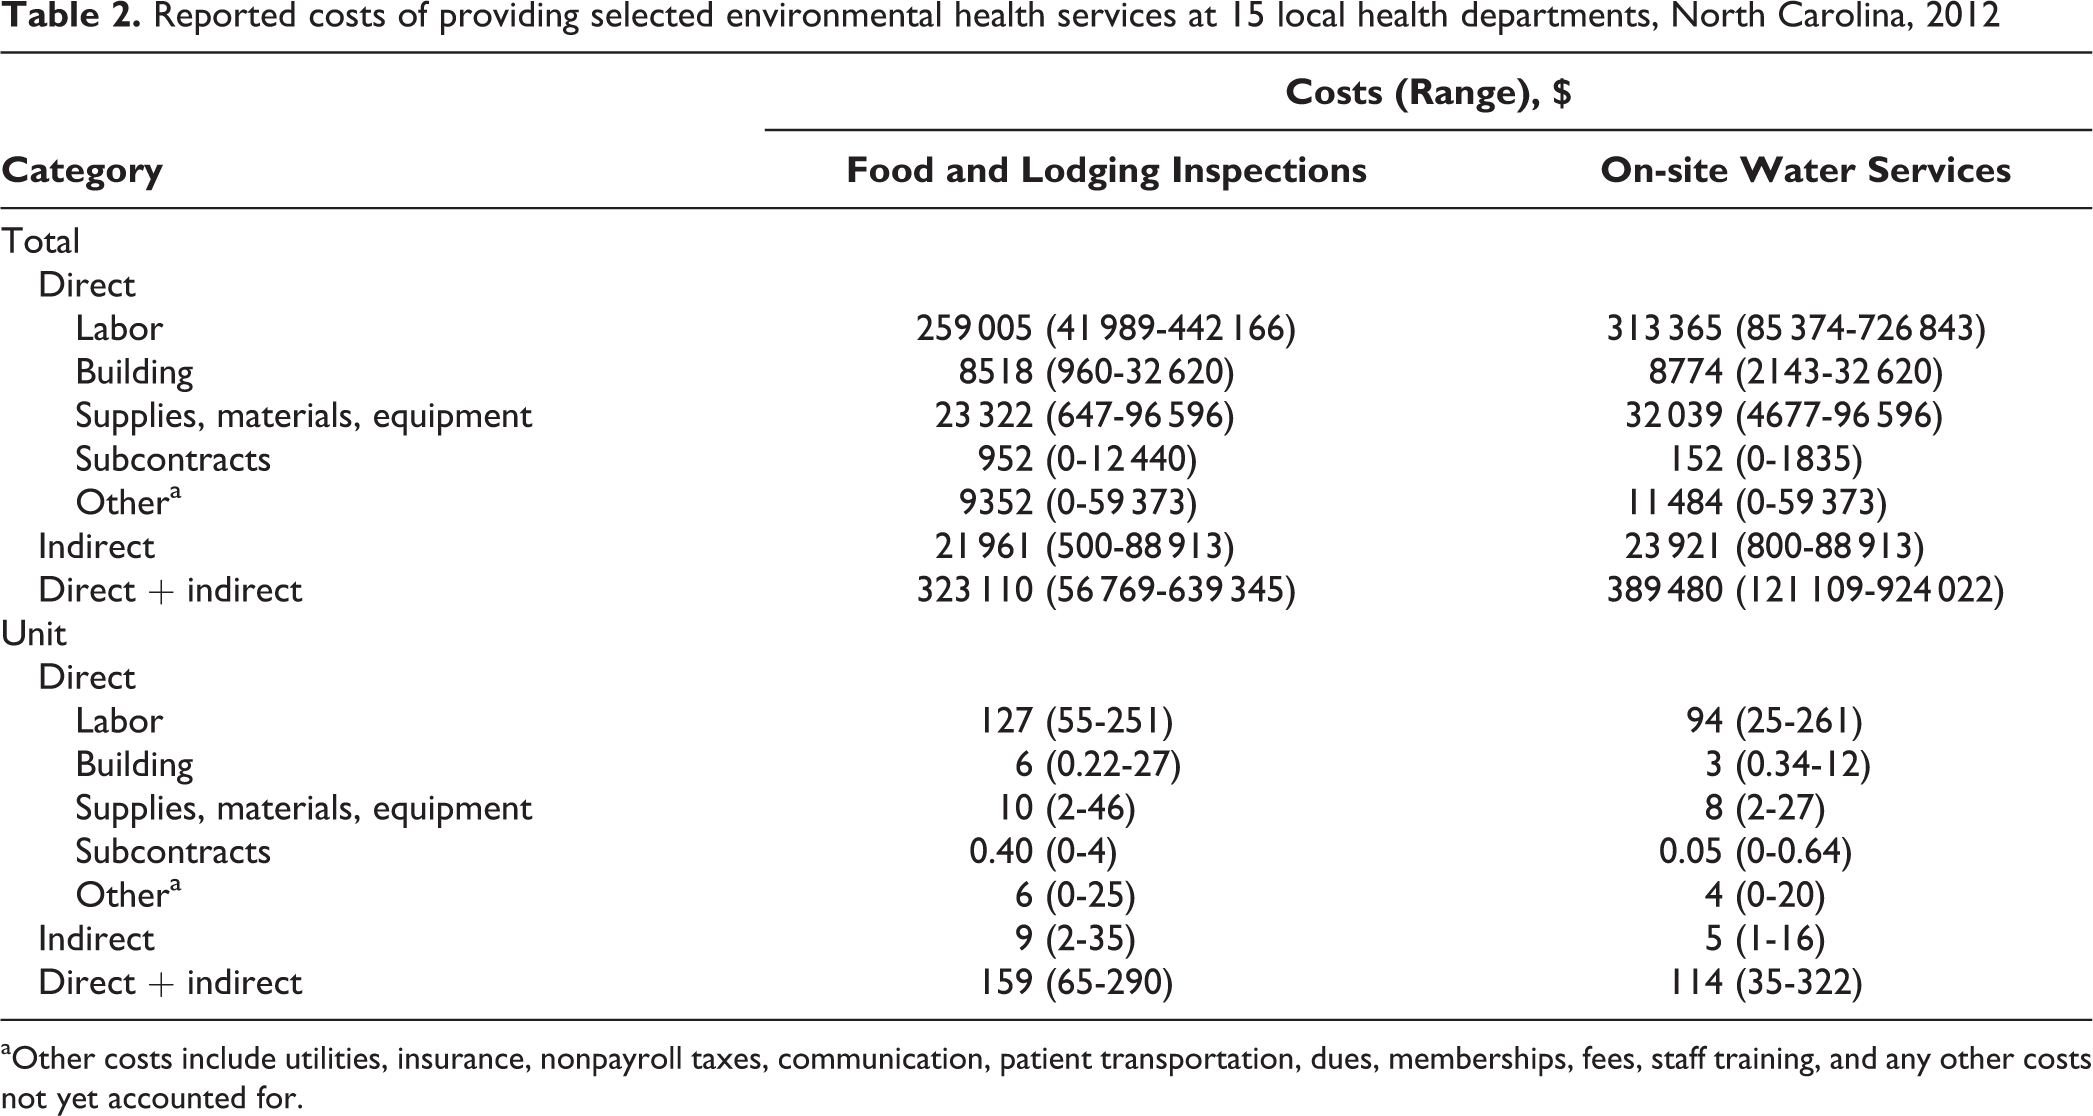
aOther costs include utilities, insurance, nonpayroll taxes, communication, patient transportation, dues, memberships, fees, staff training, and any other costs not yet accounted for.
Bivariate analysis showed that economies of scale likely explained some of the variation in costs across agencies. LHDs that provided more services in each of the 2 categories incurred lower unit costs (Figure). The Pearson correlation coefficient between unit costs and total services provided was –0.54 (P = .04) for food and lodging inspections and –0.74 (P = .001) for on-site water services. For every additional 1000 services provided, the costs for food and lodging inspections decreased by $28, and the costs for on-site water services decreased by $21.
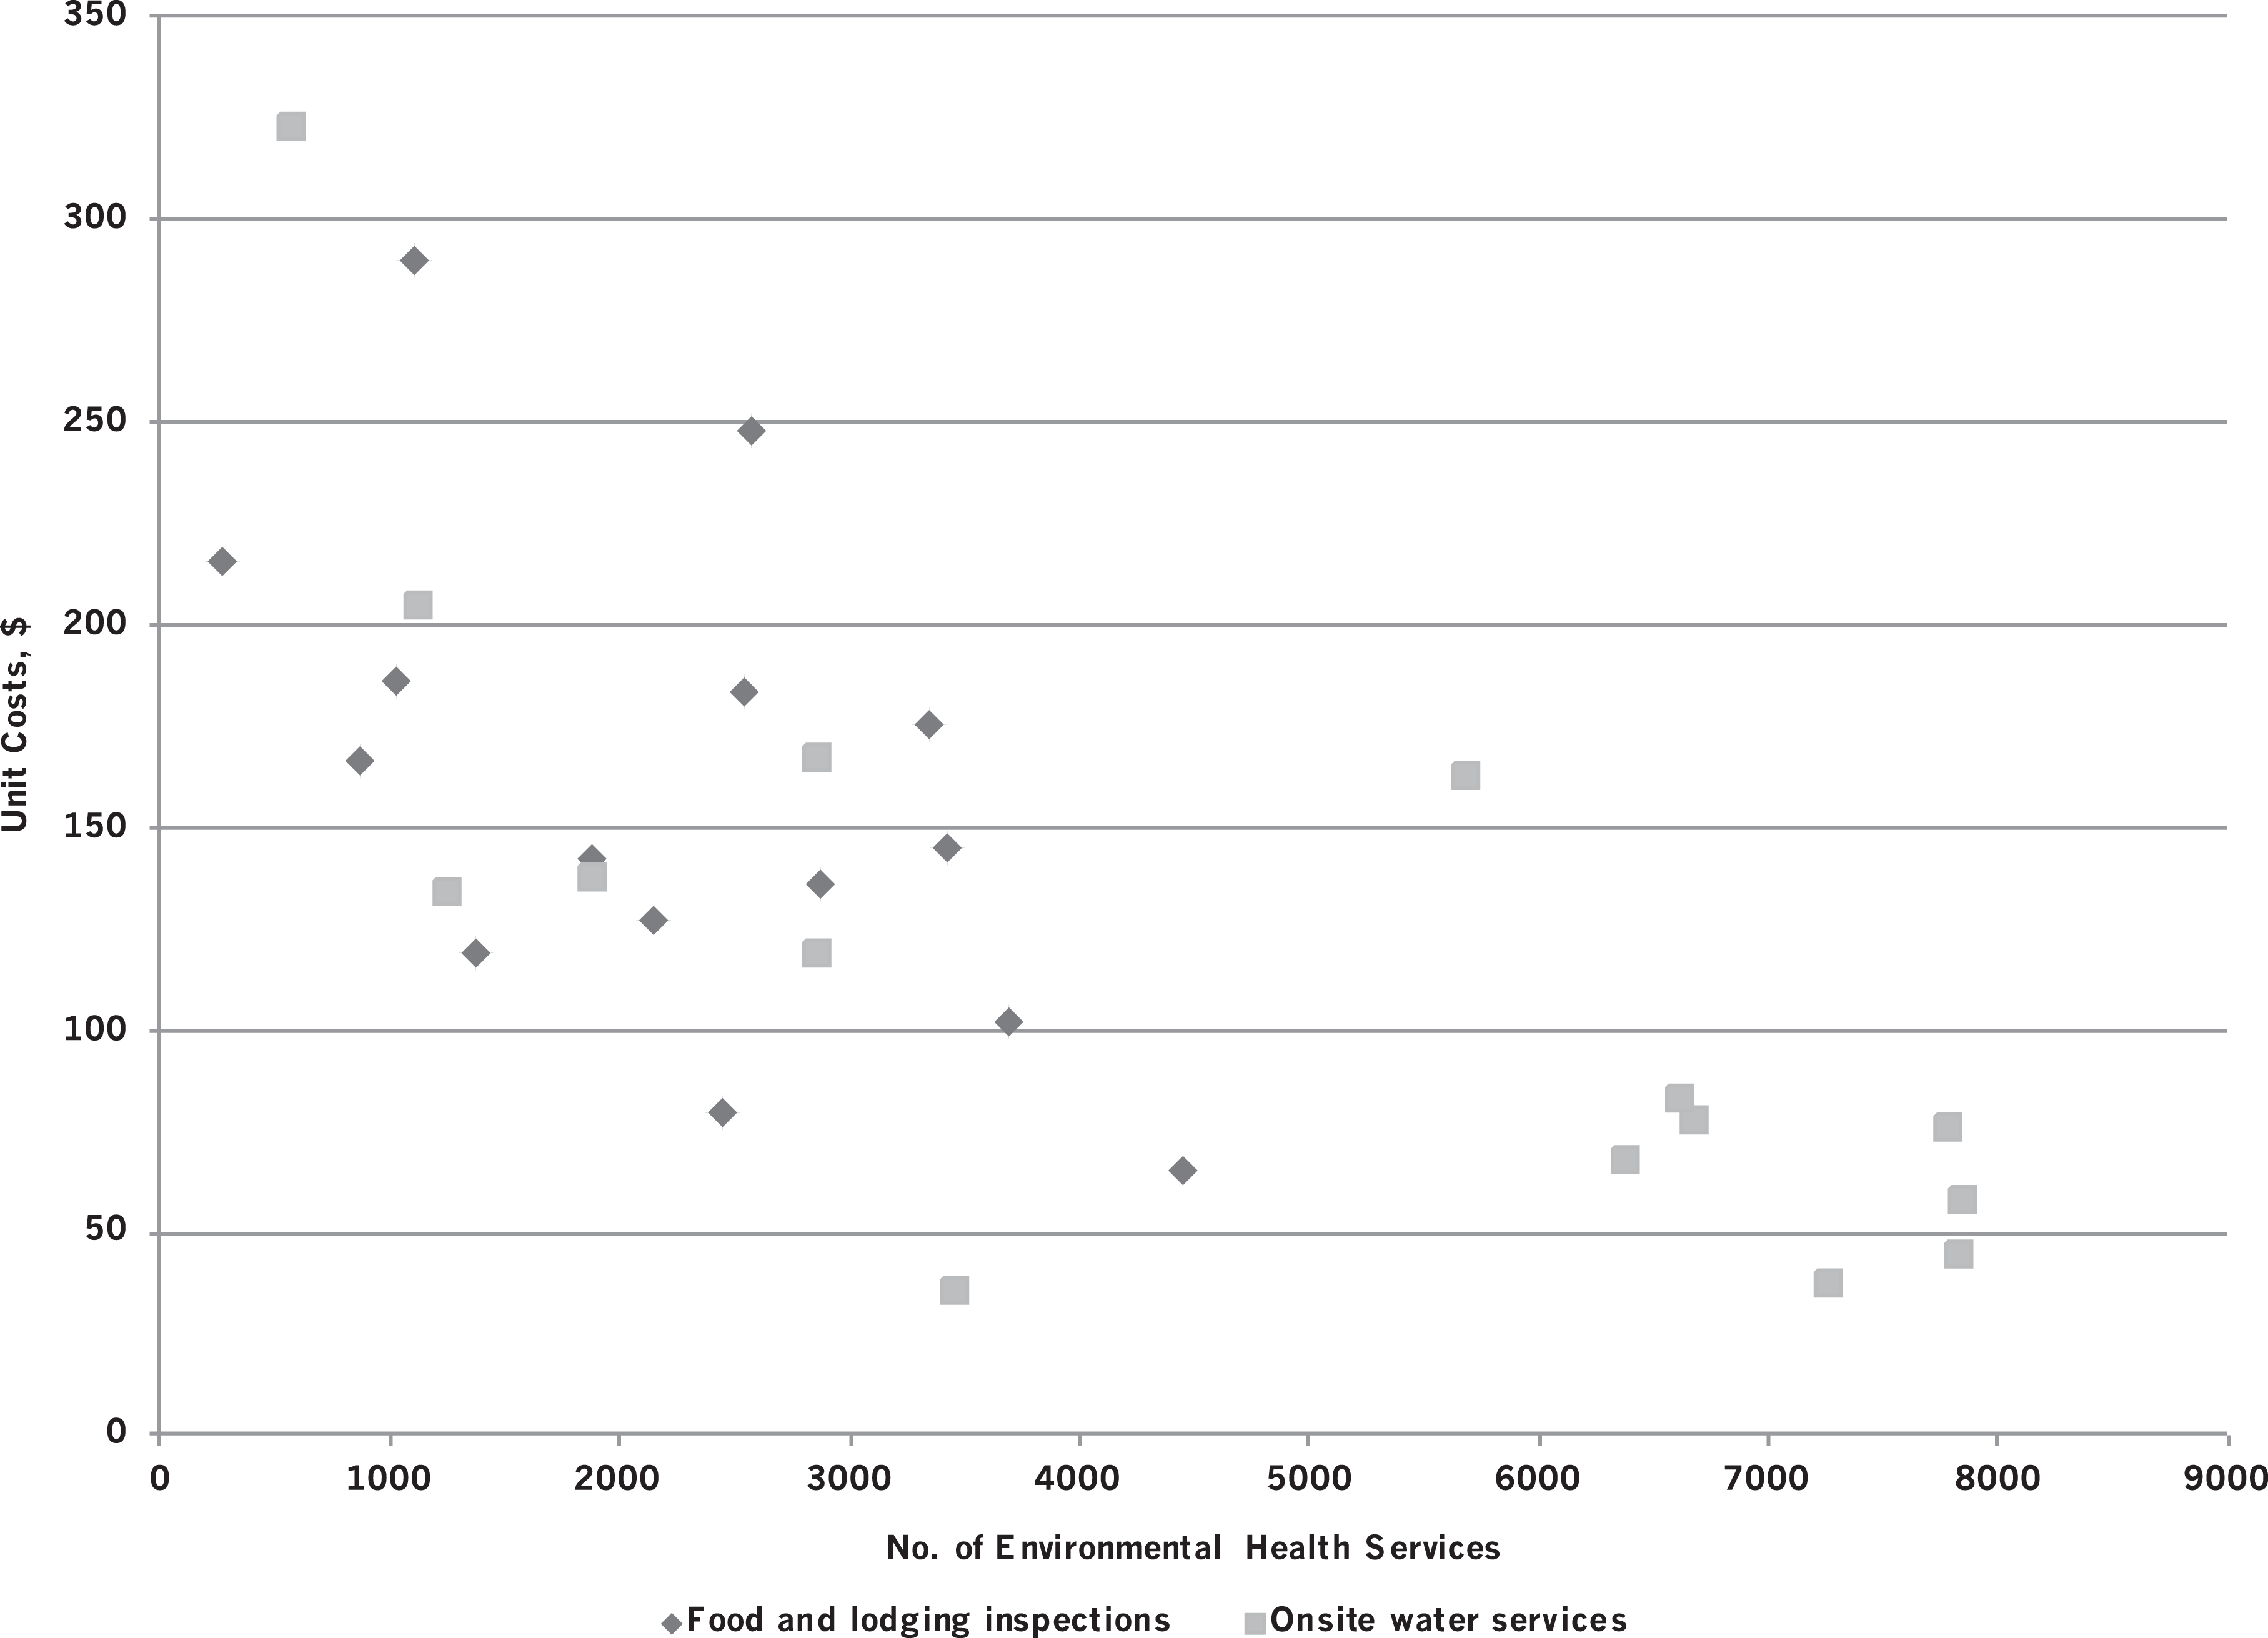
Relationship between total number of environmental health services provided and unit costs incurred at 15 local health departments, North Carolina, 2012. Environmental health services were defined in accordance with a standard set of activity codes used by all local health departments in North Carolina. The total number of environmental health services was computed as the sum of the services reported in each activity code. Examples of food and lodging services include conducting inspections, issuing permits, revoking permits, and investigating foodborne outbreaks. Examples of on-site water services include conducting site visits and evaluations, issuing permits, revoking permits, and investigating complaints
Bivariate analysis also showed that economies of scope might exist for some types of EHSs. Using information from the 2013 National Association of County and City Health Officials profile survey on the numbers of both EHSs and total public health services provided by LHDs, we found no correlations between the scope of services provided and unit costs for food and lodging inspections. For on-site water services, however, correlation analysis indicated a possible association between greater scope of service provision and lower unit costs. The Pearson correlation coefficient between unit costs for on-site water services and scope of EHS provision was –0.60 (P = .018).
For other key agency-level characteristics—including population size, population density, jurisdiction type, and geographic location—bivariate analysis found no significant relationships with the costs of providing EHSs.
Discussion
LHDs in North Carolina spent a substantial amount of resources providing EHSs, yet the costs of these services varied widely across agencies. Although the small sample size did not allow for multivariate analysis of the factors that drove these variations, bivariate analysis indicated that LHDs may be able to take advantage of economies of scale in providing EHSs. LHDs that provided more services incurred lower unit costs than LHDs that provided fewer services. This finding is consistent with studies of costs incurred by LHDs in other states. Based on administrative data from LHDs in Florida, for example, previous research found evidence of economies of scale across numerous essential public health services. 11,12 Results on scope of service are less clear. Although we found some evidence of economies of scope for on-site water services, we found no relationship between scope and unit costs for food and lodging inspections.
Limitations
This study had several limitations. First, data for this study came from a convenience sample of only 15 LHDs in 1 state, and data were collected for only 1 year, thus limiting the generalizability of our results to LHDs in other states and periods. Second, completing the cost survey was challenging for many study participants. Cost estimation is a resource-intensive task and was complicated by LHD budget procedures that did not easily lend themselves to splitting program costs among the 2 EHSs studied or identifying indirect costs. Third, our exploration of the factors that drove variation in costs was limited by the time-consuming, resource-intensive process of collecting primary data. Future research is needed to provide additional insight into factors that drive variation in costs, focusing on factors over which LHDs have some control (eg, wage structures, staffing mix, service mix, quality of services, efficiency of service provision).
Conclusion
This study is among the first to explore in detail the costs that LHDs incur in providing essential public health services. A better understanding of their cost structure can allow public health practitioners to improve their efficiency and effectiveness in providing key services and maximize the benefits to population health. In addition, cost information allows practitioners to evaluate the adequacy of existing funding and reimbursement for services. Cost estimates can be a starting point for the development of fee schedules that generate enough revenue to cover costs. Cost estimates can also be used to demonstrate the need for additional funding to policy makers and the community at large to ensure that local public health has the resources needed to provide services that are essential to the health and well-being of their communities.
Footnotes
Declaration of Conflicting Interests
The author(s) declared no potential conflicts of interest with respect to the research, authorship, and/or publication of this article.
Funding
The author(s) disclosed receipt of the following financial support for the research, authorship, and/or publication of this article: Funding for this study was provided by the Robert Wood Johnson Foundation.