
Abstract
Preventing eviction is a tractable, efficient way to reduce homelessness. Doing so requires understanding the precise geography of eviction. Drawing on more than 660,000 eviction records across seventeen cities, this study finds the geography of evictions to be durable across time. Rather than occurring when the status quo is disrupted, through gentrification or other modes of neighborhood change, eviction is itself the status quo in some pockets of American cities. The study shows that a few buildings are responsible for an outsized share of cities’ eviction rates. Focusing on three cities—Cleveland, Ohio; Fayetteville, North Carolina; and Tucson, Arizona—it finds that the one hundred most-evicting parcels account for more than one in six evictions in Cleveland and two in five evictions in Fayetteville and Tucson. Policy-makers looking to prevent homelessness can use the diagnostic tools developed in this study to precisely target high-evicting neighborhoods and buildings.
Because eviction is a direct cause of homelessness, upstream interventions that prevent displacement would effectively reduce homelessness. However, developing such interventions requires identifying the precise geography of displacement, an area of inquiry that researchers have so far neglected. Two conflicting bodies of work suggest evictions may occur in neighborhoods sporadically, during periods of transformation; or chronically, as a characteristic of concentrated, durable poverty. Understanding which view is most accurate will inform policies that address homelessness.
Drawing on more than 660,000 residential evictions in seventeen midsized American cities over the course of a decade, we show that the distribution of evictions is durable: a neighborhood’s contribution to the citywide eviction rate is highly correlated with its contribution a decade earlier. We extend this analysis to evaluate the distribution of evictions at the level of the building, focusing on three cities. We observe that evictions are heavily concentrated among a small subset of properties within each city. The one hundred most-evicting parcels account for more than one in six evictions in Cleveland, Ohio; and more than two in five evictions in Fayetteville, North Carolina, and Tucson, Arizona.
These findings have substantial implications for the design and implementation of policies and services meant to prevent families from becoming homeless. By showing that every year a handful of the same buildings produce outsized proportions of evictions in a city, this study provides a diagnostic tool that local officials can use to efficiently prevent displacement before it happens. Interventions that target property owners and tenants of the highest-evicting buildings could be more cost-efficient and effective than general, nontargeted interventions that neglect to focus on the communities and addresses where displacement is most acute.
Eviction and Homelessness
Recent government estimates suggest that roughly 568,000 people were homeless on a single night in 2019 (U.S. HUD 2019). This estimate is not a sufficient representation of the overall prevalence of homelessness because substantial majorities of the homeless population experience only brief periods of transitional homelessness (Kuhn and Culhane 1998; Phelan and Link 1999). Lifetime estimates suggest that between 5 and 6 percent of Americans have been homeless at some point in their lives (Shelton et al. 2009). Black and Latinx Americans, as well as those with limited incomes, experience homelessness much more frequently than their peers (Fusaro, Levy, and Shaefer 2018; see Olivet et al., this volume).
Housing markets structure the prevalence and risk of homelessness. Multiple studies have demonstrated that homelessness is more common when affordable housing is scarce (Lee, Tyler, and Wright 2010). For instance, one study found that urban families with infants who experience a severe illness were far more likely to experience homelessness if they lived in cities with higher housing costs (Curtis et al. 2013). In light of severe rent burdens, scarce affordable housing, and limited state support, housing loss has become a common experience in the lives of poor renting families (Desmond 2016).
The existing body of research and policy attention emphasizes reactive responses to homelessness by identifying the best ways to rehouse individuals after they are already homeless. Padgett, Henwood, and Tsemberis (2016) argue that policy-makers have coalesced around housing first programs, which prioritize rehousing individuals ahead of other assistance, as a means to end homelessness. By contrast, this study pursues a proactive approach by investigating homelessness at a common, tractable source: eviction. Eviction is both the culmination of an already precarious housing situation and the beginning of a more unstable period in the lives of the American poor (Crane and Warnes 2000; Desmond 2016). Even two years after the moment of displacement, evicted households are more likely to live at shelters and remain for a longer period than their nonevicted peers (Collinson and Reed 2019). The mark of an eviction makes it harder to secure stable and affordable housing, potentially prolonging spells of homelessness (Kleysteuber 2007).
If service providers and policy-makers could target individuals before they become homeless by preventing their eviction, they could intervene sooner and in a potentially more cost-efficient and effective way. Doing so, however, requires understanding the geography of eviction: identifying neighborhoods and even buildings responsible for the lion’s share of housing loss. Yet recent work has by and large neglected to provide policy-makers with a sufficient idea of where and when homelessness will occur (although see Culhane, Lee, and Wachter 1996).
Instead, researchers have presented two incompatible explanations as to how evictions are patterned over urban space and time. The first explanation centers around gentrification and implies that eviction is spatially diffuse across time. This perspective focuses on housing displacement during moments of significant neighborhood change (Marcuse 1985; Brown-Saracino 2017) by implying that evictions increase as a neighborhood gentrifies, as lower-income residents are replaced by more affluent newcomers; and decrease as the neighborhood turns over. As gentrification spreads over a city, it leaves spikes of eviction in its wake. This body of literature, then, suggests that evictions will be diffuse over time, their level rising in communities experiencing the strongest gentrification pressures before falling as those pressures ease and move to another section of the city.
The second explanation focuses on concentrated poverty and implies that eviction is spatially stable across time. Most low-income neighborhoods do not gentrify, particularly those with a majority-Black population (Hwang and Sampson 2014). Rather, neighborhood poverty levels are “stubbornly persistent” even in periods of substantial urban change (Sampson and Morenoff 2006). Indeed, neighborhoods retain their place in a city’s social structure across decades: poor neighborhoods stay poor while affluent neighborhoods retain their edge (Malone and Redfearn 2018; Rutan and Glass 2018). The persistence of poverty is characterized by a concentrated and correlated set of social maladies (Sampson 2012; Desmond and Western 2018), which implies that eviction will be spatially clustered over time, best viewed as an endemic feature of neighborhood disadvantage, not an unusual shock introduced by gentrification. Culhane, Lee, and Wachter (1996) lent empirical support to this perspective by demonstrating that homeless people in New York City and Philadelphia disproportionately came from a concentrated set of neighborhoods, a far more concentrated cluster of neighborhoods than demographic variables would imply.
The Geography of Evictions across Neighborhoods
Data and methods
In this study, we analyze the geographic distribution of evictions over time in American cities. We make two methodological departures from prior work. First, we examine midsized American cities. Although research on displacement and homelessness has tended to focus on global cities like New York and Chicago, in 2010 there were roughly twice as many renters living in large and midsized cities as there were in the nation’s ten largest cities. 1 Even cities such as Omaha, Nebraska, and Boise, Idaho, have pronounced affordability crises (Gudell 2016). Most of the nation’s homeless, furthermore, do not live in its largest cities. 2 Evidence-based policy requires research that reflects the broad geography of housing insecurity in the United States.
Second, we focus on evictions judgments—when a court has legally returned a property to a landlord—because they are a moment when renting households by definition lose their homes. While numerous studies have evaluated displacement as an outcome of another phenomenon such as gentrification or urban renewal, we consider eviction judgments as the core object of our analysis. In this way, our study evaluates where displacement originates over space and time.
Individual-level eviction court filings were collected by LexisNexis Risk Solutions and compiled by the Eviction Lab at Princeton University. Records were cleaned, geocoded, and validated against publicly available data sources published by county and state court systems. We include cases that resulted in an eviction judgment and were successfully geocoded to the address point or street block level. These cases represent formal, legally sanctioned evictions; informal evictions, where landlords displace tenants through a variety of extrajudicial (and occasionally illegal) means, are not reflected in our data. 3
We limit our sample to cities with populations between 150,000 and 1 million in 2010. We include cities where we have validated eviction data for at least 95 percent of the constituent census blocks. Of the seventy-nine cities (588 city-years) that met the initial criteria, we further restrict the sample to the seventeen cities with at least 10 consecutive years of coverage, selecting the most recent streak. We align the seventeen city-decades onto a common timeframe from year 1 to year 10. Overall, we include city-years ranging from 2003 to 2016. We observe each city before, during, and after the Great Recession. Our final sample includes cities across nine states located in the South, Midwest, and West. A full listing of the sample cities and supplemental analyses with additional cities are available in the online appendix (see Tables A1 and A2).
To evaluate the distribution of evictions across space, we aggregate eviction judgments to the census block, block-group, and tract levels. In total, we observe 663,957 eviction judgments across 170 city-years, 22,780 tract-years, 64,220 block-group years, and 1,349,190 block-years. We refer to census tracts and neighborhoods interchangeably.
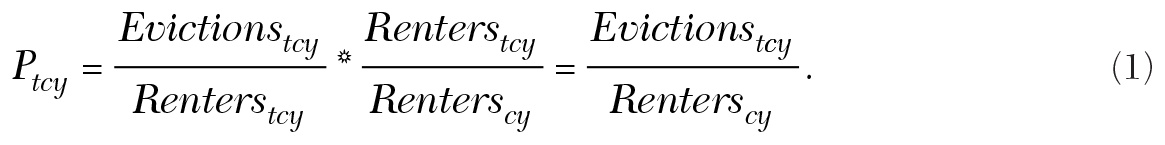
To compare the distribution of evictions across years, we decompose citywide eviction rates into neighborhood-level contributions. As equation 1 demonstrates, a tract’s (t) contribution to the eviction rate of city (c) in year (y) is its tract-specific eviction rate, weighted by the proportion of citywide renter households living in the tract. This simplifies to the evictions in the tract in a given year divided by the number of renter households in the city that year, meaning the value,
Results
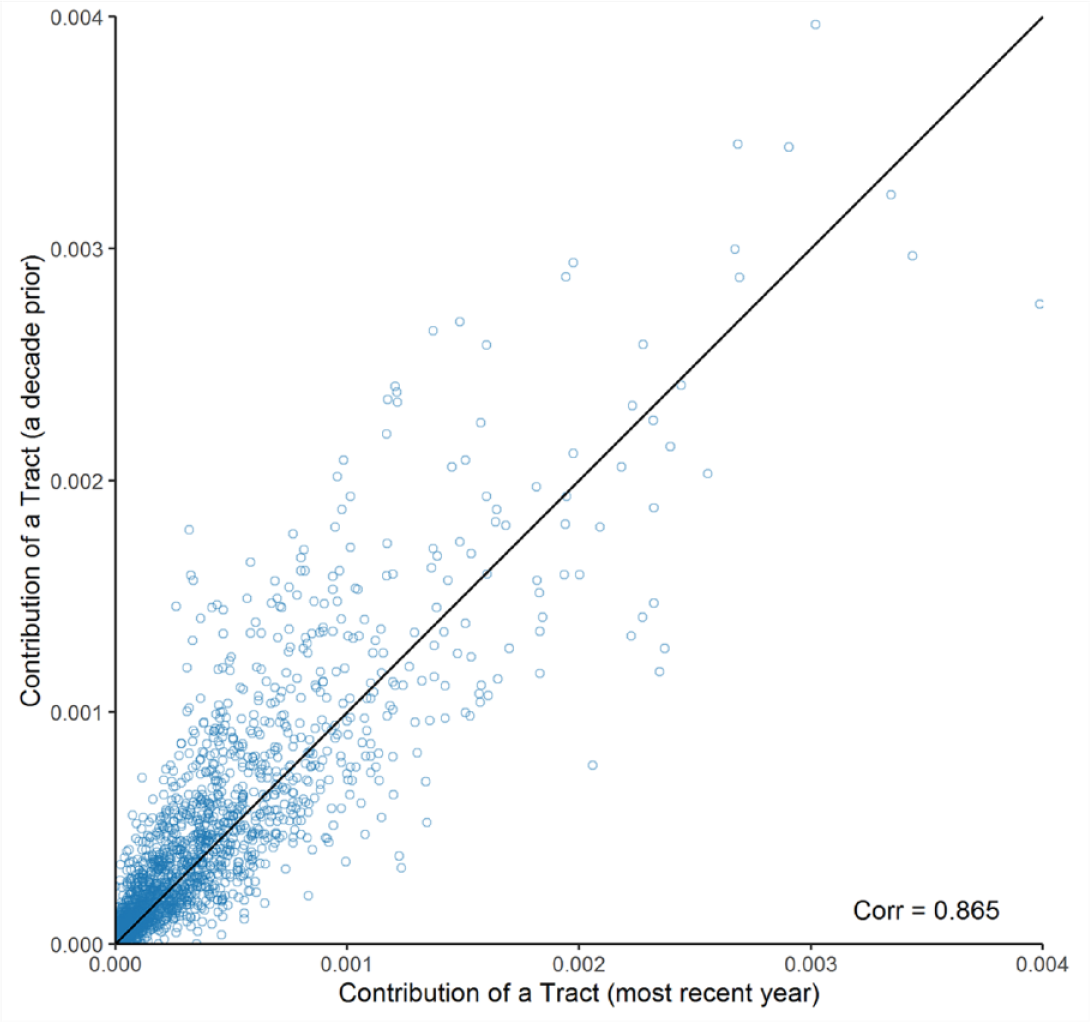
We find the distribution of eviction judgments among neighborhoods to be durable across time. In Figure 1, we plot the contribution of tracts in the most recent year against the contribution of tracts a decade earlier. There is a clear and strong correlation between a tract’s contribution to the citywide eviction rate in two different years, even a decade apart (r 2 = .865). In a given city, the highest-evicting tracts in the most recent year tended to also be the highest-evicting tracts a decade ago.
The Distribution of Evictions across a Decade
To further assess this durability, we decompose the total variance in eviction rate contributions over the course of the decade into differences between neighborhoods and differences within neighborhoods. Between-neighborhood differences are responsible for the vast majority of the overall variance (91.4 percent) during the 10-year period. The strong between-neighborhood differences indicate that the contributions of individual tracts to a city’s eviction rate are consistent from year to year and, by extension, that the distribution of eviction across tracts is consistent from year to year.
To evaluate whether neighborhood demographics explain stable differences between tracts, we regress a tract’s mean contribution to the citywide eviction rate on six demographic characteristics associated with both concentrated disadvantage and eviction: poverty rate, percent receiving public assistance, percent single-mother households, percent unemployed, percent children, and percent Black (Desmond 2016; Sampson 2012). The outcome—mean contribution—is calculated as the average number of evictions that occur in a tract in a given year offset by the average number of renter households in the city overall. We fit a Poisson model because the dependent variable is a count. The results, presented in Table A4 of the online appendix, show that the burden of eviction disproportionately falls on low-income, predominantly Black communities with large proportions of single mothers. However, the overall model explains only a small portion of the variance between neighborhoods (McFadden’s pseudo R 2 = .143). Fully understanding the acute concentration of eviction within tracts requires an approach that goes beyond identifying associations with neighborhood demographics.
The durable pattern of evictions may be explained by particular neighborhood dynamics. The correlation of eviction contributions over a 10-year period remains strong but relaxes at lower levels of aggregation: block groups (r 2 = .773) and census blocks (r 2 = .676). At first blush, this appears to imply that there is more variability at finer resolutions as evictions move around within neighborhoods; however, a decomposition of variance at the block level reveals that 79.4 percent of the variance across 10 years is driven by differences between city blocks rather than within them (see online appendix Table A5). There appears to be both a moderate degree of turbulence at lower levels of geography as well as a high level of persistence. This puzzle, paired with the limited explanation offered by neighborhood demographics, leads us to investigate patterns of eviction at the most fine-grained resolution possible: the building level. Figure 1 suggests that the distribution of evictions across neighborhoods is heavily skewed: the vast majority of tracts witness few evictions, if any, leaving a large portion of all evictions concentrated in a handful of tracts. How concentrated are evictions among buildings?
The Concentration of Evictions within Buildings
Data and methods
We evaluate the fine-grained geography of eviction by focusing on a subset of cities from our sample. In three cities—Cleveland, Fayetteville, and Tucson—we examine the distribution and trend of eviction judgments at the address level. Landlord-tenant laws, which vary across states and regions, can substantially influence the prevalence of eviction (Leung, Hepburn, and Desmond 2020). Accordingly, we sought a city from the South, the Midwest, and the West. We also considered the availability and quality of the parcel data needed for the analyses.
For each city, we gathered tax parcel data from the corresponding county government. These records are maintained by county appraisers to calculate property taxes and include information about ownership, land use, sales history, and the official address. We only observe one year of tax records for each city and therefore must assume that land use from one year held for the entire decade of eviction observations, a reasonable expectation according to previous research (Shertzer, Twinam, and Walsh 2018). These data allow us to identify the universe of residential buildings in each city and to locate the exact buildings that are producing evictions. We removed duplicates and parcels that do not plausibly have residential use (e.g., industrial sites, public utility buildings). We distinguish between residential parcels by estimating the number of dwelling units at each parcel. 5 Our sample includes 122,930 residential parcels in Cleveland, 64,516 in Fayetteville, and 149,222 in Tucson.
In the three sample cities, we observed 151,866 eviction judgments between 2004 and 2016. As described in the online appendix, we use a two-stage procedure to link 146,046 eviction records directly to parcels (96.2 percent match). We drop evictions linked to buildings with missing information.
First, we closely examine the degree to which the distribution of evictions is heavily concentrated among a small set of individual buildings. We begin our analysis by describing this skew and concentration. That most of the observed variation occurs between tracts and blocks suggests that there are certain buildings that evict sporadically while others repeatedly produce a large number of evictions. To empirically evaluate this insight, we focus on how different groups of buildings contribute to the overall prevalence of evictions within a city.
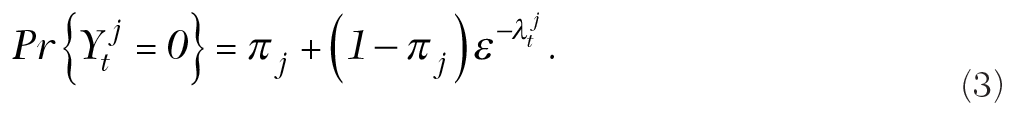
We use group-based trajectory models to identify groups of buildings that evict a similar number of tenants over time (Nagin 2005). As illustrated in equation 2, we expect the mean number of evictions (

Group-based models require the researcher to specify the number of groups. We separately estimate trajectory models for each city in our sample because we do not assume that the patterning of evictions will look the same in each city. Further, because we are interested in the distribution of evictions, we exclude parcels that never had an eviction when estimating the group-based models. We provide additional details about our modeling strategy, selection criteria, and model diagnostics in the online appendix.
Results
We assess the patterning of eviction judgments among 336,668 residential buildings located in three cities. There is large variation in how frequently landlords evict tenants from their buildings. Some owners evict sporadically or even just once in the decade, while others displace tenants every year. Over the span of a decade, evictions occurred in just a small subset (10.7 percent) of residential properties. In Table 1, we categorize buildings by how frequently owners evict their tenants. Cumulatively, 7,830 properties in Fayetteville, 9,047 in Tucson, and 19,005 in Cleveland ever experienced an eviction during the decade. For most buildings in our sample, landlords only evicted tenants in one year. The number of properties in each category falls as the measure of eviction frequency increases. We calculate the average number of evictions at a property by dividing the total number of evictions by the number of properties multiplied by the number of years where an eviction occurred. Among the sets of buildings that appear in eviction records in at least one but not all 10 years, owners evict, on average, about one tenant per year. These landlords evict with varying degrees of regularity, but they do not evict a large number of tenants.
Properties According to Frequency of Eviction
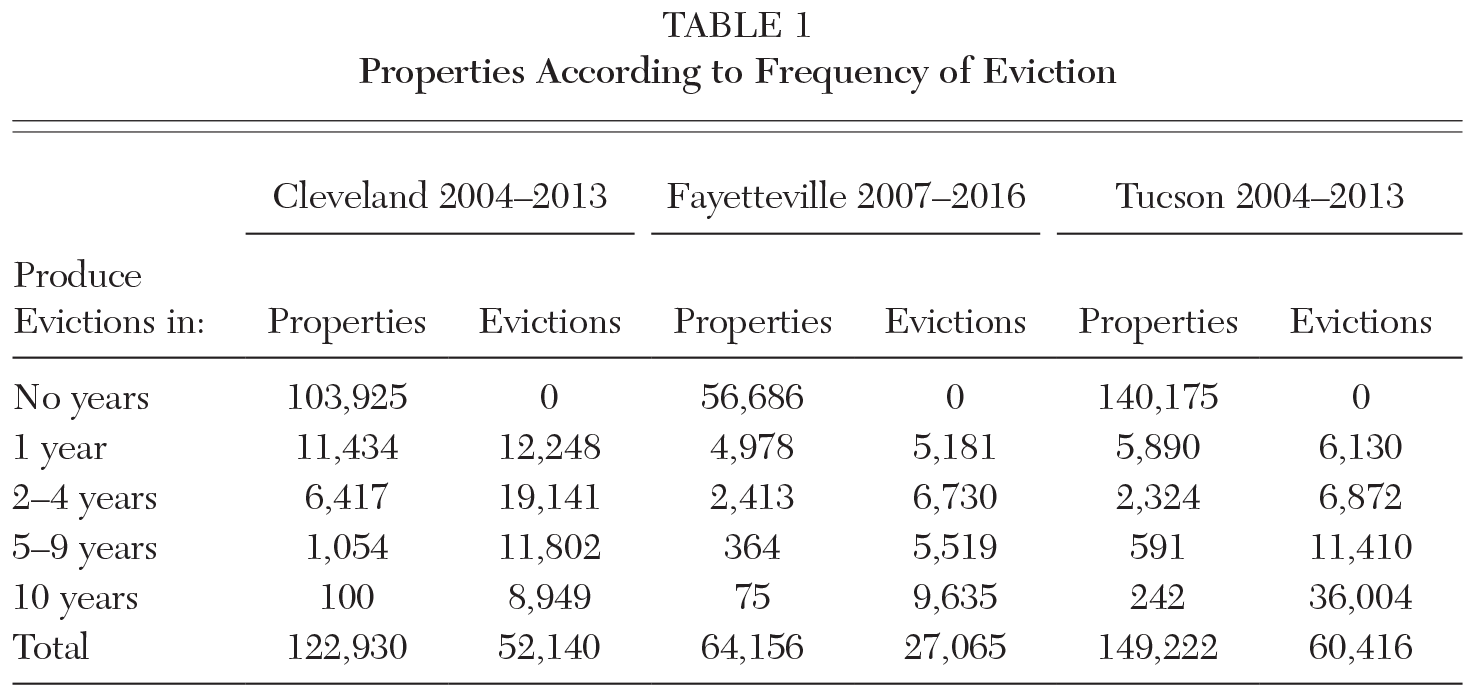
While the owners of most buildings evict infrequently, the owners of a handful of buildings in each city removed a tenant from their home every year. Not only did they consistently evict, but these landlords typically evicted many more tenants in any given year. On average, the owners who evicted tenants from their building in every year of our sample were responsible for evicting nine households in Cleveland, thirteen households in Fayetteville, and fifteen households in Tucson each year. While this small set of buildings accounted for a large portion of all evictions in all three cities, the 242 buildings in Tucson stand out for generating 60 percent of all evictions experienced by renters in a decade. In each city, select properties disproportionately drive overall levels of displacement.
Identifying and evaluating the handful of parcels that generate the most displacement in each city is critical to understanding the durability and concentration of evictions. The top percent of residential parcels produced 41.4 percent of all evictions in Cleveland, 60.4 percent in Fayetteville, and 83.7 percent in Tucson. The handful of parcels with the most evictions—the top 0.01 percent—produced outsized levels of displacement and were responsible for 5.9 percent of all evictions in Cleveland, 13.0 percent in Tucson, and 13.3 percent in Fayetteville. The highest-evicting properties in Cleveland are public housing, while in Tucson and Fayetteville they are privately owned. The concentration we observe could reflect the relative lack of public housing in Tucson (1.2 percent of housing units) and Fayetteville (1.5 percent) compared to Cleveland (3.8 percent). The lowest-income tenants in Tucson and Fayetteville may still be concentrated into a limited set of private buildings that will rent to them but be denied the rental assistance and institutional protection that public housing provides (Lundberg et al. 2020).
We identified the one hundred properties in each city that produced the most evictions over the course of a decade. In Table 2, we present the total number of evictions, the contribution to citywide levels of displacement, and the eviction rate. Table 2 shows that evictions in Fayetteville and Tucson are heavily concentrated among a small set of buildings. The top one hundred buildings produced 41.5 percent and 43.8 percent of all evictions in the two respective cities. In Cleveland, the top one hundred buildings produced a substantial but relatively less extreme portion of evictions in the city (18.5 percent).
The One Hundred Most-Evicting Properties in Three Cities
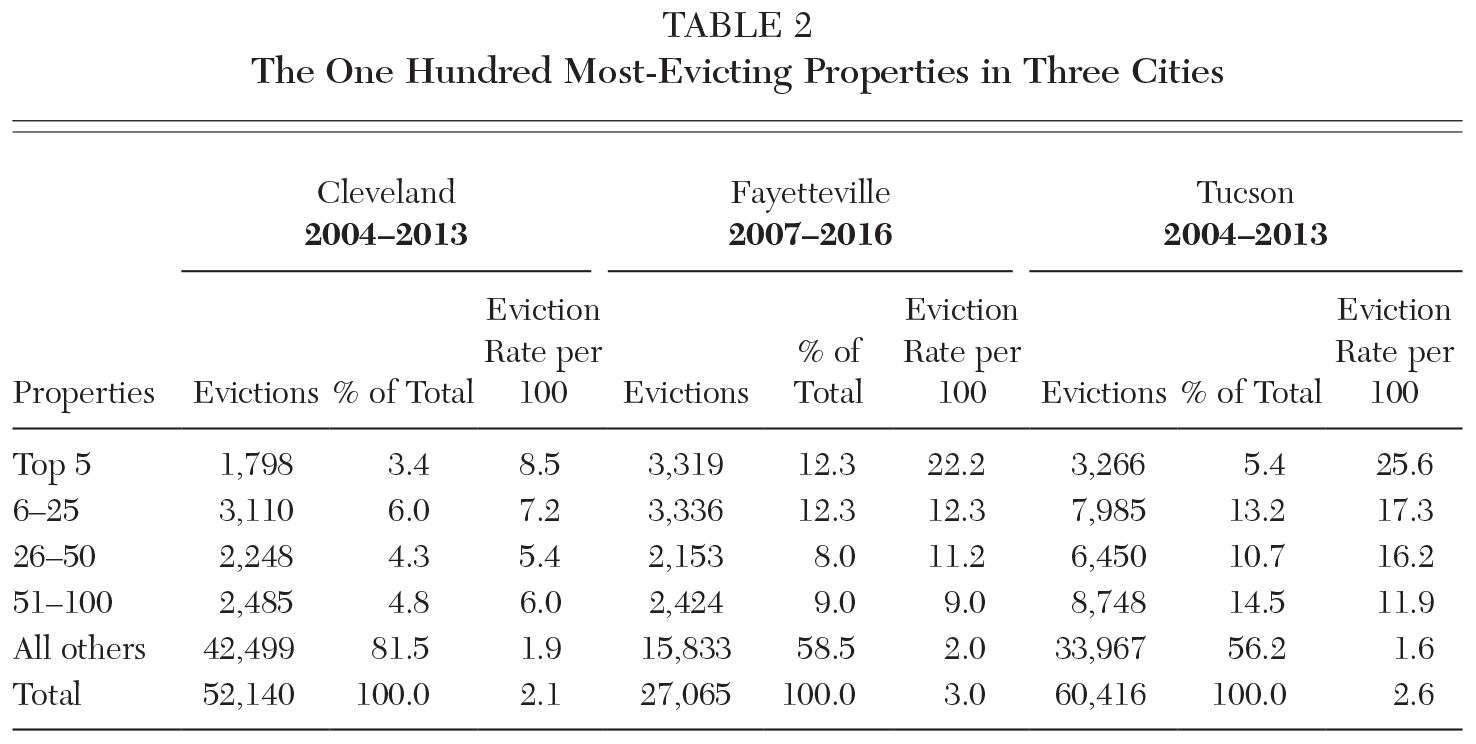
From a policy-maker’s perspective, knowing the buildings responsible for the most evictions in a city enables targeted interventions, regardless of the size of the building. However, to determine if high-evicting buildings are simply those with the greatest number of tenants, we calculated a property-specific eviction rate by dividing the average number of evictions in each year by the number of dwelling units associated with the parcel. As the third column for each city in Table 2 shows, even after adjusting for the number of units in these buildings, evictions are far more common in the small set of one hundred buildings than the rest of the city. Not only do the upper tail of buildings produce a substantial number of evictions; their owners also evict at a staggering rate. Based on the number of dwelling units, the landlords of the top five buildings evict an estimated one in twelve households in Cleveland, one in five in Fayetteville, and one in four in Tucson each year. Tenants in high-evicting buildings were nearly ten times more likely be evicted in Tucson, more than seven times more likely in Fayetteville, and more than four times more likely in Cleveland than the average tenant in the city.
Evictions are more concentrated than the demographic characteristics of neighborhoods would suggest. In Figure 2, we map the prevalence of eviction in high-poverty neighborhoods (census tracts with poverty rates greater than 20 percent) in Tucson. In this map, the number of evictions during the decade is represented by the height of the building. Only residential buildings in high-poverty neighborhoods are presented on this figure, which features a set of contiguous high-poverty neighborhoods (forty of the sixty-four total) in Tucson. As Figure 2 shows, the buildings that produce the most evictions tower above the rest of the buildings in their neighborhood and the city. Additionally, high-poverty neighborhoods in Tucson witnessed two out of every three evictions in the city (65.7 percent), but the large majority of residential buildings in these neighborhoods (90.4 percent) produced no evictions between 2004 and 2013. Although neighborhood demographic characteristics such as poverty are crucial to understanding who bears the burden of eviction, aggregate numbers mask substantial variation within these communities. Much of the displacement experienced by the urban poor is anchored in a handful of buildings that experience acute and persistent instability.
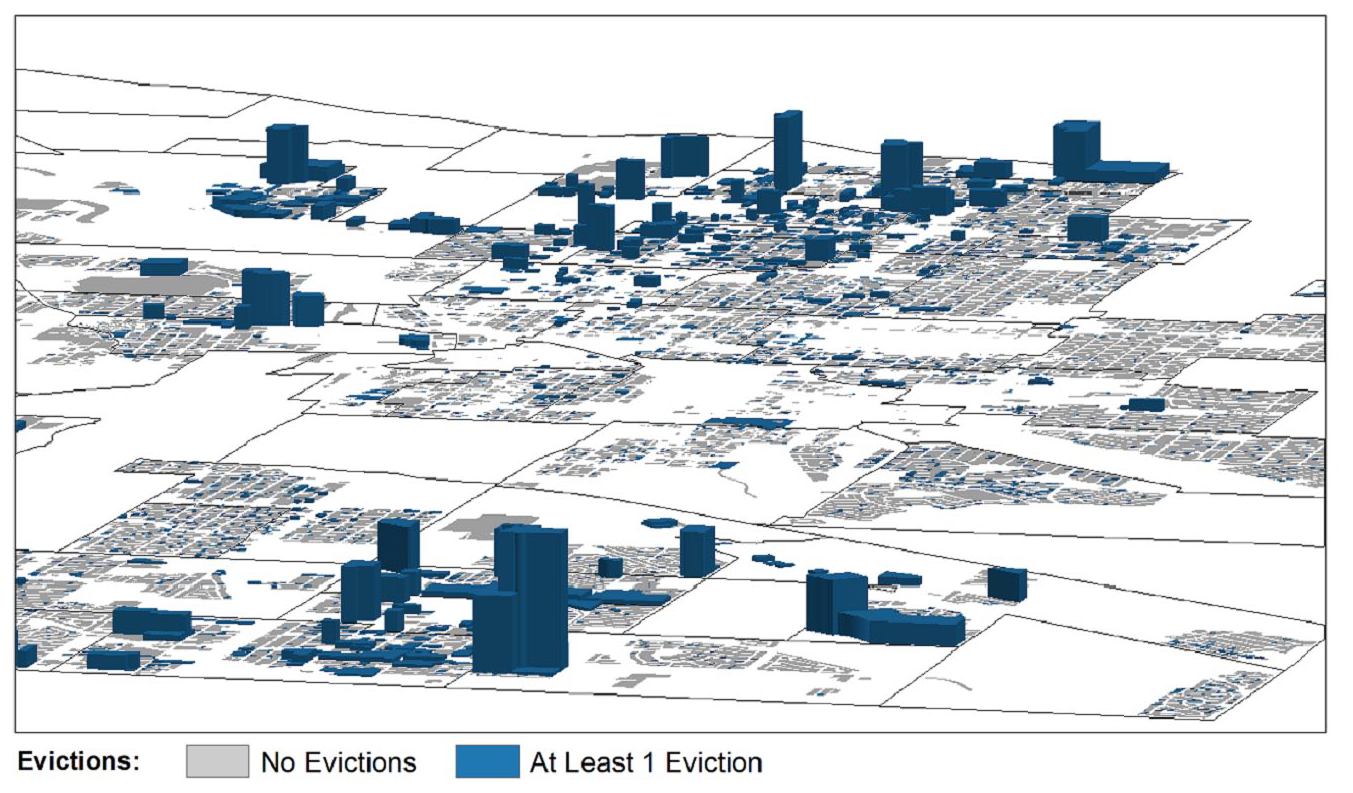
Eviction in Tucson’s High-Poverty Neighborhoods
Finally, we evaluate how the owners of high-evicting buildings contribute to the durability of eviction over time. We use group-based trajectory models to identify common trends among buildings in the number of eviction judgments over the decade in each of the three cities. In Figure 3, we plot the expected trajectory for each group of similarly evicting buildings across time. In all three cities, a large number of buildings belong to either of two groups (hollow square and hollow triangle) whose owners evict rarely and produce, at most, one eviction in a year. Both groups hover just above the x-axis for the duration of the decade. Because these patterns are so similar to one another in all three cities, we refer to these buildings as sporadic evictors. Across the three cities, 98.6 percent of properties with evictions fit this pattern.
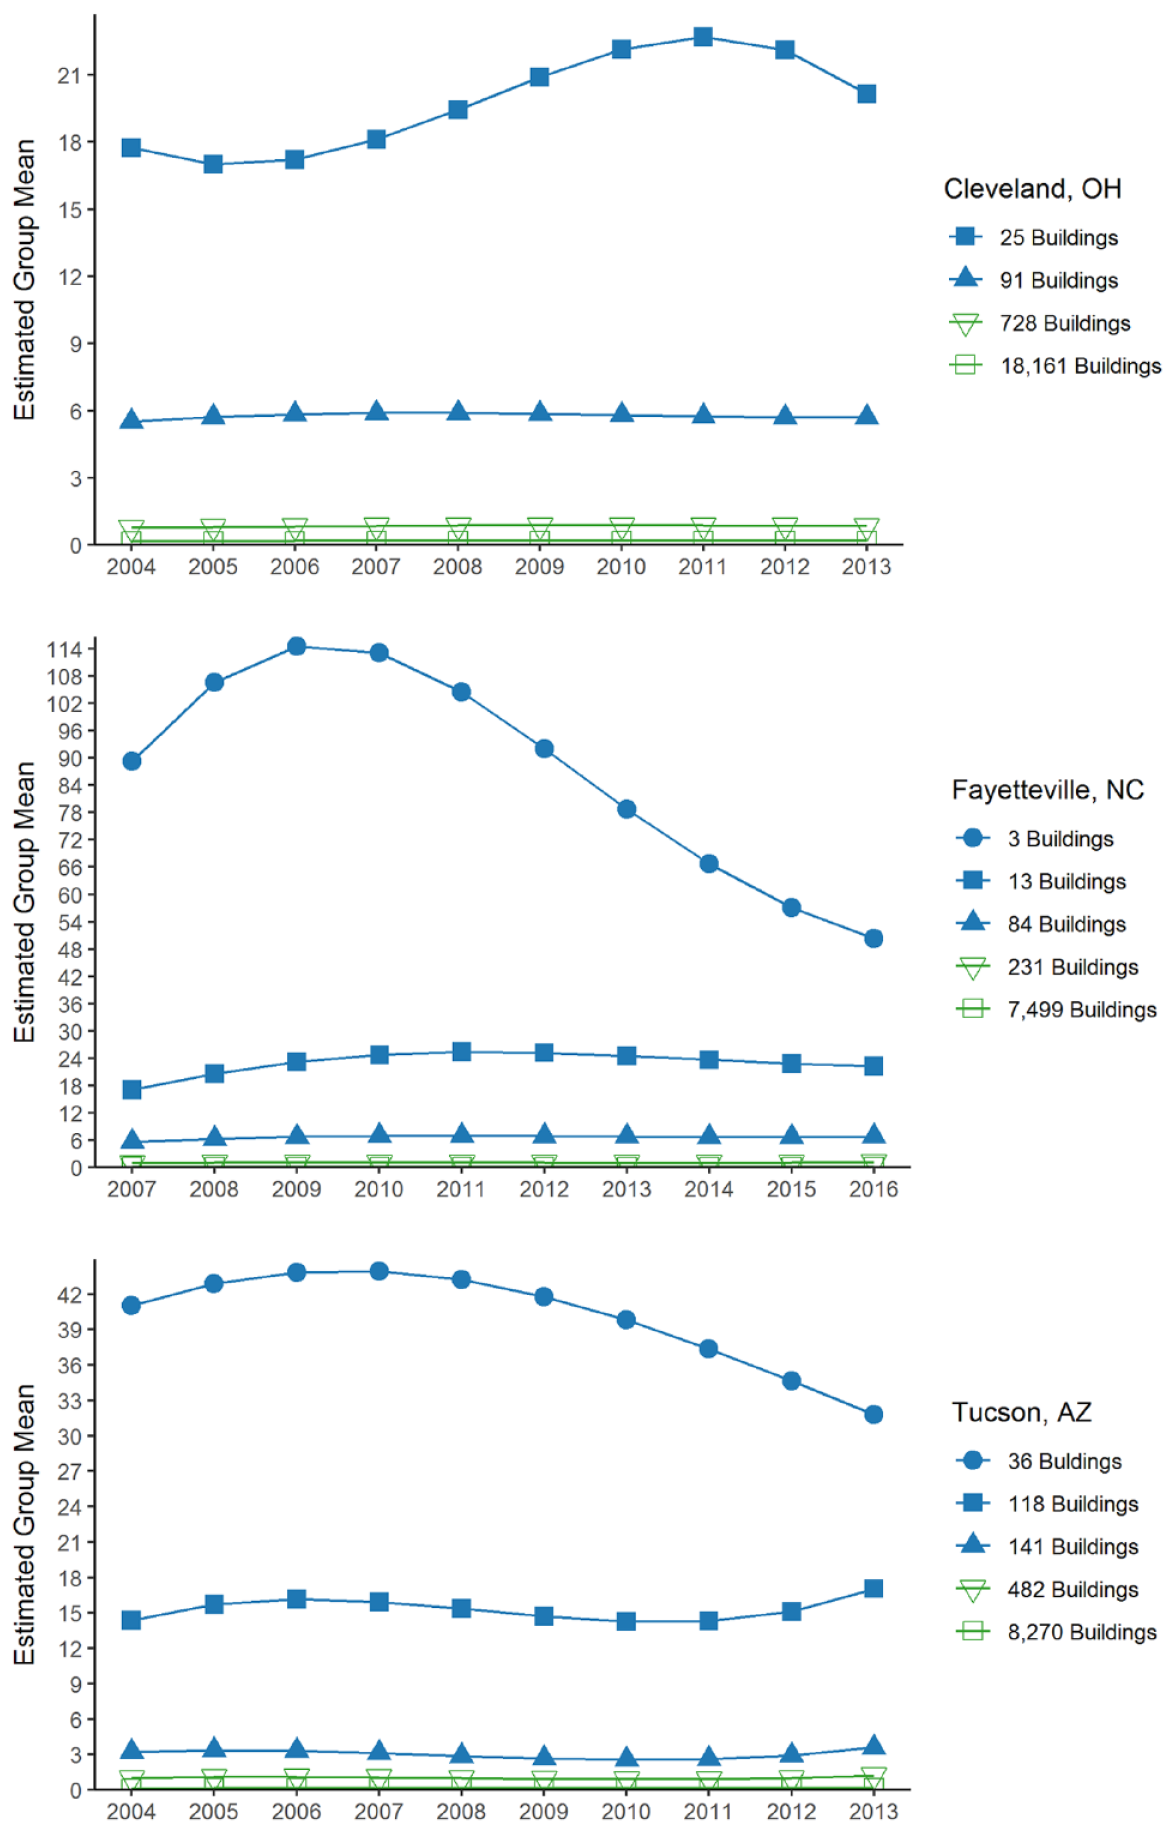
Average Eviction Counts for Groups of Buildings
Other groups of buildings were estimated to produce a large number of evictions in each year of the decade. The solid triangle represents a third pattern present in each of the cities. In Fayetteville and Cleveland, there are 175 properties that evict roughly six households every year. In Tucson, 141 properties evict three times per year, on average. The patterns of the remaining groups vary the most, both across time and across the cities. Regardless of the variation, all of these buildings evict a large number of tenants year after year. In total, 195 buildings resembled the solid square or solid circle trajectories across the three cities. Altogether we refer to the 511 buildings that consistently produce multiple evictions in each year as stable evictors.
In each city, the small set of stable-evictor buildings was responsible for large portions of the overall displacement in the city. In Figure 4, we plot the contribution of the stable and sporadic groups to a city’s overall eviction rate in each year in the decade. Sizable portions of the citywide burden of eviction are attributable to the stable evictors. These buildings produce about one out of every five evictions in Cleveland, two out of every five in Fayetteville, and two out of every three in Tucson.
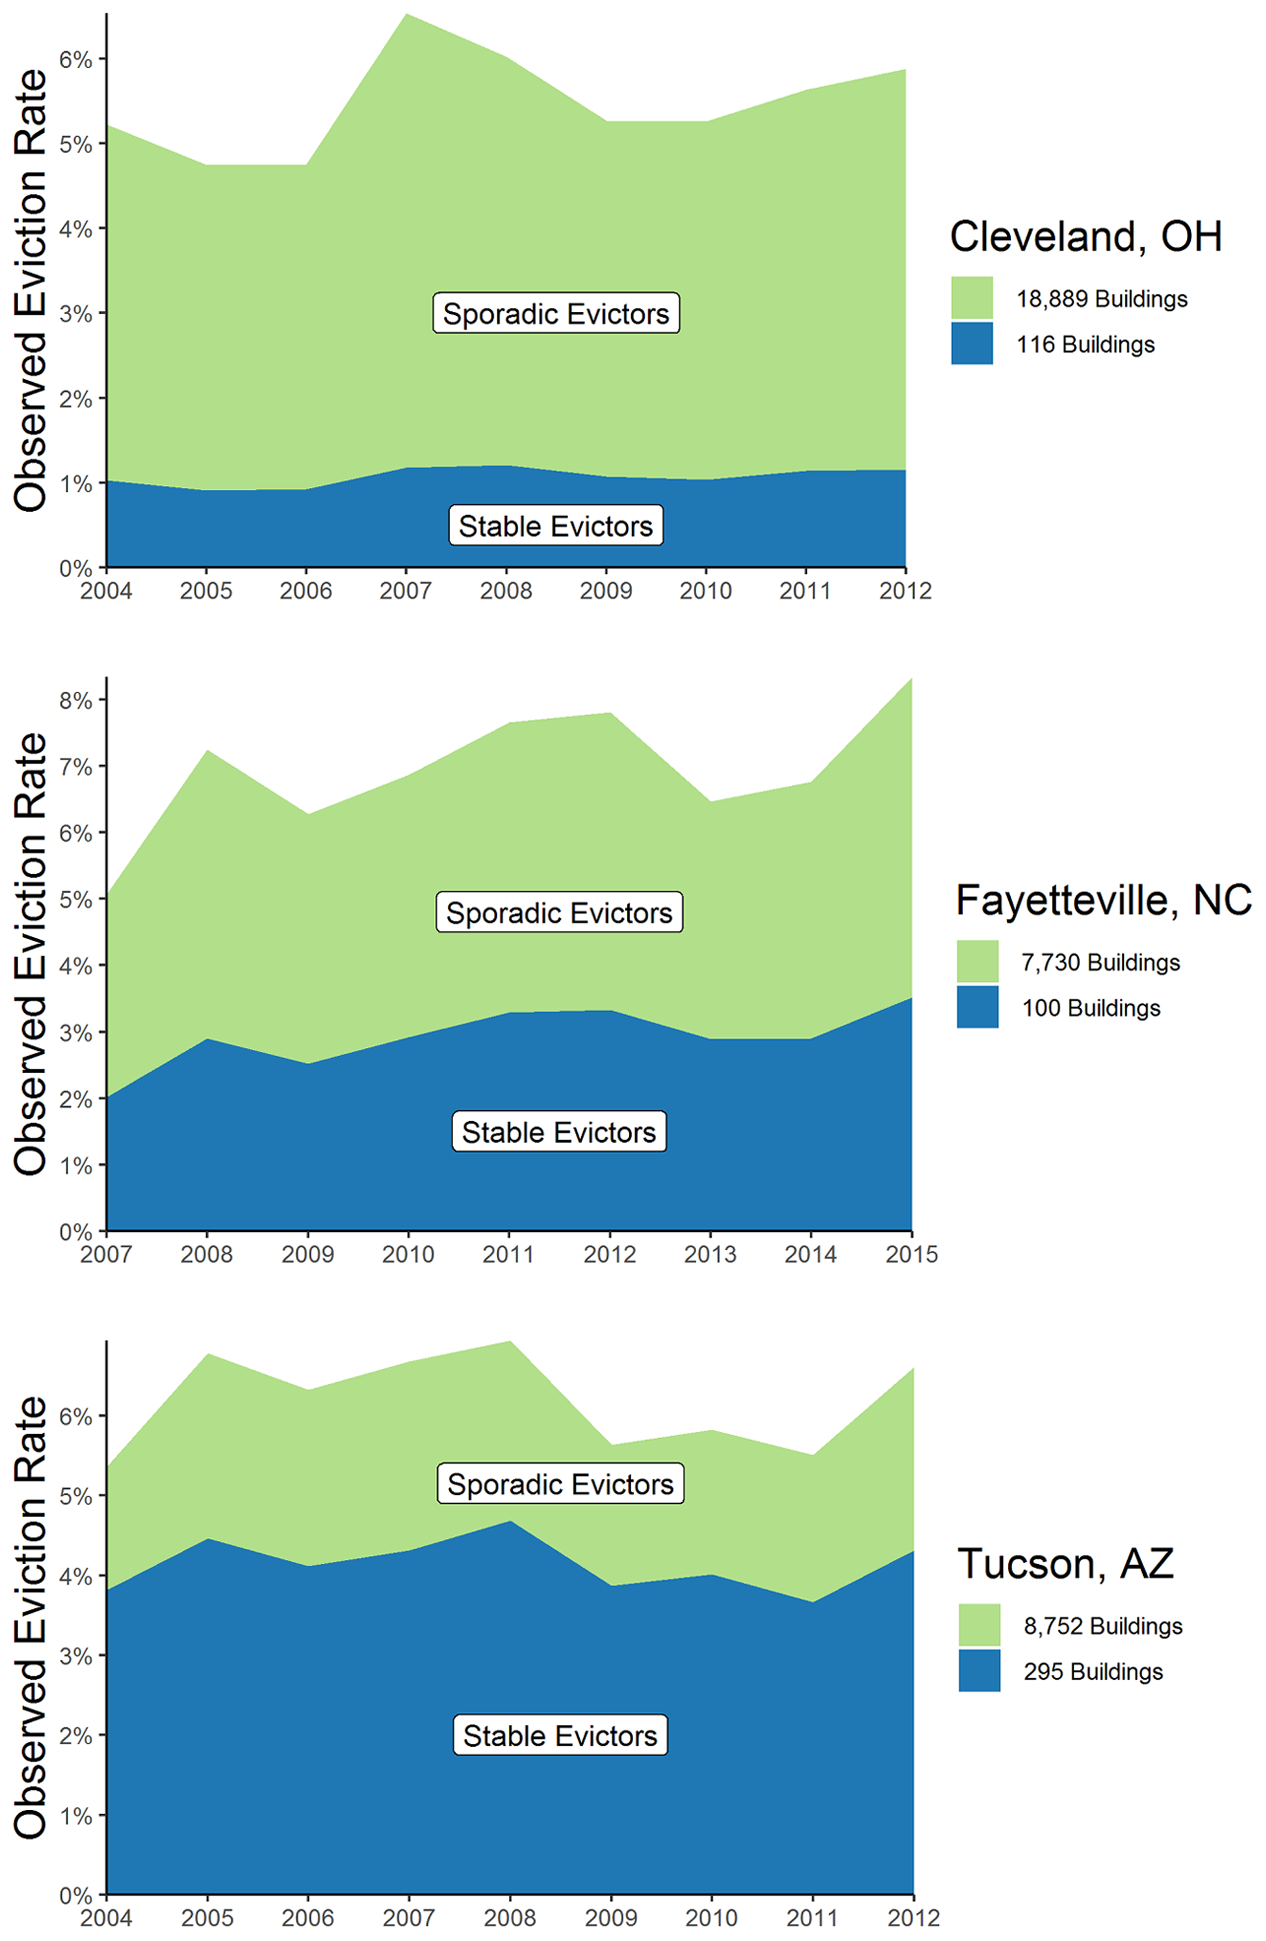
Contribution of Stable Evictors to Citywide Displacement
The trajectories estimated by our models are modestly sensitive to year-to-year changes. However, we found no evidence of eviction becoming suddenly prevalent in low-evicting buildings or suddenly rare in high-evicting buildings. We also found no evidence that the geography of eviction systematically shifted across any city within our decade timeframe. Instead, our model demonstrates the consistent durability of evictions within a small number of buildings.
Discussion
This study evaluated the distribution of eviction judgments in seventeen cities over the course of a decade. We found a strong correlation between a neighborhood’s contributions to the citywide eviction rate, even when comparing two years a decade apart. We also found that nearly all of the variation was attributable to differences between neighborhoods, implying limited change within communities. We extended this analysis to the building level in three cities—Cleveland, Fayetteville, and Tucson—finding the distribution of evictions at specific addresses to be durable across time. A small set of buildings and neighborhoods are entrenched sources of instability. Those who become homeless through eviction will pass through the same landlords and same neighborhoods as those who became homeless through eviction the year prior.
In Cleveland, Fayetteville, and Tucson, we observed that the five highest-evicting parcels generated large portions of all evictions, ranging from 3.4 percent of evictions in Cleveland to 12.3 percent in Fayetteville. This concentration was not explained by the distribution of renters. A household in the top five parcels is four times more likely in Cleveland, seven times more likely in Fayetteville, and ten times more likely in Tucson to be evicted than another household elsewhere in the city. Not only do a handful of buildings create far more housing instability, but tenants in these parcels are far more likely to face eviction.
The housing crisis looks different in each of the three cities that we examined. This heterogeneity is partially explained by variation in the institutional practices of landlords themselves. For instance, in Fayetteville, the single highest-evicting parcel produced 4.6 percent of all evictions in the city during the decade that we examined, averaging 137 evictions every year until it was sold in 2015. The new management carried out only thirty-seven evictions the following year. In Cleveland, the five highest-evicting parcels were all public housing developments. But in Fayetteville and Tucson, all were privately owned. In Cleveland, the Cuyahoga Metropolitan Housing Authority operated 3.8 percent of housing units and carried out 8.7 percent of all evictions in the city. In comparison, Fayetteville’s Housing Authority operated 1.5 percent of housing units and carried out 4.2 percent of all evictions, while Tucson’s Housing Authority operated 1.2 percent of housing units and carried out 3.1 percent of all evictions.
Evictions are anchored in place. Classically, scholars have considered displacement to occur within moments of neighborhood change with rising rents destabilizing already strained but stable households. By contrast, we document how eviction and displacement are themselves the status quo in some pockets of American cities. The concentrated disadvantage literature has demonstrated that in some neighborhoods myriad forms of social problems coincide and compound upon one another to form a “durable tangle” of inequality (Sampson 2012). Eviction, displacement, and homelessness are woven throughout this knot. Eviction precipitates not just acute housing need but job loss, frayed social ties, depression, and downward mobility (Desmond and Kimbro 2015; Collinson and Reed 2019). In a few pockets of American cities, the substantial and sustained churning among residents who are being evicted undermines neighborhood stability for everyone.
This study has several limitations. For one, it focused on a subset of midsized American cities. Supplement analyses suggest the pattern exists in major cities such as Chicago or Phoenix (see online appendix Table A2). However, we encourage researchers to extend our analysis to cities like San Francisco or Washington, D.C., that have experienced substantial gentrification. Additionally, this study likely underestimates the degree to which evictions are concentrated in urban space. In our analysis, ten parcels owned by one landlord would appear as ten distinct observations even though they could arguably be evaluated as one unit. Owing to the proliferation of the use of limited liability corporations (LLCs) (Travis 2019), identifying the owner of properties listed under multiple LLCs is difficult. Future research should evaluate how concentration in land ownership influences the concentration of evictions.
Finally, researchers may uncover mechanisms that create durability and concentration by evaluating variation between landlords and cities. Perhaps the high-evicting properties are best characterized as sites of exploitation where landlords minimize costs by disinvesting and accruing copious building violations and maximize profits by charging deposits and fees to a large number of tenants. Under this mechanism, variation across cities is the product of laws that reduce liability for landlords and barriers to eviction. It is also plausible that the private market, much of which refuses to serve low-income or disadvantaged tenants (Desmond 2016), restricts vulnerable tenants to the limited set of buildings that will serve them. Here, the variation across cities would be explained by the generosity of public support (e.g., public housing, housing choice vouchers) that moderate the population of renters in precarious housing situations.
This work holds value for policy-makers and service providers working to prevent eviction and homelessness. By developing descriptive analyses that can be used to identify and target hotspots of instability, this article serves as a diagnostic tool for identifying households at risk of homelessness. Our analysis revealed two properties of eviction’s geography critical for policy: durability and concentration. The durability of evictions implies that it is possible to anticipate which buildings are most likely to evict the most tenants, while their concentration suggests that precisely targeted interventions can efficiently reduce housing instability where it is most acute.
Because a handful of properties produce an outsized proportion of evictions, service providers can make outsized progress toward alleviating the risk of homelessness by targeting a handful of properties, bringing about substantial reductions in the citywide eviction rate by limiting instability in the small set of buildings that consistently evict a large number of tenants. To illustrate how this might work, consider a Legal Aid clinic looking to represent tenants in housing court. Instead of setting up in eviction court, where most tenants do not appear (Desmond 2016), our research implies that the clinic would be more effective if it directly targeted the five parcels in its city reliably shown to evict the most tenants. Organizations could also partner with landlords to prevent evictions and homelessness, using these diagnostic tools to pinpoint sources of instability and approach the landlords to create alternatives for those households at risk. Alternatively, cities could rely on fines, license revocations, and other sanctions to hold high-evicting landlords, including public housing authorities, accountable for disproportionately contributing to the city’s overall levels of residential instability and homelessness.
Supplemental Material
sj-pdf-1-ann-10.1177_0002716221991458 – Supplemental material for The Concentrated Geography of Eviction
Supplemental material, sj-pdf-1-ann-10.1177_0002716221991458 for The Concentrated Geography of Eviction by Barrett A. Lee, Marybeth Shinn, Dennis P. Culhane, Devin Q. Rutan and Matthew Desmond in The ANNALS of the American Academy of Political and Social Science
Footnotes
Note:
The JPB, Gates, and Ford Foundations, as well as the Chan Zuckerberg Initiative, funded this research. The Eunice Kennedy Shriver National Institute of Child Health & Human Development of the National Institutes of Health under Award Number P2CHD047879 supported the research reported in this publication. The content is solely the responsibility of the authors and does not necessarily represent the official views of the National Institutes of Health. We thank the editors and reviewers for their thoughtful comments. We are also grateful to participants at the author’s conference and members of the Eviction Lab who offered insightful suggestions that helped to refine this study. We thank Urban Footprint; Cumberland County, NC; Cuyahoga County, OH; and Pima County, AZ, for providing data that made this study possible.
Notes
Devin Q. Rutan is a graduate student in sociology and social policy at Princeton University. His interests include housing, material hardship, and the elderly.
Matthew Desmond is the Maurice P. During Professor of Sociology at Princeton University and the principal investigator of The Eviction Lab.
References
Supplementary Material
Please find the following supplemental material available below.
For Open Access articles published under a Creative Commons License, all supplemental material carries the same license as the article it is associated with.
For non-Open Access articles published, all supplemental material carries a non-exclusive license, and permission requests for re-use of supplemental material or any part of supplemental material shall be sent directly to the copyright owner as specified in the copyright notice associated with the article.